Abstract
In the search for antidepressants' (ADs') mechanisms of action beyond their influence on monoaminergic neurotransmission, we analyzed the effects of three structurally and pharmacologically different ADs on autophagic processes in rat primary astrocytes and neurons. Autophagy has a significant role in controlling protein turnover and energy supply. Both, the tricyclic AD amitriptyline (AMI) and the selective serotonin re-uptake inhibitor citalopram (CIT) induced autophagy as mirrored by pronounced upregulation and cellular redistribution of the marker LC3B-II. Redistribution was characterized by formation of LC3B-II-positive structures indicative of autophagosomes, which associated with AVs in a time-dependent manner. Deletion of Atg5, representing a central mediator of autophagy in MEFs, led to abrogation of AMI-induced LC3B-I/II conversion. By contrast, VEN, a selective serotonin and noradrenaline reuptake inhibitor, did not promote autophagic processes in either cell type. The stimulatory impact of AMI on autophagy partly involved class-III PI3 kinase-dependent pathways as 3-methyladenine slightly diminished the effects of AMI. Autophagic flux as defined by autophagosome turnover was vastly undisturbed, and degradation of long-lived proteins was augmented upon AMI treatment. Enhanced autophagy was dissociated from drug-induced alterations in cholesterol homeostasis. Subsequent to AMI- and CIT-mediated autophagy induction, neuronal and glial viability decreased, with neurons showing signs of apoptosis. In conclusion, we report that distinct ADs promote autophagy in neural cells, with important implications on energy homeostasis.
Keywords: autophagosome, lysosome, amitriptyline, class-III PI3 kinase, mitochondria, antidepressants
INTRODUCTION
Major depressive disorder (MDD) is a severe medical condition that raises the need for elaborated pharmacological interventions. Current generations of antidepressants (ADs) are commonly assumed to share as principle of action the influence on transmitter circuits of neuronal networks. In addition to neurons, glia cells come into focus as significant mediators of ADs' therapeutic effects (Czeh et al, 2006).
Tricyclic ADs (TCAs) were introduced in the 1950s for the treatment of MDD. The known molecular targets of TCAs range from noradrenaline and serotonin transporters to alpha2 adrenergic, nicotinic, muscarinic, and histaminergic receptors. In most cases, they exert an inhibitory effect on the respective targets (Owens et al, 1997). More recently developed ADs were designed to specifically impede the activity of neurotransmitter transporters, and are thus called selective serotonin re-uptake inhibitors (SSRIs) or selective serotonin/noradrenalin re-uptake inhibitors (SSNRIs). However, mounting evidence suggests the existence of various additional targets for both, TCAs and SSRIs/NRIs, which may be either supportive for the therapeutic effects, or at the contrary, trigger adverse events (Carvalho et al, 2010; Herr et al, 2003; Nothdurfter et al, 2010; Perisic et al, 2010).
First, ADs interfere with signaling pathways including MEK/p38/c-Jun kinases as well as with a multitude of second messenger systems (Hisaoka et al, 2007; Paez-Pereda, 2005). Second, processes involving carbohydrate and lipid metabolism are frequently altered in response to AD exposure (Raeder et al, 2006a, 2006b). Third, TCAs in particular impact the biophysical properties of cellular membranes due to their cationic amphiphilic structure that allows complex interactions with phospholipid bilayers. As a consequence, membrane fluidity, lipid composition, and membrane protein activity might be changed. Moreover, phospholipid particles might accumulate in lysosomal lamellar bodies (Alakoskela et al, 2009; Xia et al, 2000). In 1990, a study by Rodriguez-Lafrasse et al (1990) elucidated the morphology of imipramine-treated fibroblasts as resembling that of cells that originate from Niemann–Pick type-C (NP-C) disease (Rodriguez-Lafrasse et al, 1990). NP-C is one of the lysosomal storage disorders characterized by high levels of unesterified cholesterol and sphingolipids in late endosomes and lysosomes (Chang et al, 2005). Importantly, a phenomenon termed autophagy has recently been reported to be associated with Niemann–Pick type-C pathology in an NP-C1−/− mouse model (Liao et al, 2007).
Autophagy is an evolutionarily conserved mechanism that promotes the survival of stressed or starved cells by eliminating damaged macromolecules, organelles, protein aggregates, and by providing nutrients (Glick et al, 2010). Contrasting cell survival functions, extensive or impaired autophagic activity might result in type-II cell death that is different from caspase-mediated apoptosis, also called type-I cell death (Gozuacik and Kimchi, 2004). In distinct settings, autophagy is thought to act as a back-up system to execute cellular death (Shimizu et al, 2004). Several consecutive steps constitute the progression of autophagy, which are operated by a cascade of autophagy-related (Atg) genes. Initially, a phospholipid isolation membrane encloses the cytoplasmic components, building an autophagosome. Fusion of the membrane of the autophagosome with lysosomes leads to the degradation of the engulfed material by lysosomal hydrolases, producing smaller units that are subsequently recycled (Huang and Klionsky, 2002; Mehrpour et al, 2010). Most tissues maintain a basal autophagic flux under normal physiological conditions to ensure turnover of long-lived proteins and organelles. Autophagic activity is regulated by multiple pathways including Akt/mTOR-, class-III PI3 kinase (Vps34)/beclin1-, CaMKK-β/LKB1/AMP kinase-, and Raf-1/MEK/ERK-dependent signaling cascades (Corcelle et al, 2009).
Up to date, it is unclear whether there is a direct causal link between cholesterol accumulation in vacuole compartments and increased autophagy in NP-C cells, and whether autophagy might offer protection to cholesterol-burdened cells or rather drive cell elimination through type-II cell death.
Strikingly, the additional effects of some ADs described above, encompassing modulation of signaling pathways, cholesterol homeostasis, and phospholipid interaction, largely coincide with molecular factors affecting autophagy. Therefore, we investigated the impact of different ADs on the autophagic processes in primary astrocytes and neurons. Additionally, we elucidated possible mechanisms underlying autophagy induction, which involve cholesterol homeostasis and signaling pathways. Finally, we tested for functionality of autophagy by means of alterations in cellular protein and organelle turnover. Although disentangling the relevance of autophagy for the beneficial and adverse side effects of ADs will be a far reach, elucidating AD actions beyond monoamines will set the stage for a more thorough understanding of the mechanisms of action for this class of drugs.
MATERIALS AND METHODS
Drugs
Valproate (VPA), amitriptyline (AMI), citalopram (CIT), bafilomycin-A (BafA), pepstatin-A, E-64d, 3-methyladenine (3-MA), and vitamin E (VitE) were purchased from Sigma (Deisenhof, Germany). Venlafaxine (VEN) was an industrial donation (Wyeth Pharma GmbH, Münster, Germany). Stock solutions of the drugs were prepared by dissolving the substances in distilled water (VPA, AMI, CIT, VEN, 3-MA) or in 100% ethanol (BafA, pepstatin A, E-64d, VitE).
Cell Line
Atg5 wild-type and -knockout mouse embryonic fibroblasts (MEFs) were a kind gift from N Mizushima (Kuma et al, 2004). The cells were maintained in DMEM supplemented with 10% FCS (all from Invitrogen).
Preparation of Rat Primary Astrocytes and Neurons
Neocortical neurons were enriched from embryonic day 18 rat brains (Sprague Dawley; Charles River, Sulzfeld, Germany). Astrocytic cultures were initiated from postnatal day 1 animals. Dams were narcotized by isofluran inhalation and newborns were physically decapitated. Preparation and cultivation of cells was performed as described previously by Bayatti et al (2003) and Franke et al (1998).
Transfection of Primary Astrocytes and Neurons
Primary astrocytes and neurons were transfected with the pEGFP-LC3 plasmid (Addgene; originally provided by T Yoshimori) using the Nucleofactor transfection reagent and an electroporator according to the manufacturer's protocol (Amaxa, Cologne, Germany). Briefly, astrocytes of the second passage were trypsinized and subsequently 2 × 10⁶ cells were applied to electroporation with 5 μg of plasmid DNA. Cells were seeded in a 24-well plate and allowed to recover for 24 h in MEM/10% horse serum. After 24 h the cell culture medium was changed to MEM/HAM F12 (1:1) N2-supplemented (1%) medium. The cells were stimulated with the indicated concentrations of AMI for 12 or 24 h. Similar to astrocytes, 5 × 10⁴ neurons were transfected with 500 ng of plasmid and processed in analogy to astrocytes, except using Neurobasal medium after recovery.
UPR Reporter Gene Assay
Transfection of astrocytes was performed as described before, and reporter gene assays were performed in accordance with Schűlke et al (2010). The vectors used included the constitutively active SV40-driven Gaussia-KDEL for normalization of transfection efficiency and ERSE-I-Luciferase (Bouman et al, 2010). After transfection of 200 ng of Gaussia-KDEL and 1 μg of ERSE-I-Luciferase per 2 × 10⁶ astrocytes, cells were allowed to recover for 48 h; the medium was then changed to MEM/F12/N2 together with drug stimulation as specified in the section Results.
Cell Viability Assays
LDH assay. Release of lactate dehydrogenase (LDH) into the growth medium of astrocytes served as indicator for membrane disruption and cell death. The assay was performed in accordance to the LDH cytotoxicity detection system (Clontech, Mountain View, CA, USA) pursuant to the manufacturer's protocol. As negative control, empty wells were used with medium only; as positive control, 0.02% Triton X-100 was added to the assay medium 1–2 h prior to the assay.
MTT assay. Neurons were incubated in the presence of 0.5 mg/ml MTT reagent (tetrazole 3-(4,5-dimethylthiazol-2-yl-)-2,5-diphenyltetrazolium bromide) for 4 h at 37 °C under 5% CO2. Read-out of MTT metabolism was performed as described previously by Moosmann et al (2001). ADs interfered with the MTT assay in astrocytes and produced artificial results; therefore, the MTT was substituted by the LDH release assay (Berridge and Tan, 1993; Liu et al, 1997).
TUNEL assay. TUNEL assay was performed following the procedure described by Roche. Cells on coated glass coverslips (see also Immunocytochemistry below) were washed with PBS and fixed with 4% paraformaldehyde for 1 h. After rinsing with PBS, cells were permeabilized with 0.1% sodium citrate/0.1% Triton X-100 for 2 min on ice and incubated with the TUNEL reaction mix including terminal transferase for 60 min at 37 °C. Subsequent to three washes with PBS and mounting, cells were analyzed at 515 nm using a Zeiss Axioplan-2 fluorescence microscope.
Western Blot Analysis
Protein extracts were obtained by lysing neural cells in buffer containing 21 mM Tris/HCl (pH 6.8), 0.66% SDS, and 3.33% sucrose, supplemented with protease inhibitor cocktail (Sigma). Western blot was performed as described previously by Perisic et al (2010). Immunoreactive bands were visualized using the ECL detection reagent (Millipore, Billerica, MA, USA). The following primary antibodies were used: anti-LC3B (1:1000, no. 2775; Cell Signaling), anti-beclin1 (1:2000, no. 3738; Cell Signaling) anti-cleaved caspase-3 (1:500, no. D175; Upstate), and anti-α-actin (1:2500, no. A2066; Sigma), anti-Hsc70 (1:1000, no. sc-7298; Santa Cruz).
Real-Time PCR analysis
Total RNA was isolated from astroglial and neuronal cells according to the manufacturer's protocol of NucleoSpin RNA II (Macherey-Nagel, Germany). In total, 300 ng of purified RNA was reverse transcribed using random primers (Promega) and Omniscript Reverse Transcriptase (Qiagen). Based on the LightCycler System (Roche Applied Science, Germany) and SYBR green detection (QuantiFast SYBR Green; Qiagen), quantitative assessments of HMG-CoA reductase and Niemann–Pick type-C 2 (NPC2) cDNA levels were performed. β-Actin PCR was performed serving as endogenous control for normalization. The primers used are listed in Supplementary Table 1. Relative changes of gene expression were calculated using the comparative ΔΔCT method (Livak and Schmittgen, 2001).
Cholesterol Determination
Cellular cholesterol concentrations were determined either in whole-cell lysates or in cytoplasmic fractions. Extracts for whole-cell lysates were prepared using 50 mM Tris (pH 8.0), 2 mM CaCl2, 80 mM NaCl, and 1% Triton X-100. In case of fractionation, cells were washed with ice-cold PBS, trypsinized, and pelleted by centrifugation. Cell pellets were resuspended in 1 ml of homogenization buffer (50 mM Tris/HCl (pH 7.9), 126 mM NaCl, 5 mM KCl). Homogenization was performed by using a Dounce homogenizer and a Branson sonicator (15-s pulsed bursts, 90% output). The homogenized sample was spun at 800 g for 10 min at 4 °C. The obtained post-nuclear supernatant was centrifuged for an additional 1 h at 4 °C and 100 000 g. The supernatant, representing the cytoplasmic fraction, was directly processed for cholesterol determination. Free cholesterol was measured using the AmplexRed Cholesterol Assay (Invitrogen) according to the manufacturer. Per sample, an equivalent volume of 6 μg protein was subjected to the assay. Fluorometric readings were performed at 595 nm using a Tecan plate reader.
Measurement of Long-Lived Protein Turnover
The treatment regime of astrocytes and neurons was as described in the section Results (Figure 8a). At the last day of AMI treatment, cells were labeled with 2 μCi 3H-leucine per well/12-well plate. After 24 h of labeling, cells were washed two times with MEM/F12/N2 and incubated with medium supplemented with 2.4 mM leucine. Four hours later the medium was changed again, and medium was collected after 8 h. In parallel, cells were lysed in buffer containing 10 mM Tris/HCl (pH 8.0), 150 mM NaCl, 2 mM EDTA, 0.5% deoxycholate, and 2% NP-40. The medium and lysates were adjusted to 1% BSA used as a carrier protein and 20% trichloroacetic acid, incubated for 10 min on ice, and spun at 12 000 r.p.m. for 10 min. The trichloroacetic acid-insoluble pellet was dissolved in 0.2 N NaOH at 60 °C. Total radioactivity from the supernatant and dissolved pellet was measured by scintillation counting, and ratios of trichloroacetic acid-soluble/insoluble fractions per treatment condition were calculated.
Fluorometric Quantification of Lysosomes
The amount of acidic vacuoles (AVs) was fluorometrically assessed at the cellular level. The medium of cells grown in six-well plates was changed to fresh medium containing a 1:20 000 dilution of Lysotracker Red (LysoRed) and a 1:2000 dilution of CellTracker Green (all from Invitrogen), within the same well. The dye-supplemented medium was kept on cells for 30 min and subsequently cells were allowed to recover in medium without dye. Subsequently, cells were trypsinized and the cell pellet was resuspended in 100 μl phenol red-free medium and transferred to a 96-well plate. Readings were performed at the appropriate wavelength using a Tecan plate reader, using CellTracker Green for normalization to the cell number.
Cellular Staining of Free Cholesterol
Cells grown on coated glass coverslips were washed with PBS, fixed with 3% paraformaldehyde in PBS for 20 min at room temperature (RT), and rinsed with 1.5 mg glycine/ml PBS for 20 min. After quenching cells were washed again with PBS and subsequently incubated with the filipin staining solution (50 μg/ml filipin, 10% goat serum, 90% PBS) at RT for 2 h in the dark. Staining was completed by three additional PBS washes, and by mounting with the Prolong antifade reagent (Invitrogen). The excitation wavelength was 351 nm.
Immunocytochemistry
Cells grown on poly-ornithin/laminin (all 0.1 mg/ml) coated glass coverslips were briefly washed with PBS and fixed at RT for 10 min with 4% formaldehyde in PBS. The cells were permeabilized by rinsing two times (10 min) with PBS containing 0.05% saponin. After permeabilization, cells were incubated in blocking solution (10% goat serum in PBS) for 60 min. The coverslips were treated overnight at 4 °C with an LC3B, GFAP (no. 20334; Dako), or MAP2 (no. M2320; Sigma) primary antibody (all 1:200 in PBS/0.05% Triton and 10% goat serum). After three washes with PBS/0.05% Triton, cells were incubated with the secondary antibody for 1 h at RT (IgG conjugated with Cy2, diluted 1:200 in PBS/0.05% Triton; Dianova). Finally, cells were washed three times in PBS, nuclei were counterstained with 5 μg/ml 4′,6-diamidino-2-phenylindole (DAPI), and slides were mounted with Prolong Antifade (Molecular Probes). Cells were visualized using either a Olympus confocal laser-scanning microscope (FV1000) or the Olympus DP50 microscope.
Statistics
Experiments with statistics were generally performed three times, with similar results. Data were collected from independent experiments and significance between treatment and control groups was further analyzed using Student's t-test.
RESULTS
We analyzed the impact of three different ADs, the TCA AMI, the SSRI CIT, and the SNRI VEN, on autophagy and associated processes. As the mood-stabilizer VPA has recently been reported to induce autophagy in glioma cells, we also included VPA that is frequently administered as augmentation therapy of MDD. For all the ADs tested, the drugs were applied at concentrations between 1 and 10 μM. According to studies in rodents, similar and higher concentrations are achieved in brain tissue that generally shows enrichment of certain drugs as compared with serum levels (Glotzbach and Preskorn, 1982; Holladay et al, 1998). We used primary astrocytes as well as neurons from cerebral hemispheres to analyze possible cell type-specific differences.
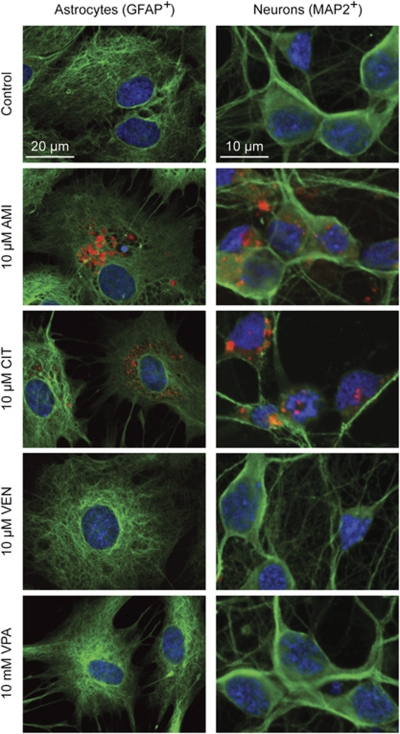
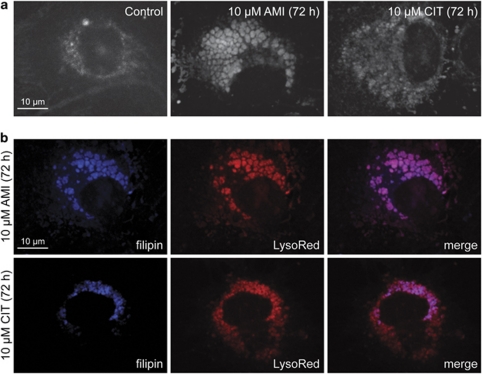
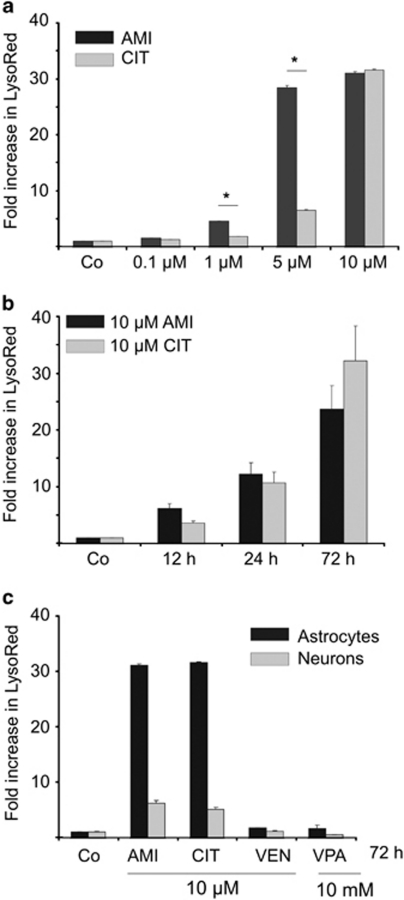
ADs show differential effects on vacuolization in astrocytes and neurons. We first evaluated the sub-cellular features of drug-treated astrocytes and neurons focusing on vacuolar structures. In case of AMI and CIT exposure, astrocytes developed several layers of perinuclear AVs occupying a significant part of the cytosol, whereas VEN and VPA did not promote vesicle formation (Figure 1). The overall shape of cells was not grossly changed after incubation with AMI and CIT, although some cytoskeletal rearrangements occurred as reflected by GFAP staining. This is in basic agreement with the observation that the TCA desipramine does not markedly induce cellular changes of C6 glioma cells (Donati et al, 2001). When cells were co-treated with 20 nM BafA, an inhibitor of the proton pump V-ATPase that acidifies various organelles, vacuolization was disrupted (Supplementary Figure S1). Further, AVs were enriched in free cholesterol as shown by filipin staining (Figure 2). In neurons, formation of AVs upon treatment with AMI or CIT could also be observed. Using a quantitative fluorometric technique to evaluate the potency of the applied drugs to promote AV formation, we found AMI to be more effective than CIT at 1 and 5 μM (Figure 3a), whereas both substances showed a similar effect size at the highest concentration of 10 μM in astrocytes. Time-course experiments showed rapid onset of AV formation as early as 12 h after commencing exposure with AMI or CIT (10 μM) (Figure 3b). In neurons, the magnitude of increase in LysoRed signal was ∼5-fold lower as compared with that in astrocytes. VEN and VPA did not promote the formation of AVs in either cell type (Figure 3c). Together, AMI and CIT increase AVs in a dose-, time-, and cell type-dependent manner.
Figure 1.
ADs diversely induce the formation of cytoplasmic vacuolic structures in primary astrocytes and neurons. Fluorescence images of astrocytes and neurons exposed to AMI, CIT, and VEN (all 10 μM, 72 h), as well as VPA (10 mM, 72 h). AVs were visualized by LysoRed staining (red). The identity of cells was validated by immunocytochemistry using glial fibrillary acidic protein (GFAP+) and microtubule-associated protein-2 (MAP2+) (green) as specific marker for glial and neuronal origin. Cell nuclei were counterstained with DAPI (blue).
Figure 2.
Free cholesterol accumulates in the AVs of astrocytes. (a) Astrocytes were treated with AMI or CIT (each at 10 μM, 72 h), and free cholesterol was visualized using filipin dye. (b) An overlay of LysoRed- and filipin-derived fluorescence signals reveals colocalization of AVs and free cholesterol in AMI- and CIT-treated astrocytes.
Figure 3.
Quantification of AVs shows a dose- and time-dependent increase in response to ADs. (a) Various concentrations of AMI and CIT ranging from 0.1 to 10 μM were applied to cortical astrocytes for 72 h and generation of AVs was determined by staining with LysoRed. CellTracker Green signal was used for normalization on cell number and volume. Control has been set to 1 (mean±SD, n=3, *p⩽0.05). (b) The time course (12–72 h) of 10 μM AMI and CIT exposure of cortical astrocytes and subsequent relative LysoRed quantification (control set to 1). (c) Comparison of AV production in astrocytes (black bars) and neurons (gray bars). Cells were treated with AMI, CIT, VEN, and VPA at the indicated concentrations for 72 h. The graph depicts fold increase in LysoRed signal compared with the untreated control (set to 1).
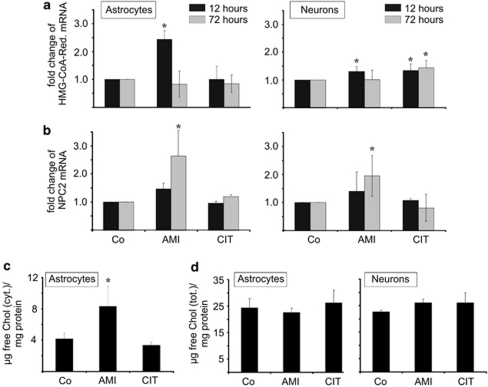
AMI, but not CIT, modulates cholesterol biosynthesis and trafficking pathways. We next asked whether the appearance of free cholesterol in AVs after AMI/CIT exposure is related to increased cholesterol biosynthesis or to an altered activity of genes responsible for cholesterol trafficking. The expression level of the rate-limiting enzyme of cholesterol biosynthesis, HMG-CoA reductase, is a well-established predictor of cellular changes in cholesterol homeostasis. Short-term treatment with AMI (10 μM, 12 h) led to a subtle elevation of HMG-CoA reductase mRNA levels, with astrocytes responding stronger than neurons, whereas no effects were observed after 72 h (Figure 4a). By contrast, CIT did not affect HMG-CoA reductase transcription in astrocytes, and only faintly in neuronal cultures. As HMG-CoA reductase expression changes could impact cellular cholesterol concentrations, we determined the levels of cytoplasmic and total cholesterol. The cytoplasmic levels of free cholesterol (Figure 4c) were modestly elevated in astrocytes after treatment with AMI, but not CIT (72 h, 10 μM each), possibly reflecting the differential effect of these drugs on HMG-CoA reductase expression. There were no changes in total cholesterol, neither in astrocytes nor in neurons (Figure 4d). In general, the cytoplasmic cholesterol of untreated astrocytes made up for ∼18% of the total cholesterol (4.17±0.71 μg cytoplasmic cholesterol/mg protein vs 24.4±3.5 μg total cholesterol/mg protein). Due to under-representation of the cytoplasmic cholesterol fraction, the observed two-fold increase of cytoplasmic cholesterol levels after AMI incubation is apparently not mirrored in total cholesterol changes.
Figure 4.
Effects of AMI/CIT on neural cholesterol homeostasis. (a, b) Expression analysis of HMG-CoA reductase (a) and NPC2 mRNA (b) levels in astrocytes and neurons that were incubated with either 10 μM AMI or CIT for the indicated time periods. Real-time PCR quantification of HMG-CoA reductase and NPC2 mRNA levels was normalized to the respective levels of actin (n=3, mean±SD, *p⩽0.05 vs control). (c, d) AMI evokes cytoplasmic rise in free cholesterol (c), but leaves total cholesterol unaffected (d). Total and cytoplasmic extracts were prepared from cortical astrocytes treated with 10 μM AMI or CIT for 72 h. Data are depicted as μg of free cholesterol per 1 mg of protein (n=3, mean±SD, *p⩽0.05 vs control). In addition, cholesterol concentrations in total extracts of drug-exposed neurons were also determined using AmplexRed (d).
As accumulation of cholesterol in AVs could be also explained by aberrant cholesterol trafficking, we analyzed a key regulator of cholesterol shuttling, the NPC2 whose gene product coordinates the egress of free cholesterol from lysosomes for delivery to the endoplasmatic reticulum and other sub-cellular compartments (Xu et al, 2008). Real-time PCR showed a time-dependent upregulation of the NPC2 coding mRNA by AMI (Figure 4b), indicating an intact molecular response to elevated cytoplasmic cholesterol levels. Conversely, CIT, that did not affect cholesterol synthesis, also did not alter the expression of NPC2. Taken together, overall cholesterol levels are not altered, and the drug-induced accumulation of free cholesterol in lysosomes is not generally linked to enhanced cholesterol synthesis or to defective NPC2 gene regulation.
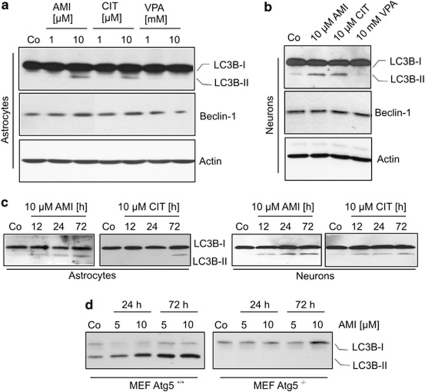
AMI and CIT enhance the expression of autophagic markers. Cellular vacuolization as observed in the etiopathology of NP-C has recently been reported to come along with autophagy in cell culture and animal models (Liao et al, 2007; Pacheco et al, 2007). Autophagic processes are accompanied by pre- and post-translational changes in Atg expression status, which are also used as markers for autophagy. The microtubule-associated protein light chain-3 (LC3B-I) becomes conjugated with phosphatidyl ethanolamine to form LC3B-II that integrates into the autophagosomal membrane. Atg6/beclin1 is a constituent of the class-III PI3 kinase complex that is frequently upregulated during progression of autophagy. In astrocytes, we observed a well-defined LC3B-I-to-LC3B-II conversion indicative of autophagosome formation at a concentration of 10 μM AMI and CIT (72 h), whereas VPA (1, 10 mM), VEN (1, 10 μM, data not shown), and lower doses of AMI/CIT (1 μM) had no effect (Figure 5a). LC3B-II-positive signals were monitored already after 12 h of AMI (10 μM) exposure and steadily increased during 60 h thereafter. Response to 10 μM CIT emerged at a later time point at 72 h (Figure 5c). Concomitantly to LC3B-II induction, beclin1 expression was subtly upregulated upon treatment with AMI/CIT. In neurons, beclin1 expression was stable and unchanged after AMI, CIT (both 10 μM, 72 h), and VPA (10 mM, 72 h) application (Figure 5b). However, we also observed a promotion of LC3B-I conversion in neuronal cultures under the influence of AMI and CIT (10 μM, 72 h), with a time dependence similar to that in astrocytic cultures (Figure 5b and c).
Figure 5.
Effects of psycho-active drugs on autophagic markers LC3B-II and beclin1. (a, b) Extracts of astrocytes (a) and neurons (b) exposed to AMI, CIT, and VPA at the indicated concentrations were subjected to Western blotting for analysis of LC3B-I/II and beclin1. Actin immunoreactivity served as loading control. (c) The time course of LC3B-II induction upon treatment with AMI and CIT. (d) Treatment of wild-type and Atg5-knockout MEF cells with AMI at the specified concentrations and time periods shows dependency of LC3B-II induction on Atg5.
Although classified as functional autophagosomal marker, LC3B-I/II might occasionally be incorporated into protein aggregates when autophagy is blocked (Cieehomska and Tolkovsky, 2007; Szeto et al, 2006). Therefore, to corroborate that drug-induced accumulation of lipidated LC3B-II is indeed dependent on enhanced autophagic pathways, we first investigated the effects of AMI in autophagy-deficient MEFs. These cells are devoid of the gene Atg5, whose product acts in concert with Atg12 in the formation of autophagosomes. Even at the highest concentration of AMI (10 μM, 72 h), there was no increase in LC3B-II, whereas Atg5 wild-type MEF cells responded with a strong accumulation of LC3B-II upon AMI exposure (Figure 5d). Second, we analyzed the distribution of an ectopically expressed GFP-LC3 fusion protein in dependence on AMI exposure (10 μM, 12 h) in primary cortical astrocytes (Figure 6a and b) and neurons (data not shown). We observed a pronounced punctuate pattern of GFP-LC3 signals after AMI treatment, whereas the number of GFP-LC3 clusters was by far lower in untreated cells. Thus, all these data indicate that AMI and CIT induce the generation of autophagosomes.
Figure 6.
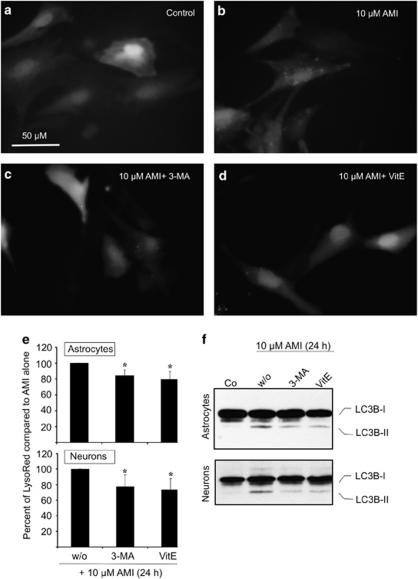
AMI impacts ectopically expressed GFP-LC3—contribution of the class-III PI3 kinase pathway and ROS. (a–d) Astrocytes (∼2 × 10⁶) were transfected with 5 μg of EGFP-LC3 expression plasmid and allowed to recover for 24 h. The horse serum-containing medium was changed to MEM/F12/N2 and treatment was started for 12 h with 10 μM AMI alone (b) or in combination with 3 mM 3-MA (c) or 150 μM VitE (d). (e, f) Astrocytes and neurons were treated with 10 μM AMI together with either 3 mM 3-MA or 150 μM VitE for 24 h. (e) Cells were incubated for 30 min with LysoRed and CellTracker Green dye, and dissociated by trypsinization for determination of fluorescence intensities. Corrected LysoRed intensity has been set to 100% in the case of AMI treatment without (w/o) inhibitors (mean±SD, n=3, *p⩽0.05 vs control). (f) Lysates of treated and untreated astrocytes and neurons were probed for endogenous LC3B-I/II protein levels by applying Western blot analysis.
Class-III PI3 kinase-dependent pathways contribute to AD-induced autophagic processes. As class-III PI3 kinase-dependent pathways are frequently involved in the generation of autophagosomes, we tested whether they are targeted by ADs. We used the specific pharmacological inhibitor 3-MA (3 mM) and measured the number of GFP-LC3-positive speckles, the amount of AVs, as well as the extent of endogenous LC3B-II induction after exposure to AMI or CIT (both 10 μM). We first monitored the redistribution of the ectopic GFP-LC3 protein in transiently transfected astrocytes treated with 10 μM AMI alone or in combination with 3 mM 3-MA (both for 12 h). Co-incubation led to a reduction of the number of GFP-LC3-positive speckles as compared with AMI exposure alone (Figure 6b and c). Astrocytes also responded with a reduced formation of AVs after combined AMI and 3-MA treatment (all for 24 h; 84.35%±7.42 compared with AMI alone (set to 100%)) (Figure 6e). Similar findings were obtained for CIT and 3-MA co-treatment (data not shown). Likewise, in the presence of 3-MA, the induction of endogenous LC3B-II by AMI was attenuated (Figure 6f). In neurons, the influence of 3-MA on the drug-induced formation of AVs as well as LC3B-II was similar to that in astrocytes (Figure 6e and f).
As ADs have been reported to positively affect reactive oxygen species (ROS) generation, and ROS positively influence autophagy (Cordero et al, 2009; Scherz-Shouval and Elazar, 2007), we also included the radical scavenger VitE (150 μM) in this study. Indeed, VitE in combination with 10 μM AMI slightly reduced the quantity of GFP-LC3B-II-positive puncta (Figure 6d), AVs, as well as endogenous LC3B-II signals in astrocytes or neurons (Figure 6e and f). In this context, ROS might facilitate an unfolded protein response (UPR) of the endoplasmatic reticulum, which in turn is capable of activating autophagy (Harding et al, 2003; Hoyer-Hansen and Jaattela, 2007). Therefore, we asked whether UPR is triggered due to treatment with AMI or CIT in astrocytes by using reporter gene assays. The reporter plasmid used contained an Endoplasmatic Reticulum Stress Responsive Element (ERSE), which indicates the upregulation of the transcription factors involved in UPR. Subsequent to transfection, astrocytes were treated with 1 or 10 μM AMI or CIT for 16 h and assayed for luciferase activity. Whereas tunicamycin used as positive control induced a significant upregulation of reporter gene expression, AMI and CIT did not produce a UPR (Supplementary Figure S2).
Together, these data suggest that signaling pathways involving class-III PI3 kinase as well as ROS (without UPR contribution) contribute to the extent of drug-induced AV and LC3B-II formation.
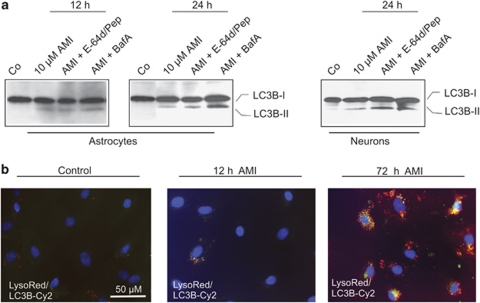
Autophagic flux is functional in AMI- and CIT-exposed astrocytes. Subsequent to autophagosome formation, the cargo-containing vesicles fuse with lysosomes to form auto-lysosomes, followed by break-down and recycling of their contents. The rate of autophagosome turnover is also termed autophagic flux. The observed increase in LC3B-II signals could either be owing to an enhanced autophagosome production and autophagic flux, or a reduced turnover of autophagosomes. To address this question, we determined LC3B-II levels after AMI treatment in combination with either the proton ATPase inhibitor BafA (20 nM) or the protease inhibitor mix pepstatin-A/E-64d (10 μg/ml each). If AMI increases the extent of autophagy and augments the number of autophagosomes for degradation, combined treatment with BafA or protease inhibitors should result in a considerable increase of the autophagosomal marker LC3B-II. After 24 h of AMI co-treatment, BafA indeed led to a marked elevation of LC3B-II levels in astrocytes, whereas pepstatin-A/E-64d produced smaller effects. These effects were not detectable after 12 h, suggesting that autophagic flux requires a definite time to be established (Figure 7a). Again, neurons showed a similar response. To corroborate these results, we additionally performed immuno-colocalization experiments in order to track LC3-II signals in relation to AVs in astrocytic cells. After 12 h of 10 μM AMI treatment, only a small number of LC3-II immunoreactive spots were observed in a few cells that mostly did not colocalize with LysoRed. Later, the number of LC3B-II speckles per cell as well as LC3B-II-positive cells drastically increased, and to some degree LC3B-II signals overlapped with LysoRed-positive AVs after 72 h (Figure 7b). In conclusion, these results indicate a stimulatory effect of AMI on the production of autophagosomes and subsequent autophagic flux.
Figure 7.
Autophagosome turnover is not affected by AMI in cortical astrocytes. (a) Astrocytes and neurons were treated with 10 μM AMI for the indicated time periods combined with the ATPase inhibitor BafA (20 nM) or the protease inhibitor mix E-64d/pepstatin-A (10 μg/ml each). Cellular lysates were analyzed by Western blotting using antibodies against LC3B. (b) Subsequent to exposure to AMI (10 μM; 12 and 72 h), astrocytes were first stained in vivo with LysoRed dye for 30 min and eventually subjected to immunocytochemistry using an LC3B-specific primary antibody and a Cy2-coupled secondary antibody. DAPI dye served to counterstain cell nuclei.
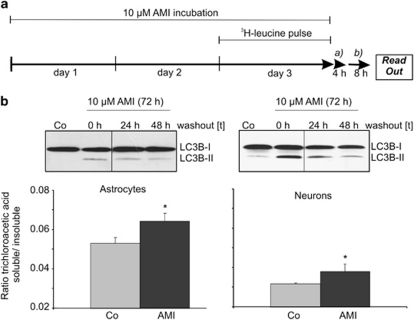
Protein turnover is enhanced in AMI-treated astrocytes and neurons. Many species of long-lived proteins are degraded through the autophagic pathway. We therefore addressed the question if turnover of long-lived proteins is affected by AMI treatment in neurons and astrocytes. Cells were first treated with 10 μM AMI for a period of 72 h, at which a pulse with 3H-labeled leucine was set in the last 24 h of AMI treatment. After a pre-chase period of 4 h using an excess of cold leucine to deplete radiolabeled short-lived proteins, cells were cultivated for an additional 8 h in a medium devoid of AMI, and trichloroacetic acid-soluble and insoluble material were measured from cell lysates and supernatants (Figure 8a). The trichloroacetic acid-soluble material represented the fraction of degraded proteins. The levels of the LC3B-II marker continued to be elevated, even 24 and 48 h after wash-out of AMI (Figure 8b). Increased levels of trichloroacetic acid-soluble components were detected in AMI-exposed astrocytes and neurons, suggesting accelerated proteolysis of endogenous long-lived proteins to smaller 3H-containing metabolites (Figure 8b).
Figure 8.
AMI enhances the turnover of long-lived proteins. (a) The scheme depicts the treatment regime and 3H-leucine-labeling procedure, including the pre-chase (a) and chase (b) periods for astrocytes and neurons. (b) After 4 h of pre-chase and 8 h of chase, supernatants and cell lysates were collected and separated into trichloroacetic acid-soluble and insoluble fractions. After determination of c.p.m. values, the ratios of trichloroacetic acid-soluble vs insoluble fractions were calculated (mean±SD, n=2, *p⩽0.05 vs control). Western blot analysis of cellular extracts derived from astrocytes and neurons previously treated with AMI (10 μM, 72 h) followed by an either 24- or 48-h wash-out period, or without a wash-out (0 h) period, proofed maintained expression of the autophagy marker LC3B-II also in the absence of the stimulus.
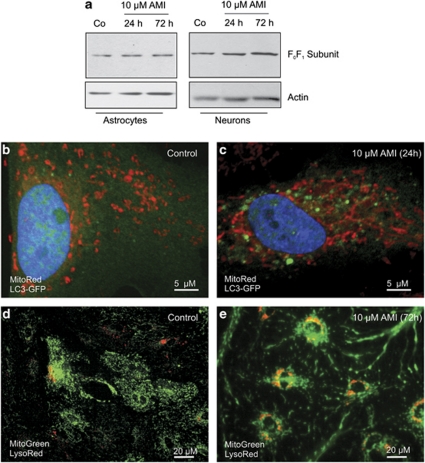
Effects of AMI on mitophagy. Apart from degradation of long-lived proteins, cellular organelles such as dysfunctional mitochondria might also be subjected to autophagy-mediated removal, a phenomenon called mitophagy. Thus, we elucidated the possibility of a globally augmented autophagy-mediated clearance of damaged mitochondria in the course of AMI treatment. First, we determined the protein levels of the mitochondria-specific F0F1 subunit after 24 and 72 h of 10 μM AMI treatment. Neither neurons nor astrocytes responded with decreased immunoreactive signals corresponding to the F0F1 subunits, indicating no significant degradation of mitochondrial organelles (Figure 9a). At the cellular level, we tracked the ectopically expressed GFP-LC3 together with fluorescence-stained mitochondria in astrocytes, and could not detect merging signals under conditions of short-term treatment with 10 μM AMI (24 h) (Figure 9b and c). Finally, we recorded the localization of mitochondria in relation to lysosomes. After 72 h of 10 μM AMI treatment, the degree of overlap between MitoTracker Green-stained mitochondria and LysoRed-stained AVs was rather small and indistinguishable from control cells (Figure 9d and e). Hence, mitochondria are no major target of AMI-triggered autophagic processes.
Figure 9.
Mitochondria are no substrates for AMI-induced autophagy. (a) Astrocytes and neurons were treated as indicated and extracts were probed with antibodies against the F0F1 subunit of the mitochondrial ATPase complex. Actin immunodetection was used as control for protein loading. (b, c) Astrocytes were transfected with pEGFP-LC3, and 24 h after transfection cells were treated with 10 μM AMI (24 h) and stained in parallel with MitoTracker Red. After completion of AMI treatment, cells were fixed, nuclei were stained with DAPI, and visualized by confocal microscopy. (d, e) Astrocytes treated with 10 μM AMI for 72 h were subsequently stained for AVs (LysoRed) as well as for mitochondria (MitoGreen).
Glial viability is not severely compromised by AMI/CIT-induced autophagy. Autophagy primarily represents an adaptive and cytoprotective process that strives for the re-establishment of physiological cellular states. On the other hand, autophagy might also lead to, or at least coincide with, type-II cell death when reaching excessive levels or failing to cope with stressful situations. To test for a connection between drug-induced autophagy and cell viability, we determined the effects of the applied drugs on cell viability parameters using either LDH release or MTT assays in the case of astrocytes and neurons, respectively (Table 1). Of all the ADs tested, the cytotoxic effects of VEN were least prominent in neurons and astrocytes, whereas AMI and CIT exposure at the highest concentrations (10 μM each, 72 h) caused ∼25% increase in LDH release in astrocytes as compared with 30–45% cell death in neurons as determined by MTT assay. Of all the drugs tested, the mood stabilizer VPA exerted the strongest cytotoxic effects.
Table 1. Evaluation of Neuronal and Astroglial Viability after Drug Exposure.
|
VPA (mM) |
AMI (μM) |
|||||
|---|---|---|---|---|---|---|
| 1 | 5 | 10 | 1 | 5 | 10 | |
| Astrocyte | 74.42±9.44a | 59.92±7.21a | 49.62±11.58a | 80.53±10.09b | 76.41±10.67b | 73.94±7.66b |
| Neuron | 82.35±18.49a | 80.25±10.70a | 56.40±6.43a | 89.31±7.87a | 74.42±8.03a | 55.37±0.52a |
|
CIT (μM) |
VEN (μM) |
|||||
| |
1 |
5 |
10 |
1 |
5 |
10 |
| Astrocyte | 88.09±5.62b | 89.86±10.75b | 78.22±5.50b | 98.02±9.29a | 92.87±9.06a | 87.1±11,45a |
| Neuron | 98.63±15.38a | 86.48±4.38a | 71.11±16.11a | 97.33±9.38a | 102.84±3.28a | 101.8±4.0a |
Primary astrocytes and neurons were treated with the indicated substances for 72 h. The values are percent of cell viability as compared with untreated control (set to 100%).
MTT assay.
LDH release assay.
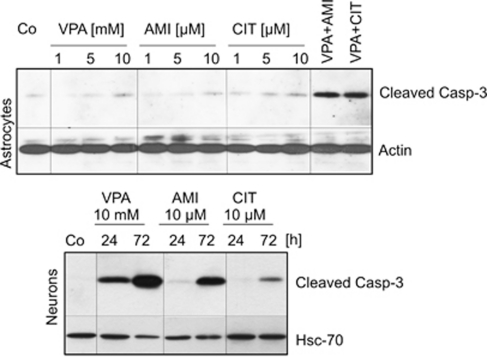
Following up the moderately harmful effects of AMI, CIT, and VPA at higher concentrations, we intended to define whether type-I (caspase-mediated) or type-II cell death is attributable. We used two different markers of type-I cell death, namely cleaved procaspase-3 and DNA fragmentation. Astrocytes were exposed to increasing concentrations of AMI (1–10 μM), CIT (1–10 μM), and VPA (1–10 mM VPA) for 72 h and cleaved pro-caspase-3 was monitored by Western blot analysis. Solely 10 mM VPA exposure led to a subtle induction of pro-caspase-3 cleavage, whereas AMI and CIT did not exert any effect. Co-incubation of AMI or CIT with VPA produced marked caspase-3 activation (Figure 10). Accordingly, DNA fragmentation was not present in cells exposed to AMI or CIT as determined by TUNEL assay (data not shown). Unlike astrocytes, neurons reacted with a pronounced induction of pro-caspase-3 cleavage in response to VPA (10 mM) and to a smaller extent to AMI (10 μM) and CIT (10 μM). VPA treatment provoked the fastest response, whereas pro-caspase-3 cleavage emerged within a time span of 72 h in the case of AMI and CIT application (Figure 10). Drug-treated neurons also showed a number of nuclei containing fragmented DNA as evidenced by TUNEL staining, and the extent of fragmentation clearly correlated with the intensity of pro-caspase-3 cleavage (data not shown).
Figure 10.
Neurons show activated caspase-3 response as a result of drug application. Astrocytes and neurons were treated as indicated, and lysates were probed for cleaved caspase-3. Co-treatments were performed with AMI and VPA or CIT and VPA at the specified concentrations. Actin- and Hsc70-specific antibodies served to ensure equal protein loading.
DISCUSSION
In the present study, we show for the first time that the ADs AMI and CIT stimulated autophagic processes in astrocytes and neurons. VEN and VPA did not elicit signs of increased autophagy in either cell type. Applied at higher concentrations, AMI/CIT evoked major features of autophagy including upregulation of LC3B-II and enhanced proteolysis of long-lived proteins. The autophagic flux appeared to be unhampered after AMI treatment, even though free cholesterol accumulated in the AV/lysosomal compartments. AMI partially acted through class-III PI3 kinase (Vps34) and ROS-dependent signaling pathways, as 3-MA and VitE diminished the effects of AMI-induced autophagic marker production. The enzymatic activity of Vps34 is regulated by an orchestrated action of Vps15, beclin1, and UVRAG that are all found at nearly stoichiometric levels in a core complex with Vps34 (Zhong et al, 2009). Thus, AMI impacts autophagy through a central complex that governs the nucleation of autophagic vesicles and therefore participates in the central step of autophagy initiation.
Recent studies derived from NP-C disease models suggested that distinct physiological states such as altered cholesterol trafficking might also promote autophagy (Liao et al, 2007; Pacheco et al, 2007). NP-C disorder is characterized by disturbances in lipid and cholesterol shuttling and elevated levels of autophagic markers. Analysis of NP-C-derived fibroblasts showed ∼10-fold increase of intracellular cholesterol pools mainly localized in the AVs yet unchanged membrane cholesterol levels as compared with those in normal fibroblasts (Lange et al, 2000). The lysosomal influx of cholesterol is considered to be abnormally high, which is ascribed to non-functional NP-C proteins. As NP-C disease features many aberrant intracellular events, it is challenging to decipher potential attributions of altered cholesterol homeostasis and vacuolization to activated autophagic pathways.
Interestingly, treatment of fibroblasts with amphiphilic substances mimics certain aspects of the NP-C phenotype including vacuolization, a substantial rise in cytoplasmic cholesterol content, and its redistribution into AVs (Anderson and Borlak, 2006). Cationic amphiphilic drugs (CADs) including AMI, CIT, and VEN belong to a class of compounds consisting of a hydrophobic ring structure and a side chain with a charged cationic amine group. Also AMI and CIT induced the formation of cholesterol-loaded AVs, but only AMI positively affected cholesterol synthesis ultimately leading to slightly increased cytoplasmic cholesterol levels, which were not reflected in total cell cholesterol content. Similarly, treatment of C6 glioma cells with desipramine did not change total cholesterol levels (Donati and Rasenick, 2005). The slight increase of cholesterol biosynthesis observed in AMI-treated cells might take place in order to compensate for lysosomally captured cholesterol. The extent of change in cytoplasmic cholesterol levels was magnitudes lower compared with that in NP-C derived fibroblasts or class-I amphiphile (U18666A)-treated cells (Lange et al, 2000). In parallel to AMI-induced elevated cytoplasmic cholesterol concentrations, the cholesterol-trafficking gene NPC2 was upregulated, indicating that the respective regulatory mechanism of cholesterol shuttling is not fundamentally disturbed. Similar effects of ADs on HMG-CoA reductase and NPC2 regulation are known for cell lines (Raeder et al, 2006b; Vik-Mo et al, 2009). From our data we conclude that AV formation and concomitant cholesterol sequestration does not depend on augmented cholesterol biosynthesis or aberrant expression of NP-C as reported for NP-C disorder. It might be rather related to the biophysical properties of AMI and CIT acting as CADs in processes related to lysosomal lipid/cholesterol aggregation. Lysosomal structures in turn might facilitate autophagy induction. Altogether, a multitude of biophysical and biochemical modes of action of AMI and CIT seem to route the chronological progress of vacuole formation and autophagy in a dose-dependent manner. The CAD VEN neither induced vacuolization nor autophagy, implying that additional factors determine the outcome in vesicle formation and autophagy.
Autophagy-modulating compounds are considered to be promising future therapeutics for the treatment of cancer and neuropsychiatric disorders. Up to date, a number of exogenous factors have been identified that influence autophagy with a remarkable variety of modes of action as well as cell type specificity. Among the group of regulators are rapamycin, cadmium ions, VPA, lithium, and fluoxetin. Rapamycin represents a ubiquitous inducer of autophagy as it inhibits mTOR kinases. The mTOR kinase is a key switch to keep autophagic pathways operating at low levels, where inhibition of mTOR results in the release of positive regulators of autophagy (Shigemitsu et al, 1999). Cadmium ions act independently of mTOR through elevation of cytoplasmic calcium stemming from the endoplasmic reticulum and subsequent ERK1/2 activation in mesangial cell lines (Wang et al, 2008). The mood-stabilizing and anticonvulsive drug VPA has lately been shown to stimulate ERK1/2 phosphorylation in concert with ROS, thereby promoting autophagy in human glioma cells (Fu et al, 2010). Lithium salts are also widely prescribed mood stabilizers, yet use another molecular mechanism, as they interfere with the cellular myo-inositol homeostasis by blocking inositol monophosphatases (Sarkar et al, 2005). Lately, maprotiline and fluoxetin were reported to increase LC3B-II levels in lymphoma-derived cell lines, although no evidence for an operative mode of autophagy was provided (Cloonan and Williams, 2010).
Cancer cells occasionally use autophagy to resist the cytotoxic impact of chemotherapeutics (Dalby et al, 2010). Thus, transformed cells are more susceptible to chemotherapeutics when autophagy is pharmacologically inhibited. For instance, co-treatment of HeLa cells with desmethyl-clomipramine, which blocks autophagy, and the DNA-damaging agent doxorubicin results in the potentiation of the cytotoxic effects of doxorubicin (Rossi et al, 2009).
In the CNS, both protective and detrimental functions have been ascribed to autophagy, and disentangling causative relations is still an unresolved issue. During early development, autophagic processes provide energy by means of ATP generated from recycled amino acids fed into the tricarboxylic cycle. ATP in turn delivers energy for the removal of apoptotic cells through engulfment and subsequent degradation. In the mature CNS, mechanical or biochemical insults of neurons are often accompanied by autophagy, which is thought to promote regenerative events or cell destruction, depending on the spatial-temporal context (Boya et al, 2008).
Here, we showed marked differences in the type of cell death between neurons and astrocytes after drug application. Apoptotic cell death was absent in astrocytes, which nevertheless showed signs of moderately diminished cell viability after exposure to 10 μM AMI or CIT. We speculate that enhanced autophagy including slightly increased beclin1 protein levels in astrocytes might confer some resistance against apoptotic signals. Still, autophagy does not accomplish cellular recovery from AMI- or CIT-mediated toxicity, and thus, the question remains whether autophagy accounts for or coincides with cell death, which simply may be a consequence of extensive vacuolization or aggregation of lipids/cholesterol. Therefore, we cannot exclude that autophagy may even implement a back-up system for removing irreversibly damaged astroglial cells, under conditions where apoptosis is not efficiently conducted.
Neurons underwent type-I caspase-dependent cell death in response to higher doses of AMI/CIT (10 μM). Interestingly, autophagy was initiated roughly 2 days before the onset of apoptosis and therefore is unlikely to account directly for activated caspase-3 and DNA fragmentation. Numerous studies describe apoptotic events arising from AD exposure, using either glioma cell lines, fibroblasts, or dorsal root ganglia neurons as cellular models (Levkovitz et al, 2005; Lirk et al, 2006; Moreno-Fernandez et al, 2008).
The use of autophagy modulators in CNS tissue may comprise neurodegenerative and psychiatric conditions. Many aggregate-prone proteins are substrates of autophagy and can be effectively cleared from the cytosol after autophagy induction. For instance, lithium salts were reported to mediate the reduction of mutant huntingtin and α-synucleins in neuronal precursor cell lines and COS-7 cells (Sarkar et al, 2005). As both AMI and CIT showed moderate increases in the expression of autophagic markers paralleled by enhanced protein turnover, we suggest that these compounds could represent potential candidates controlling the turnover of aggregate-prone proteins in neurodegenerative disorders. Of note, rapamycin exerts antidepressive-like effects in animal models, suggesting that autophagy might not solely be a promising target for the treatment of neurodegenerative, but also psychiatric, conditions (Cleary et al, 2008b; Cleary et al, 2008a). Apart from an imbalance of the neurotransmitter homeostasis, aberrant metabolic as well as immune-related functions are thought to contribute to the pathogenesis of affective disorders. A hypothetical deficit of energy as indicated by reduced levels of ATP and creatine phosphate in the brain of many patients (Moretti et al, 2003) as well as an over-reactive immune system as mirrored by increases in cytokine levels are features that occur during disease manifestation (Penninx et al, 2003; Thomas et al, 2005). Here, drug-induced autophagy might serve several functions: first, energy metabolism might be partly reconstituted by enhanced proteolysis and subsequent generation of ATP. Lending support to this hypothesis, AMI-treated astrocytes show increased levels of ATP (Trzeciak et al, 1995). Second, AD-induced autophagy might dampen the production and release of certain interleukins, interferons, and ROS, and thereby bring about anti-inflammatory actions (Rouschop et al, 2009; Saitoh et al, 2008).
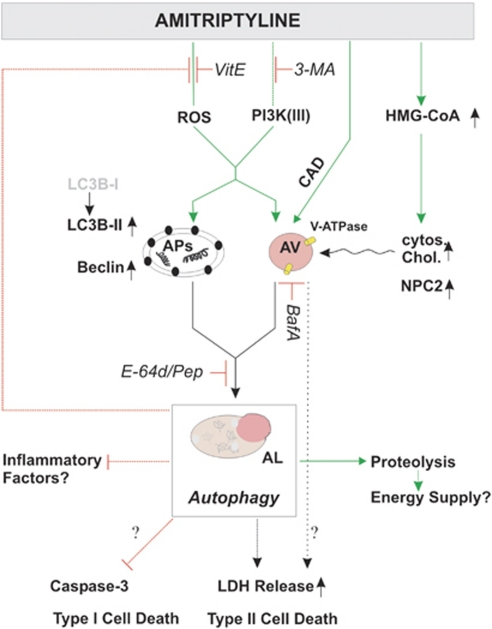
In conclusion, the diverse effects of three widely described ADs on autophagy support the view that these drugs can be differentiated according to their impact beyond monoaminergic neurotransmission. It is tempting to speculate that AD-mediated autophagy might help to restore certain metabolic and immunological pathways (Figure 11). Albeit autophagy has a variety of reported beneficial properties, further studies need to assess and carefully balance the risk of potential harmful side effects on the CNS.
Figure 11.
A model of the autophagy- and cholesterol-related effects of AMI on astrocytes. AMI triggers autophagic pathways partly through PI3 kinase-III- and ROS-dependent signaling that results in enhanced proteolysis. This process comes along with increased levels of beclin1, LC3B-II, and lysosomal vesicles. Alterations of HMG-CoA reductase mRNA and cytoplasmic cholesterol levels seem not to be linked directly to autophagy induction but rather to represent accompanying factors. Autophagy can serve several functions: it delivers energy and under certain conditions negatively influences the generation of factors promoting inflammation such as ROS. Thereby, it might support the beneficial effects of AMI's action apart from monoaminergic neurotransmission. On the other hand, it might contribute to compromised cell integrity as measured by LDH release. AP, autophagosome; AV, acidic vacuoles; AL, autophagolysosome.
Acknowledgments
We appreciate the technical assistance of K Hafner, and are grateful to T Yoshimori for providing the rat pEGFP-LC3 expression vector, K Winkelhofer for luciferase reporter vectors, and N Mizushima for providing the Atg5-depleted MEF cells. This study was supported in part by the Max Planck Society and NARSAD Young Investigator Award (to JZ).
The authors declare no conflict of interest.
Footnotes
Supplementary Information accompanies the paper on the Neuropsychopharmacology website (http://www.nature.com/npp)
Supplementary Material
References
- Alakoskela JM, Vitovic P, Kinnunen PKJ. Screening for the drug–phospholipid interaction: correlation to phospholipidosis. ChemMedChem. 2009;4:1224–1251. doi: 10.1002/cmdc.200900052. [DOI] [PubMed] [Google Scholar]
- Anderson N, Borlak J. Drug-induced phospholipidosis. FEBS Lett. 2006;580:5533–5540. doi: 10.1016/j.febslet.2006.08.061. [DOI] [PubMed] [Google Scholar]
- Bayatti N, Zschocke J, Behl C. Brain region-specific neuroprotective action and signaling of corticotropin-releasing hormone in primary neurons. Endocrinology. 2003;144:4051–4060. doi: 10.1210/en.2003-0168. [DOI] [PubMed] [Google Scholar]
- Berridge MV, Tan AS. Characterization of the cellular reduction of 3-(4,5-dimethylthiazol-2-yl)-2,5-diphenyltetrazolium bromide (MTT)—subcellular-localization, substrate dependence, and involvement of mitochondrial electron-transport in MTT reduction. Arch Biochem Biophys. 1993;303:474–482. doi: 10.1006/abbi.1993.1311. [DOI] [PubMed] [Google Scholar]
- Bouman L, Schlierf A, Lutz AK, Deinlein A, Shan J, Kast J, et al. 2010Parkin is transcriptionally regulated by ATF4: evidence for an interconnection between mitochondrial stress and ER stress Cell Death Differe-pub ahead of print 24 November 2010. [DOI] [PMC free article] [PubMed]
- Boya P, Mellen MA, de la Rosa EJ. How autophagy is related to programmed cell death during the development of the nervous system. Biochem Soc Transact. 2008;36:813–817. doi: 10.1042/BST0360813. [DOI] [PubMed] [Google Scholar]
- Carvalho LA, Garner BA, Dew T, Fazakerley H, Pariante CM. Antidepressants, but not antipsychotics, modulate GR function in human whole blood: an insight into molecular mechanisms. Eur Neuropsychopharmacol. 2010;20:379–387. doi: 10.1016/j.euroneuro.2010.02.006. [DOI] [PMC free article] [PubMed] [Google Scholar]
- Chang TY, Reid PC, Sugii S, Ohgami N, Cruz JC, Chang CCY. Niemann–Pick type C disease and intracellular cholesterol trafficking. J Biol Chem. 2005;280:20917–20920. doi: 10.1074/jbc.R400040200. [DOI] [PubMed] [Google Scholar]
- Cieehomska IA, Tolkovsky AM. Non-autophagic GFP-LC3 puncta induced by saponin and other detergents. Autophagy. 2007;3:586–590. doi: 10.4161/auto.4843. [DOI] [PubMed] [Google Scholar]
- Cleary C, Hadas I, Belmaker HR, Agam G, Flaisher-Grinberg S, Einat H. Antidepressant-like effects of the mTOR inhibitor rapamycin: further behavioral and biochemical evidence. Biol Psychiatry. 2008a;63:101S–102S. [Google Scholar]
- Cleary C, Linde JAS, Hiscock KM, Hadas I, Belmaker RH, Agam G, et al. Antidepressive-like effects of rapamycin in animal models: Implications for mTOR inhibition as a new target for treatment of affective disorders. Brain Res Bull. 2008b;76:469–473. doi: 10.1016/j.brainresbull.2008.03.005. [DOI] [PubMed] [Google Scholar]
- Cloonan SM, Williams DC. The antidepressants maprotiline and fluoxetine induce Type II autophagic cell death in drug-resistant Burkitt's lymphoma. Int J Cancer. 2010;128:1712–1723. doi: 10.1002/ijc.25477. [DOI] [PubMed] [Google Scholar]
- Corcelle EA, Puustinen P, Jaattela M. Apoptosis and autophagy: targeting autophagy signalling in cancer cells—‘trick or treats'. FEBS J. 2009;276:6084–6096. doi: 10.1111/j.1742-4658.2009.07332.x. [DOI] [PubMed] [Google Scholar]
- Cordero MD, Moreno-Fernandez AM, Gomez-Skarmeta JL, de Miguel M, Garrido-Maraver J, Oropesa-Avila M, et al. Coenzyme Q(10) and alpha-tocopherol protect against amitriptyline toxicity. Toxicol Appl Pharmacol. 2009;235:329–337. doi: 10.1016/j.taap.2008.12.026. [DOI] [PubMed] [Google Scholar]
- Czeh B, Simon M, Schmelting B, Hiemke C, Fuchs E. Astroglial plasticity in the hippocampus is affected by chronic psychosocial stress and concomitant fluoxetine treatment. Neuropsychopharmacology. 2006;31:1616–1626. doi: 10.1038/sj.npp.1300982. [DOI] [PubMed] [Google Scholar]
- Dalby KN, Tekedereli I, Lopez-Berestein G, Ozpolat B. Targeting the prodeath and prosurvival functions of autophagy as novel therapeutic strategies in cancer. Autophagy. 2010;6:322–329. doi: 10.4161/auto.6.3.11625. [DOI] [PMC free article] [PubMed] [Google Scholar]
- Donati RJ, Rasenick MM. Chronic antidepressant treatment prevents accumulation of Gs alpha in cholesterol-rich, cytoskeletal-associated, plasma membrane domains (lipid rafts) Neuropsychopharmacology. 2005;30:1238–1245. doi: 10.1038/sj.npp.1300697. [DOI] [PubMed] [Google Scholar]
- Donati RJ, Thukral C, Rasenick MM. Chronic treatment of C6 glioma cells with antidepressant drugs results in a redistribution of Gs alpha. Mol Pharmacol. 2001;59:1426–1432. doi: 10.1124/mol.59.6.1426. [DOI] [PubMed] [Google Scholar]
- Franke B, Figiel M, Engele J. CNS glia are targets for GDNF and neurturin. Histochem Cell Biol. 1998;110:595–601. doi: 10.1007/s004180050322. [DOI] [PubMed] [Google Scholar]
- Fu J, Shao CJ, Chen FR, Ng HK, Chen ZP. Autophagy induced by valproic acid is associated with oxidative stress in glioma cell lines. Neuro-Oncology. 2010;12:328–340. doi: 10.1093/neuonc/nop005. [DOI] [PMC free article] [PubMed] [Google Scholar]
- Glick D, Barth S, Macleod KF. Autophagy: cellular and molecular mechanisms. J Pathol. 2010;221:3–12. doi: 10.1002/path.2697. [DOI] [PMC free article] [PubMed] [Google Scholar]
- Glotzbach RK, Preskorn SH. Brain concentrations of tricyclic antidepressants—single-dose kinetics and relationship to plasma-concentrations in chronically dosed rats. Psychopharmacology. 1982;78:25–27. doi: 10.1007/BF00470582. [DOI] [PubMed] [Google Scholar]
- Gozuacik D, Kimchi A. Autophagy as a cell death and tumor suppressor mechanism. Oncogene. 2004;23:2891–2906. doi: 10.1038/sj.onc.1207521. [DOI] [PubMed] [Google Scholar]
- Harding HP, Zhang YH, Zeng HQ, Novoa I, Lu PD, Calfon M, et al. An integrated stress response regulates amino acid metabolism and resistance to oxidative stress. Mol Cell. 2003;11:619–633. doi: 10.1016/s1097-2765(03)00105-9. [DOI] [PubMed] [Google Scholar]
- Herr AS, Tsolakidou AF, Yassouridis A, Holsboer F, Rein T. Antidepressants differentially influence the transcriptional activity of the glucocorticoid receptor in vitro. Neuroendocrinology. 2003;78:12–22. doi: 10.1159/000071701. [DOI] [PubMed] [Google Scholar]
- Hisaoka K, Takebayashi M, Tsuchioka M, Maeda N, Nakata Y, Yamawaki S. Antidepressants increase glial cell line-derived neurotrophic factor production through monoamine-independent activation of protein tyrosine kinase and extracellular signal-regulated kinase in glial cells. J Pharmacol Exp Ther. 2007;321:148–157. doi: 10.1124/jpet.106.116558. [DOI] [PubMed] [Google Scholar]
- Holladay JW, Dewey MJ, Yoo SD. Pharmacokinetics and antidepressant activity of fluoxetine in transgenic mice with elevated serum alpha-1-acid glycoprotein levels. Drug Metab Dispos. 1998;26:20–24. [PubMed] [Google Scholar]
- Hoyer-Hansen M, Jaattela M. Connecting endoplasmic reticulum stress to autophagy by unfolded protein response and calcium. Cell Death Differ. 2007;14:1576–1582. doi: 10.1038/sj.cdd.4402200. [DOI] [PubMed] [Google Scholar]
- Huang WP, Klionsky DJ. Autophagy in yeast: a review of the molecular machinery. Cell Struct Funct. 2002;27:409–420. doi: 10.1247/csf.27.409. [DOI] [PubMed] [Google Scholar]
- Kuma A, Hatano M, Matsui M, Yamamoto A, Nakaya H, Yoshimori T, et al. The role of autophagy during the early neonatal starvation period. Nature. 2004;432:1032–1036. doi: 10.1038/nature03029. [DOI] [PubMed] [Google Scholar]
- Lange Y, Ye J, Rigney R, Steck T. Cholesterol movement in Niemann–Pick type C cells and in cells treated with amphiphiles. J Biol Chem. 2000;275:17468–17475. doi: 10.1074/jbc.M000875200. [DOI] [PubMed] [Google Scholar]
- Levkovitz Y, Gil-Ad I, Zeldich E, Dayag M, Weizman A. Differential induction of apoptosis by antidepressants in glioma and neuroblastoma cell lines—evidence for p-c-Jun, cytochrome c, and caspase-3 involvement. J Mol Neurosci. 2005;27:29–42. doi: 10.1385/JMN:27:1:029. [DOI] [PubMed] [Google Scholar]
- Liao G, Yao Y, Liu J, Cheung S, Xie A. Autophagic-lysosomal dysfunction is associated with cholesterol accumulation and neurodegeneration in NPC1−/− mice. J Neurochem. 2007;102:36. doi: 10.2353/ajpath.2007.070052. [DOI] [PMC free article] [PubMed] [Google Scholar]
- Lirk P, Haller I, Hausott B, Ingorokva S, Deibl M, Gerner P, et al. The neurotoxic effects of amitriptyline are mediated by apoptosis and are effectively blocked by inhibition of caspase activity. Anesth Analg. 2006;102:1728–1733. doi: 10.1213/01.ane.0000216018.62549.bb. [DOI] [PubMed] [Google Scholar]
- Liu YB, Peterson DA, Kimura H, Schubert D. Mechanism of cellular 3-(4,5-dimethylthiazol-2-yl)-2,5-diphenyltetrazolium bromide (MTT) reduction. J Neurochem. 1997;69:581–593. doi: 10.1046/j.1471-4159.1997.69020581.x. [DOI] [PubMed] [Google Scholar]
- Livak KJ, Schmittgen TD. Analysis of relative gene expression data using real-time quantitative PCR and the 2(T)(−Delta Delta C) method. Methods. 2001;25:402–408. doi: 10.1006/meth.2001.1262. [DOI] [PubMed] [Google Scholar]
- Mehrpour M, Esclatine A, Beau I, Codogno P. Autophagy in health and disease. 1. Regulation and significance of autophagy: an overview. Am J Physiol Cell Physiol. 2010;298:C776–C785. doi: 10.1152/ajpcell.00507.2009. [DOI] [PubMed] [Google Scholar]
- Moosmann B, Skutella T, Beyer K, Behl C. Protective activity of aromatic amines and imines against oxidative nerve cell death. Biol Chem. 2001;382:1601–1612. doi: 10.1515/BC.2001.195. [DOI] [PubMed] [Google Scholar]
- Moreno-Fernandez AM, Cordero MD, de Miguel M, gado-Rufino MD, Sanchez-Alcazar JA, Navas P. Cytotoxic effects of amitriptyline in human fibroblasts. Toxicology. 2008;243:51–58. doi: 10.1016/j.tox.2007.09.021. [DOI] [PubMed] [Google Scholar]
- Moretti A, Gorini A, Villa RF. Affective disorders, antidepressant drugs and brain metabolism. Mol Psychiatry. 2003;8:773–785. doi: 10.1038/sj.mp.4001353. [DOI] [PubMed] [Google Scholar]
- Nothdurfter C, Tanasic S, Di Benedetto B, Rammes G, Wagner EM, Kirmeier T, et al. Impact of lipid raft integrity on 5-HT3 receptor function and its modulation by antidepressants. Neuropsychopharmacology. 2010;35:1510–1519. doi: 10.1038/npp.2010.20. [DOI] [PMC free article] [PubMed] [Google Scholar]
- Owens MJ, Morgan WN, Plott SJ, Nemeroff CB. Neurotransmitter receptor and transporter binding profile of antidepressants and their metabolites. J Pharmacol Exp Ther. 1997;283:1305–1322. [PubMed] [Google Scholar]
- Pacheco CD, Kunkel R, Lieberman AP. Autophagy in Niemann–Pick C disease is dependent upon beclin-1 and responsive to lipid trafficking defects. Hum Mol Genet. 2007;16:1495–1503. doi: 10.1093/hmg/ddm100. [DOI] [PubMed] [Google Scholar]
- Paez-Pereda M. New drug targets in the signaling pathways activated by antidepressants. Prog Neuropsychopharmacol Biol Psychiatry. 2005;29:1010–1016. doi: 10.1016/j.pnpbp.2005.03.017. [DOI] [PubMed] [Google Scholar]
- Penninx BWJH, Kritchevsky SB, Yaffe K, Newman AB, Simonsick EM, Rubin S, et al. Inflammatory markers and depressed mood in older persons: results from the Health, Aging and Body Composition study. Biol Psychiatry. 2003;54:566–572. doi: 10.1016/s0006-3223(02)01811-5. [DOI] [PubMed] [Google Scholar]
- Perisic T, Zimmermann N, Kirmeier T, Asmus M, Tuorto F, Uhr M, et al. Valproate and amitriptyline exert common and divergent influences on global and gene promoter-specific chromatin modifications in rat primary astrocytes. Neuropsychopharmacology. 2010;35:792–805. doi: 10.1038/npp.2009.188. [DOI] [PMC free article] [PubMed] [Google Scholar]
- Raeder MB, Bjelland I, Ferno J, Vollset SE, Steen VM. Lipogenic effects of antidepressant drugs: transcriptional stimulation of cellular lipid biosynthesis is a potential marker of drug-induced metabolic side-effects. Nord J Psychiatry. 2006a;60:336. [Google Scholar]
- Raeder MB, Ferno J, Glambek M, Stansberg C, Steen VM. Antidepressant drugs activate SREBP and upregulate cholesterol and fatty acid biosynthesis in human glial cells. Neurosci Lett. 2006b;395:185–190. doi: 10.1016/j.neulet.2005.10.096. [DOI] [PubMed] [Google Scholar]
- Rodriguez-Lafrasse C, Rousson R, Bonnet J, Pentchev PG, Louisot P, Vanier MT. Abnormal cholesterol-metabolism in imipramine-treated fibroblast-cultures—similarities with Niemann–Pick type-C disease. Biochim Biophys Acta. 1990;1043:123–128. doi: 10.1016/0005-2760(90)90284-5. [DOI] [PubMed] [Google Scholar]
- Rossi M, Munarriz ER, Bartesaghi S, Milanese M, Dinsdale D, Guerra-Martin MA, et al. Desmethylclomipramine induces the accumulation of autophagy markers by blocking autophagic flux. J Cell Sci. 2009;122:3330–3339. doi: 10.1242/jcs.048181. [DOI] [PMC free article] [PubMed] [Google Scholar]
- Rouschop KM, Ramaekers CH, Schaaf MB, Keulers TG, Savelkouls KG, Lambin P, et al. Autophagy is required during cycling hypoxia to lower production of reactive oxygen species. Radiother Oncol. 2009;92:411–416. doi: 10.1016/j.radonc.2009.06.029. [DOI] [PubMed] [Google Scholar]
- Saitoh T, Fujita N, Jang MH, Uematsu S, Yang BG, Satoh T, et al. Loss of the autophagy protein Atg16L1 enhances endotoxin-induced IL-1 beta production. Nature. 2008;456:264–268. doi: 10.1038/nature07383. [DOI] [PubMed] [Google Scholar]
- Sarkar S, Floto RA, Berger Z, Imarisio S, Cordenier A, Pasco M, et al. Lithium induces autophagy by inhibiting inositol monophosphatase. J Cell Biol. 2005;170:1101–1111. doi: 10.1083/jcb.200504035. [DOI] [PMC free article] [PubMed] [Google Scholar]
- Scherz-Shouval R, Elazar Z. ROS, mitochondria and the regulation of autophagy. Trends Cell Biol. 2007;17:422–427. doi: 10.1016/j.tcb.2007.07.009. [DOI] [PubMed] [Google Scholar]
- Schűlke JP, Wochnik GM, Lang-Rollin I, Gassen NC, Knapp RT, Berning B, et al. Differential impact of tetratricopeptide repeat proteins on the steroid hormone receptors. PLoS One. 2010;5:e11717. doi: 10.1371/journal.pone.0011717. [DOI] [PMC free article] [PubMed] [Google Scholar]
- Shigemitsu K, Tsujishita Y, Hara K, Nanahoshi M, Avruch J, Yonezawa K. Regulation of translational effectors by amino acid and mammalian target of rapamycin signaling pathways—possible involvement of autophagy in cultured hepatoma cells. J Biol Chem. 1999;274:1058–1065. doi: 10.1074/jbc.274.2.1058. [DOI] [PubMed] [Google Scholar]
- Shimizu S, Kanaseki T, Mizushima N, Mizuta T, Arakawa-Kobayashi S, Thompson CB, et al. Role of Bcl-2 family proteins in a non-apoptotic programmed cell death dependent on autophagy genes. Nat Cell Biol. 2004;6:1221–1228. doi: 10.1038/ncb1192. [DOI] [PubMed] [Google Scholar]
- Szeto J, Kaniuk NA, Canadien V, Nisman R, Mizushima N, Yoshimori T, et al. ALIS are stress-induced protein storage compartments for substrates of the proteasome and autophagy. Autophagy. 2006;2:189–199. doi: 10.4161/auto.2731. [DOI] [PubMed] [Google Scholar]
- Thomas AJ, Davis S, Morris C, Jackson E, Harrison R, O'Brien JT. Increase in interleukin-1 beta in late-life depression. Am J Psychiatry. 2005;162:175–177. doi: 10.1176/appi.ajp.162.1.175. [DOI] [PubMed] [Google Scholar]
- Trzeciak HI, Kalacinski W, Malecki A, Kokot D. Effect of neuroleptics on phospholipase A(2) activity in the brain of rats. Eur Arch Psychiatry Clin Neurosci. 1995;245:179–182. doi: 10.1007/BF02193092. [DOI] [PubMed] [Google Scholar]
- Vik-Mo AO, Fernø J., Skrede S, Steen VM. Psychotropic drugs up-regulate the expression of cholesterol transport proteins including ApoE in cultured human CNS and liver cells. BMC Pharmacol. 2009;9:10. doi: 10.1186/1471-2210-9-10. [DOI] [PMC free article] [PubMed] [Google Scholar]
- Wang SH, Shih YL, Ko WC, Wei YH, Shih CM. Cadmium-induced autophagy and apoptosis are mediated by a calcium signaling pathway. Cell Mol Life Sci. 2008;65:3640–3652. doi: 10.1007/s00018-008-8383-9. [DOI] [PMC free article] [PubMed] [Google Scholar]
- Xia ZL, Ying G, Hansson AL, Karlsson H, Xie Y, Bergstrand A, et al. Antidepressant-induced lipidosis with special reference to tricyclic compounds. Prog Neurobiol. 2000;60:501–512. doi: 10.1016/s0301-0082(99)00036-2. [DOI] [PubMed] [Google Scholar]
- Xu Z, Farver W, Kodukula S, Storch J. Regulation of sterol transport between membranes and NPC2. Biochemistry. 2008;47:11134–11143. doi: 10.1021/bi801328u. [DOI] [PMC free article] [PubMed] [Google Scholar]
- Zhong Y, Wang QJ, Li XT, Yan Y, Backer JM, Chait BT, et al. Distinct regulation of autophagic activity by Atg14L and Rubicon associated with Beclin 1-phosphatidylinositol-3-kinase complex. Nat Cell Biol. 2009;11:468–476. doi: 10.1038/ncb1854. [DOI] [PMC free article] [PubMed] [Google Scholar]
Associated Data
This section collects any data citations, data availability statements, or supplementary materials included in this article.


