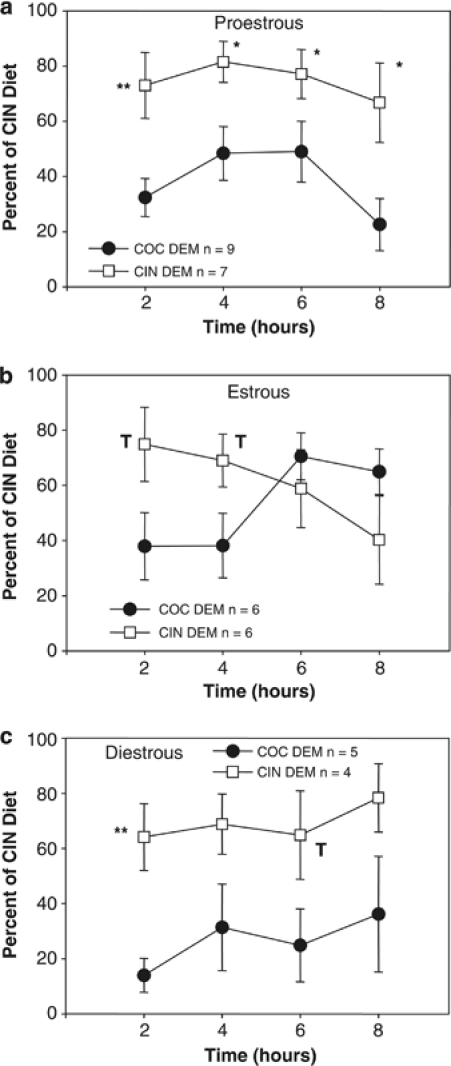
Figure 3.
Percent of cinnamon (CIN) diet consumed over the total food intake by the observer female mice that had received no treatment, combined from the two pharmacological studies, and were in proestrus (a), estrus (b), or diestrus (c) on the day they had a 30-min social interaction with a demonstrator (DEM) female mouse that had just consumed either a 2% cocoa (COC, black circle) or a 1% CIN (white square) flavored diet. CIN preferences are shown at 2, 4, 6, and 8 h from the beginning of testing. **p<0.001; *p<0.01; p<0.05; T=0.05 < p<0.1 in the comparison between the COC DEM and CIN DEM observers.

