

Abstract
Purpose
To develop a social health measurement framework, to test items in diverse populations and to develop item response theory (IRT) item banks.
Methods
A literature review guided framework development of Social Function and Social Relationships sub-domains. Items were revised based on patient feedback, and Social Function items were field-tested. Analyses included exploratory factor analysis (EFA), confirmatory factor analysis (CFA), two-parameter IRT modeling and evaluation of differential item functioning (DIF).
Results
The analytic sample included 956 general population respondents who answered 56 Ability to Participate and 56 Satisfaction with Participation items. EFA and CFA identified three Ability to Participate sub-domains. However, because of positive and negative wording, and content redundancy, many items did not fit the IRT model, so item banks do not yet exist. EFA, CFA and IRT identified two preliminary Satisfaction item banks. One item exhibited trivial age DIF.
Conclusion
After extensive item preparation and review, EFA-, CFA- and IRT-guided item banks help provide increased measurement precision and flexibility. Two Satisfaction short forms are available for use in research and clinical practice. This initial validation study resulted in revised item pools that are currently undergoing testing in new clinical samples and populations.
Keywords: Patient-reported outcomes, Social health, Social function, Social relationships, Item banks
Introduction
Patient-reported outcomes (PRO) are increasingly incorporated into clinical trials and clinical practice. A new approach to PRO measurement is the development of item banks that contain numerous questions representative of a common trait. Items in a well-constructed bank cover the entire continuum and are calibrated on the same measurement scale, thus simplifying scoring and interpretation. With a calibrated bank, the questions can be used to create fixed-length test instruments and computerized adaptive tests (CATs) that minimize respondent burden [1-4]. The primary objective of the Patient-Reported Outcomes Measurement Information System (PROMIS; http://www.nihpromis.org) is to develop and validate numerous item banks.
PROMIS began in 2004 as an NIH roadmap initiative that includes research scientists, clinicians and psychometric measurement experts at the NIH, at 6 primary research sites and at a statistical coordinating center [5]. PROMIS item banks measure key symptoms and health concepts applicable to a range of chronic health conditions. Calibrated item banks will enable measures of PRO that are efficiently administered, reliable, valid and easily interpretable. The purpose of this paper is to describe the development and initial validation of the Social Health item banks.
Social health domain definitions
PROMIS developed a domain map (framework) to portray the item bank structure. Starting with three overall domains of physical, mental and social health [6], PROMIS workgroups were formed to define, develop and test multiple sub-domains.
Past work has recognized the importance of social determinants of health such as social status, social networks and social support [7-9]. The study of social health as an outcome, that is, a factor that would reflect measurable change in response to interventions or changes in health status, has received limited attention. With increasing focus on understanding the entire picture of health and the full impact of disease on people’s lives, there is a need to measure social health as an outcome, distinct from physical and mental health.
Theories of social health have used different conceptual models, based in different disciplines, posing a special challenge in defining sub-domains. Primary components include social role participation, social network quality, social integration and interpersonal communication [10-16]. Other conceptualizations are based on interpersonal attributes independent of particular roles [17]. Researchers have also studied social support and social ties, for example, marital status, frequency of contacts with friends and relatives, and religious organization membership [7, 18].
In general, the division of social health into sub-domains appears to depend on the purpose of a given clinical or research program. Available measures reflect these varying conceptual divisions. The goals of the PROMIS Social Health Workgroup were to develop a unified framework for conceptualizing social health and to create item banks that would reflect the experience of healthy people, as well as those with a range of medical and mental health conditions. This paper describes the processes of framework development, item development and testing, and psychometric analysis for the Social Health item banks.
Methods
Framework development
Based on PROMIS goals and an extensive literature review, the Social Health Workgroup recognized that extant frameworks included two primary sub-domains: Social Function and Social Relationships (Fig. 1). Social Function often included some distinction between capability and satisfaction, and social relationships included concepts of social support and isolation. The workgroup focused first on Social Function and agreed to address Social Relationships (including possible expansion of its sub-domains) in a future initiative. We developed items covering four contexts: family, friends, work and leisure. In previous cancer research, we developed and tested social health items [19]. Those results provided preliminary support for two Social Function sub-domains: Ability to Participate and Satisfaction with Participation [19], including an empirical construct hierarchy that was generally consistent with clinical expectations. For example, limitations in leisure activities were more common than limitations related to family/friends. The Social Health Workgroup adopted this structure for PROMIS.
Fig. 1.
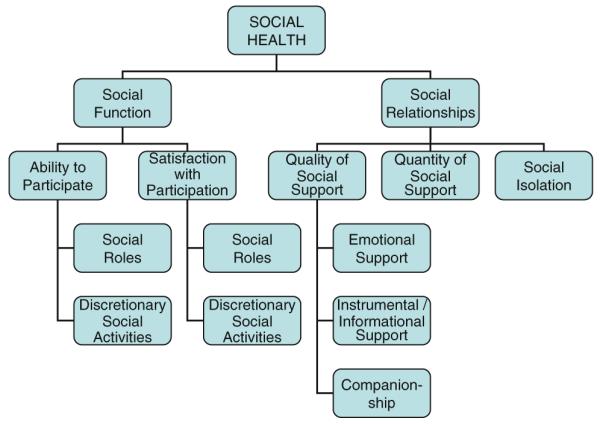
Social health framework. © Copyright 2008 by the PROMIS Cooperative Group and the PROMIS Health Organization
Item development
Each PROMIS workgroup performed a qualitative item review process that included identification of existing items, development of new items, item revision, readability levels, focus group exploration of domain coverage, cognitive interviews on individual items and final revision before field-testing [20]. Multilingual translation experts reviewed items to facilitate future translations. Additional details about qualitative item review are reported elsewhere [21]. This process produced 56 Ability and 56 Satisfaction items. The Social Health Workgroup wished to evaluate whether positive endorsement of capability could be scaled alongside negative endorsement of limitation and to evaluate the value of asking about (positive) satisfaction as well as (negative) disappointment or bother. As a result, the item pools included multiple examples of minor variations on similar themes.
Sampling and computer-based testing
Items were administered to general population and clinical samples. The general population sample was comprised of panel members of YouGovPolimetrix (www.polimetrix.com), an Internet polling organization with a registry of more than one million respondents. Target accrual percentages were established for the general population sample by gender (50% women), age (20% in each of six age groups), race (10–15% African-American), ethnicity (10–15% Hispanic) and education (25% high school or less). All participants received a small incentive ranging from $10 to $50; one site provided a token incentive less than $10 in value.
Panel respondents were assigned to complete items in either a block testing or full-bank format. For block testing, overlapping blocks of seven items were formed within each of 14 PROMIS item pools. For the full-bank format, respondents completed all items from two PROMIS item pools. All clinical samples were assigned to block testing. Each item was administered to at least 900 general population participants and 500 clinical sample participants (arthritis, cancer, chronic obstructive pulmonary disease, heart disease, psychiatric conditions and spinal cord injury). Respondents also answered sociodemographic and clinical questions [22].
Respondents in full-bank testing completed 56 Ability and 56 Satisfaction items. They also completed 10 PROMIS global health items [23] and 15 items from “legacy” (i.e., widely used and accepted) instruments to evaluate criterion validity and provide a link to prior work. Nine items were used from the SF-36 [24] (version 2, acute timeframe) and six from the Functional Assessment of Cancer Therapy-General Population (FACT-GP, version 4 [25]). The Ability and Satisfaction item subsets were counterbalanced, positively and negatively worded item sets were grouped together, and items were administered in random order. In block testing, the 7-item blocks were randomly ordered. These respondents also completed the global health, sociodemographic and clinical questions, but not the legacy instruments. All data were collected by computer with secure servers, and only one item at a time was displayed on the screen. Respondents could skip items and go back to change a response.
Psychometric analyses
Analyses followed the PROMIS guidelines [26]. The goals were to develop unidimensional item sets that fit a two-parameter item response theory (IRT) model and did not exhibit differential item functioning (measurement bias) across gender, age and education. Analyses were conducted separately for the Social Function sub-domains (Ability and Satisfaction).
Preliminary analyses
Only data from the full-bank (general population) testing were used in the analyses reported here. Our goal was to evaluate dimensionality and create item banks; tasks most effectively done when all items are administered to all people, which was not the case for the clinical samples. Of the 956 respondents taking the full-bank format, we excluded respondents who answered fewer than half of the items (n = 94 for Ability; n = 104 for Satisfaction). We also excluded respondents who had an average response time of less than one second per item or had a response time of less than a half second for each of 10 consecutive items (n = 84 for Ability; n = 84 for Satisfaction). This left 778 respondents (81%) available for the Ability analyses and 768 (80%) for Satisfaction. Data quality was assessed to identify out-of-range and missing values and to assure that negative items were reversed for scoring. Preliminary analyses were conducted to identify unused or sparsely used categories, to examine whether the average measures in response categories increased monotonically and to evaluate internal consistency reliability. A corrected item-total score correlation above 0.30 was required in order to retain that item for further analysis.
Assessment of dimensionality
The analytic sample was randomly split into half for use in either exploratory factor analysis (EFA) or a subsequent confirmatory factor analysis (CFA). For EFA, polychoric correlations were entered into Mplus and analyzed using an unweighted least squares estimation procedure [26-28]. Factors were identified by eigenvalues greater than 1.0 and examination of scree plots. Items loading 0.40 or above on a factor were examined to describe the factor. For the subsequent CFA, polychoric correlations were entered into Mplus and analyzed using a weighted least squares estimation procedure. A value greater than 0.95 on the comparative-fit index (CFI) was considered evidence of good model fit; a value greater than 0.90 was considered acceptable [29]. The results of one-factor models were examined; acceptable model fit provided some support for unidimensionality (local dependence was also examined; see below). A bifactor model was also used to confirm unidimensionality [30]. We considered the data to be “essentially unidimensional” if fit was acceptable for a model with one general and several specific orthogonal factors [31]. Finally, local dependence between item pairs was defined as a residual correlation greater than 0.20.
Estimation of IRT parameters
We used the MULTILOG graded response model to estimate item parameters and evaluate model fit [32, 33]. In this two-parameter logistic IRT model, item responses are used to estimate the “measure” (theta, i.e., the person’s transformed level on the latent trait). The two parameters are item difficulty, which represents the item’s location on the latent trait, and item slope, which indicates how well the item discriminates (distinguishes) between person differences across the latent trait [34]. We used item characteristic curves to examine the distribution of responses across categories, item thresholds to examine the range of Ability (or Satisfaction) being measured by these items, slopes to identify items with poor discrimination and the test information function to estimate where theta estimates had the most precision. Model fit was assessed with likelihood-based chi-squared statistics (S − X2) [35, 36].
Differential item functioning (DIF)
For all unidimensional item sets, we examined uniform and non-uniform DIF using IRTLRDIF [37]. Uniform DIF detects differences across the entire theta range, whereas non-uniform DIF detects differences in only a segment of the theta range. We compared hierarchically nested IRT models; specifically, one model that fully constrained parameters to be equal between two groups was compared to other models that allowed parameters to be freely estimated. Three group comparisons were evaluated: by gender, by age (<65 vs. ≥65) and by education (high school/GED or less vs. higher education).
Development of short forms
Fixed-item short forms were created to provide an alternative where computers may not be available. The criteria for item inclusion were content representativeness (inclusion of items from each context), maximized range of difficulty (inclusion of items across the calibration range) and acceptable discrimination levels (inclusion of items that distinguish between people across the latent trait). Raw scores were calculated and transformed to T-scores (mean = 50; standard deviation = 10). Descriptive statistics were calculated for the sample as a whole and for gender, age and education subgroups. Spearman correlation coefficients were calculated to evaluate the association between short form scores and legacy measures (SF-36 role physical, role emotional and social functioning subscales, and FACT-G functional well-being subscale).
Results
Item development
We identified and reviewed 1,781 Social Function items; 112 items were retained and edited. New items were written to fill content gaps. This process produced 56 items for Ability to Participate and 56 for Satisfaction with Participation within four contexts (family, friends, work and leisure). All items were written as statements, using a 7-day reporting period. The Ability items used a 5-point frequency rating scale (Never, Rarely, Sometimes, Often and Always) and the Satisfaction items used a 5-point intensity rating scale (Not at all, A little bit, Somewhat, Quite a bit and Very much). These scales were chosen to best measure the defined latent traits.
Respondent characteristics
Table 1 summarizes characteristics of the general population participants in the analytic datasets. The proportions of Hispanic and African-American respondents, and those with lower education, were slightly lower than the target proportions.
Table 1.
Sociodemographic characteristics and health status of general population panel participants included in the Social Function analytic datasets
| Ability (n = 778) |
Satisfaction (n = 768) |
|
|---|---|---|
| Mean age in years (SD) | 51.9 (17.5) | 51.7 (17.6) |
| Female gender | 49.7 | 49.0 |
| Hispanic ethnicity | 9.8 | 9.6 |
| Race | ||
| White | 82.2 | 82.5 |
| African-American | 7.6 | 7.6 |
| Asian | 0.4 | 0.3 |
| American Indian/Alaska Native | 0.9 | 0.8 |
| Multiracial/other | 8.9 | 8.8 |
| Education (high school/GED or less) | 16.6 | 17.2 |
| Married/partner | 65.6 | 65.7 |
| Full-time or part-time employment | 52.2 | 52.2 |
| Family household income | ||
| Less than $20,000 | 9.0 | 9.5 |
| Between $20,000 and $49,999 | 32.8 | 32.6 |
| Between $50,000 and $99,999 | 38.6 | 37.9 |
| $100,000 or more | 19.5 | 20.0 |
| Self-rated health status | ||
| Poor | 1.5 | 1.6 |
| Fair | 10.3 | 10.2 |
| Good | 38.0 | 38.0 |
| Very good | 36.9 | 37.2 |
| Excellent | 13.2 | 13.0 |
Percentages are shown in the table, unless otherwise specified
SD standard deviation, GED general educational development credential
Psychometric analyses
Preliminary analyses
Response distributions were somewhat negatively skewed, that is, relatively fewer respondents reported poor social function. Few category inversions (disordered measures across response categories) were found and, where they occurred, they were at the bottom of the scale where frequencies were small. The relatively sparse categories and inversions did not suggest a problem with respondent use of the rating scale. Reliability coefficients were high (>0.98), and item-total correlations were acceptable (0.65–0.85 for Ability; 0.47–0.82 for Satisfaction).
Dimensionality analyses
The EFA for Ability to Participate began with 56 items. Seven items loaded weakly across factors, and the remaining items loaded on three factors: 21 social activity items (family, friends, leisure and community activities); 16 social roles and responsibilities items (work and family responsibilities); and 12 social activity limitations items (limitations in family, friends and leisure activities; Table 2). Good or acceptable CFA model fit was found for each subset; specifically, the CFI for both social activities and social roles was 0.951, and the CFI for social activity limitations was 0.908. After deleting two “visiting relatives” items because of local dependence and poor discrimination, model fit improved for social activity limitations (CFI = 0.952). A bifactor model (one general and three specific factors) demonstrated acceptable fit (CFI = 0.912), suggesting that it might be possible to model the 49 Ability to Participate items as an “essentially unidimensional” construct [26].
Table 2.
Summary of analysis results for social function items
| Ability to participate (56 items) |
Satisfaction with participation (56 items) |
|||
|---|---|---|---|---|
| Analysis stage | Name of factor/sub- domain |
Sample item | Name of factor/sub-domain | Sample item |
| Exploratory factor analysis (EFA) |
Social activities (21 items) |
I am able to do all of my regular activities with friends |
Satisfaction with participation in social roles (14 items) |
I am satisfied with my ability to work (include work at home) |
| Social roles and responsibilities (16 items) |
I am able to do all of my usual work (include work at home) |
Satisfaction with participation in discretionary activities (12 items) |
I am satisfied with my ability to do things for fun outside my home |
|
| Social activity limitations (12 items) |
I have to limit the things I do for fun outside my home |
|||
| Confirmatory factor analysis (CFA) |
Social activities (21 items) |
Satisfaction with participation in social roles (14 items) |
||
| Social roles and responsibilities (16 items) |
Satisfaction with participation in discretionary activities (12 items) |
|||
| Social activity limitations (10 items) |
||||
| Item Response Theory (IRT) Modeling |
No item banks created |
Two item banks created: Satisfaction with participation in social roles (14 items) |
||
| Satisfaction with participation in discretionary activities (12 items) |
||||
In the Satisfaction EFA, we started with 56 items and deleted 30 items worded in terms of bother or disappointment. The introduction of both positively and negatively worded items, and the inclusion of nearly redundant content varying only by modifiers (e.g., disappointed; bothered), produced EFA results that reflected several small factors and a clear division between positive and negative items. Most of the negative items initially loaded on a separate factor; in subsequent analyses, they exhibited local dependence along predicted lines and poor discrimination. The remaining 26 positive items loaded on two factors: 14 satisfaction with participation in social roles items and 12 satisfaction with participation in discretionary activities items (Table 2). Good CFA model fit was found for these two factors (CFI = 0.959 and 0.968, respectively). The bifactor model (one general and two specific factors) demonstrated acceptable fit (CFI = 0.931), and there was no local dependence.
IRT analyses
All categories were used by the respondents, but with sparse coverage at the top of the hierarchy. When modeling all 49 Ability to Participate items together, the threshold range (−1.54 to 1.54) was narrower than the score measure range (−3.39 to 2.31), slopes were acceptable for all items (range: 1.84 to 4.52), and examination of the test information function showed that theta estimates were most precise in the middle score range. However, 23 items misfit the unidimensional IRT model (P < 0.05 for the S − X2 statistics). When modeling the three subsets separately, 7 of the 21 social activity items, 3 of the 16 social role items and 7 of the 12 social activity limitations items showed significant misfit. We concluded that a coherent, interpretable item bank could not be constructed from the tested Ability to Participate item pool. Instead, results were referred back to the PROMIS Social Health Workgroup for their use in refining the item wording and concepts to be measured in a second-round effort (ongoing as of 2010).
For Satisfaction with Participation, the threshold range (1.15 to −1.22) was narrower than the score measure range (−2.68 to 2.02), and slopes were acceptable for all 26 items (range: 2.66 to 4.46). However, 23 of 26 items misfit the unidimensional IRT model. When modeling the two subsets separately (satisfaction with participation in social roles and satisfaction with participation in discretionary activities), there was no item misfit. Item wording and calibration statistics are presented in Table 3.
Table 3.
Satisfaction with participation: items and item bank parameters
| Item Response Theory Calibration Statistics |
|||||
|---|---|---|---|---|---|
| Slope | Threshold 1 |
Threshold 2 |
Threshold 3 |
Threshold 4 |
|
| Satisfaction with participation in social roles | |||||
| I feel good about my ability to do things for my family | 3.152 | −1.650 | −1.083 | −0.315 | 0.544 |
| I am satisfied with my ability to meet the needs of those who depend on me | 3.679 | − 1.568 | − 1.009 | − 0.361 | 0.552 |
| I am satisfied with my ability to run errands | 3.274 | − 1.536 | − 0.980 | − 0.377 | 0.521 |
| I am happy with how much I do for my family | 3.009 | −1.581 | −0.967 | −0.198 | 0.707 |
| I am satisfied with my ability to do things for my family | 3.445 | − 1.579 | − 0.955 | − 0.305 | 0.636 |
| I am satisfied with my ability to do the work that is really important to me (include work at home) |
3.607 | −1.582 | −0.941 | −0.228 | 0.562 |
| I am satisfied with my ability to work (include work at home) | 4.688 | − 1.433 | − 0.936 | − 0.288 | 0.519 |
| I am satisfied with my ability to perform my daily routines | 5.577 | − 1.564 | − 0.920 | − 0.218 | 0.458 |
| The quality of my work is as good as I want it to be (include work at home) | 3.059 | −1.486 | −0.895 | −0.187 | 0.785 |
| I am satisfied with my ability to do regular personal and household responsibilities | 4.377 | −1.421 | −0.895 | −0.215 | 0.570 |
| I am satisfied with the amount of time I spend doing work (include work at home) | 3.329 | −1.492 | −0.850 | −0.036 | 0.779 |
| I am satisfied with the amount of time I spend performing my daily routines | 3.731 | −1.512 | −0.848 | 0.008 | 0.766 |
| I am satisfied with my ability to do household chores/tasks | 4.080 | − 1.429 | − 0.831 | − 0.145 | 0.617 |
| I am satisfied with how much work I can do (include work at home) | 4.424 | − 1.338 | − 0.799 | − 0.131 | 0.675 |
| Satisfaction with participation in discretionary activities | |||||
|
I am satisfied with my ability to do things for fun at home (like reading,
listening to music, etc.) |
2.702 | − 1.591 | − 0.890 | − 0.277 | 0.603 |
| I feel good about my ability to do things for my friends | 3.325 | −1.610 | −0.836 | −0.128 | 0.761 |
| I am satisfied with my ability to do things for my friends | 3.888 | − 1.464 | − 0.781 | − 0.003 | 0.760 |
| I am happy with how much I do for my friends | 3.346 | −1.459 | −0.757 | 0.111 | 0.908 |
| I am satisfied with my ability to do leisure activities | 4.352 | − 1.232 | − 0.649 | 0.002 | 0.724 |
| I am satisfied with my ability to do all of the community activities that are really important to me |
3.039 | −1.235 | −0.626 | 0.109 | 0.850 |
| I am satisfied with my current level of activities with my friends | 4.083 | − 1.149 | − 0.577 | 0.157 | 0.899 |
| I am satisfied with the amount of time I spend doing leisure activities | 4.292 | − 1.157 | − 0.559 | 0.150 | 0.811 |
| I am satisfied with my ability to do all of the leisure activities that are really important to me |
4.356 | −1.138 | −0.559 | 0.061 | 0.725 |
| I am satisfied with my current level of social activity | 3.745 | − 1.134 | − 0.558 | 0.192 | 0.916 |
| I am satisfied with the amount of time I spend visiting friends | 3.655 | −1.175 | −0.536 | 0.308 | 0.967 |
| I am satisfied with my ability to do things for fun outside my home | 4.900 | − 1.072 | − 0.531 | 0.126 | 0.723 |
Context for all items: In the past 7 days
Rating scale for all items: Not at all, A little bit, Somewhat, Quite a bit, Very much
Bold font indicates the seven items selected for the short forms (see text)
DIF analyses
For the two Satisfaction with Participation sub-domains, no items exhibited non-uniform DIF, and one (“satisfied with ability to do things for fun at home”) exhibited a trivial level of uniform age DIF (chi-square = 5.642; P = 0.018).
Short forms
Two seven-item short forms were developed (available at http://www.assessmentcenter.net/ac1 and shown in bold in Table 3). Table 4 displays descriptive statistics for the whole sample and for gender, age and education subgroups used in DIF analyses. A higher score represents higher satisfaction. Correlations between short form scores and SF-36 and FACT-G legacy subscales were moderate to high (0.43–0.74), suggesting good evidence of criterion validity.
Table 4.
Descriptive statistics for the short forms
| Total general population sample |
Gender |
Age in years |
Education |
||||
|---|---|---|---|---|---|---|---|
| Female | Male | <65 | 65+ | HS/GED or less |
More than HS/ GED |
||
| Satisfaction with participation in social roles |
n = 753 53.9 (8.9) |
n = 368 52.5 (9.3) |
n = 385 53.9 (8.9) |
n = 130 52.0 (9.4) |
n = 622 53.5 (9.1) |
n = 551 52.6 (9.1) |
n = 201 54.9 (9.2) |
| Satisfaction with participation in discretionary activities |
n = 751 48.5 (9.5) |
n = 368 47.9 (9.4) |
n = 383 49.3 (9.6) |
n = 129 47.8 (9.7) |
n = 621 48.7 (9.5) |
n = 549 47.5 (9.5) |
n = 201 51.5 (9.1) |
Sample size and mean (SD) are shown in the table. HS/GED high school or general educational development credential
Precision
Figure 2 provides the test information function for the two Satisfaction banks and short forms. Considering 30 as an arbitrary threshold for reliable measurement, which corresponds to a standard error of 0.41, these preliminary item banks provide reliable measurement across a range of ~3 standard deviation units; the short forms provide reliable measurement across ~2.5 standard deviation units. Accurate (reliable) measurement spans both sides of the average (T-score = 50) but covers relatively more of the impaired (poorer social health) side of the average for the general US population.
Fig. 2.
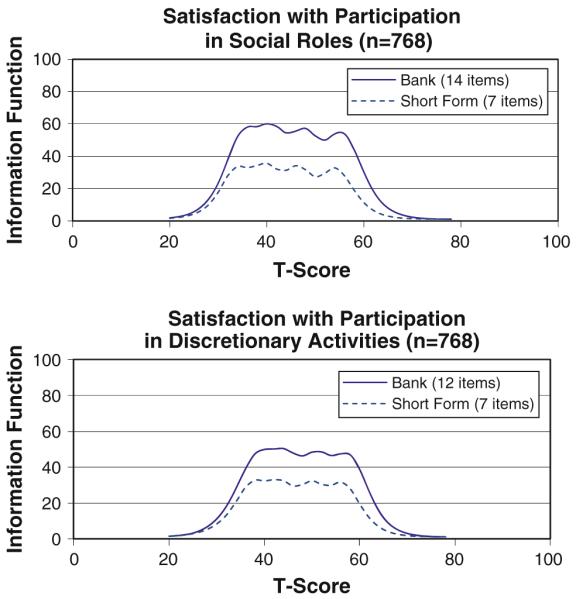
Test information function curves
Discussion
PROMIS aims to create measures that are valid, easily administered and useful in behavioral, epidemiological, clinical and health services research. Outreach to end users requires a transparent description of the item bank development methods. Our goal here was to describe in detail the processes used to develop Social Health item banks, with a focus on quantitative methods that complement the qualitative methods described elsewhere [20, 21].
PROMIS seeks to build measurement validity throughout all stages of development. Content validity was sought by examining previous models and by collecting patient experiences about their social well-being and limitations [20, 21]. Sub-domain structures emerged from qualitative data, expert consensus and quantitative results of extensive field tests. Although Ability to Participate and its three subdomains were essentially unidimensional (based on EFA and CFA), they did not fit the IRT model, when examined either separately or together. That is, while the content of the items was designed to measure the same construct, the observed data were not consistent with model expectations. As a result, we opted to commit to developing calibrated Ability to Participate item banks in a supplemental PROMIS project that is underway.
Two Satisfaction with Participation sub-domains (Social Roles and Discretionary Activities) met the requirements of unidimensionality and IRT model fit, and small preliminary item banks were created. Of note, results from oncology data were found to be consistent with clinical experiences, that is, individuals tend to experience limitations in leisure before reaching a higher level of social function limitation that extends to the areas of work and family [19]. This confluence of quantitative results and clinical expectations begins to build support for the clinical importance of the social health measures. Additionally, quantitative analyses presented here indicated that items performed uniformly across gender, age and education.
By assessing social health via well-constructed item banks, the entire continuum of the domain can be accurately measured, with floor and ceiling effects minimized. Using the information in the item bank library, researchers can create CATs or short form measures tailored to their populations of interest. Scores on these tailored measures can then be easily compared because the items have been mapped onto a common metric. Likewise, by promoting a comprehensive domain map that is congruent with prevalent health frameworks, PROMIS seeks to provide a common model to be used across lines of PRO research.
Conceptual considerations and generalizability
Progress on the development and validation of PROMIS Social Health item banks has been significant, yet incremental. Unlike physical and mental health, both of which have long traditions of measurement with hundreds of instruments, social health—particularly as an outcome measure—has historically suffered neglect. Two small Satisfaction with Participation banks (Social Roles and Discretionary Activities) were successfully developed; others in Ability to Participate did not materialize in the first attempt. However, results suggest possible explanations that have been carried forward to planning subsequent work. First, in our attempt to explore alternative phrasing of items with very similar content, we introduced confusion of concepts within the bank and item local dependence. The repetitive nature of the items (with and without modifiers; positive and negative wording) may also have led to more missing data. Second, it is challenging to distinguish where social health variables lie along an outcome continuum. Not all health-relevant social variables are necessarily health outcomes, per se, and deciding which are, may be subject to disagreement and somewhat dependent on the study context.
A related conceptual complexity is that social health outcomes are often influenced by factors other than health, for example, attitudes, personality and finances. Consequently, the degree to which physical or mental health are causes of changes in social functioning may be difficult to determine. Even if respondents were asked whether health factors played a role (e.g., “due to my illness, I could not…”), it may not be possible to provide a meaningful answer. All of these considerations complicate determining when social functioning represents a health outcome. By using these social health item banks, researchers will be able to examine associations between sociodemographic, clinical and behavioral factors and patient-reported outcomes.
Another limitation of our study is that we did not include any clinical samples in the calibration analyses. PROMIS items are intended to reflect the general population across its full functional range. Without oversampling the extremes of the continuum, however, the number of cases representing the most impaired end of the distribution was too few to serve as a basis for item calibration within that extreme range. That is, item responses were probably more skewed than they would have been had we been able to include a sample whose social functioning was more likely to be negatively affected by medical or mental health conditions. Our study sample, although drawn from a registry of more than one million people, may also not be fully representative of the U.S. general population in that it is comprised of people who have agreed to participate in this online registry. However, the degree of skew in the data was not so extreme as to adversely affect the analyses. In these IRT analyses, marginal maximum likelihood (MML) estimation assumes the normal distribution of theta in the population. However, when the assessment is of sufficient length, the effect of departure from normality (skewness) on the parameter estimation is negligible.
Summary and future steps
We considered the conceptual issues discussed here and elsewhere [19] as we worked toward a domain framework that includes both Social Function and Social Relationships (Fig. 1). At the broadest level, social health includes health outcomes and social processes (e.g., social support) that play an important role in influencing health. In some contexts, processes such as social support can be outcomes of interventions such as family therapy or forms of psychotherapy. For the PROMIS initiative, we began by focusing on the Social Function sub-domain, which is most commonly measured as a health outcome. Our initial conceptualization identified two broad categories of Social Function outcomes, Ability to Participate and Satisfaction with Participation; both encompass the four contexts of family, friends, work and leisure activities.
Field test results produced two item banks for Satisfaction with Participation: Social Roles and Discretionary Activities (Table 3). However, Ability to Participate items failed to produce a coherent item bank. The implications for future research are that sub-domains of Social Function may need to be much more narrowly defined. We are currently revising the Social Function item pools and creating item pools for the Social Relationships sub-domains (Fig. 1) [38]. We also plan to field test these revised item pools in various clinical samples. Doing so will remedy one of the limitations of the current study, namely, field test results based on only general population data. Future analyses will investigate whether the enhanced item pools produce factor structures in line with our conceptual model and result in item banks that can be used across chronic illnesses.
Acknowledgments
The Patient-Reported Outcomes Measurement Information System (PROMIS) is a National Institutes of Health (NIH) Roadmap initiative to develop a computerized system measuring patient-reported outcomes in respondents with a wide range of chronic diseases and demographic characteristics. PROMIS was funded by cooperative agreements to a Statistical Coordinating Center (Northwestern University, PI: David Cella, PhD, U01AR52177) and six Primary Research Sites (Duke University, PI: Kevin Weinfurt, PhD, U01AR52186; University of North Carolina, PI: Darren DeWalt, MD, MPH, U01AR52181; University of Pittsburgh, PI: Paul A. Pilkonis, PhD, U01AR52155; Stanford University, PI: James Fries, MD, U01AR52158; Stony Brook University, PI: Arthur Stone, PhD, U01AR52170; and University of Washington, PI: Dagmar Amtmann, PhD, U01AR52171). NIH Science Officers on this project have included Deborah Ader, PhD, Susan Czajkowski, PhD, Lawrence Fine, MD, DrPH, Laura Lee Johnson, PhD, Louis Quatrano, PhD, Bryce Reeve, PhD, William Riley, PhD, Susana Serrate-Sztein, PhD, and James Witter, MD, PhD. This manuscript was reviewed by the PROMIS Publications Subcommittee prior to external peer review. The authors thank Ron Hays, PhD, and Paul Pilkonis, PhD, for helpful suggestions on the final version of the manuscript, and Jacquelyn George for assistance with research coordination. See the web site at www.nihpromis.org for additional information on the PROMIS cooperative group. Presented in part at the International Symposium on Measurement of Participation in Rehabilitation Research, Toronto, Ontario, Canada, October 14–15, 2008.
Contributor Information
Elizabeth A. Hahn, Department of Medical Social Sciences, Feinberg School of Medicine, Northwestern University, 710 N. Lake Shore Dr., Room 725, Chicago, IL 60611, USA
Robert F. DeVellis, Department of Health Behavior and Health Education, School of Public Health, University of North Carolina at Chapel Hill, Chapel Hill, NC, USA
Rita K. Bode, Department of Physical Medicine and Rehabilitation, Feinberg School of Medicine, Northwestern University, Chicago, IL, USA
Sofia F. Garcia, Department of Medical Social Sciences, Feinberg School of Medicine, Northwestern University, 710 N. Lake Shore Dr., Room 725, Chicago, IL 60611, USA
Liana D. Castel, Institute for Medicine and Public Health and Vanderbilt Epidemiology Center, Vanderbilt University Medical Center, Nashville, TN, USA
Susan V. Eisen, Department of Health Policy and Management, Boston University School of Public Health and Center for Health Quality, Outcomes & Economic Research, ENRM Veterans Hospital, Bedford, MA, USA
Hayden B. Bosworth, Center for Health Services Research, Durham VAMC; Departments of Medicine, Psychiatry, and Nursing, Duke University Medical Center, Durham, NC, USA
Allen W. Heinemann, Department of Physical Medicine and Rehabilitation, Feinberg School of Medicine, Northwestern University, Chicago, IL, USA
Nan Rothrock, Department of Medical Social Sciences, Feinberg School of Medicine, Northwestern University, 710 N. Lake Shore Dr., Room 725, Chicago, IL 60611, USA.
David Cella, Department of Medical Social Sciences, Feinberg School of Medicine, Northwestern University, 710 N. Lake Shore Dr., Room 725, Chicago, IL 60611, USA.
References
- 1.Cella D, Chang CH. A discussion of item response theory (IRT) and its applications in health status assessment. Medical Care. 2000;38(9 Suppl):1166–1172. doi: 10.1097/00005650-200009002-00010. [DOI] [PubMed] [Google Scholar]
- 2.Hays RD, Morales LS, Reise SP. Item response theory and health outcomes measurement in the 21st century. Medical Care. 2000;38(9 Suppl II):28–42. doi: 10.1097/00005650-200009002-00007. [DOI] [PMC free article] [PubMed] [Google Scholar]
- 3.Bode RK, Lai JS, Cella D, Heinemann AW. Issues in the development of an item bank. Archives of Physical Medicine and Rehabilitation. 2003;84(4 Suppl 2):S52–S60. doi: 10.1053/apmr.2003.50247. [DOI] [PubMed] [Google Scholar]
- 4.Hahn EA, Cella D, Bode RK, Gershon R, Lai JS. Item banks and their potential applications to health status assessment in diverse populations. Medical Care. 2006;44(11 Suppl 3):S189–S197. doi: 10.1097/01.mlr.0000245145.21869.5b. [DOI] [PubMed] [Google Scholar]
- 5.Cella D, Yount S, Rothrock N, Gershon R, Cook K, Reeve B, et al. The patient-reported outcomes measurement information system (PROMIS): Progress of an NIH roadmap cooperative group during its first two years. Medical Care. 2007;45(5 Suppl 1):S3–S11. doi: 10.1097/01.mlr.0000258615.42478.55. [DOI] [PMC free article] [PubMed] [Google Scholar]
- 6.World Health Organization . Constitution of the World Health Organization. World Health Organization; Geneva: 1946. [Google Scholar]
- 7.House JS, Kahn RL. Measures and concepts of social support. In: Cohen S, Syme SL, editors. Social support and health. Academic Press; New York, NY: 1985. pp. 83–108. [Google Scholar]
- 8.Haines VA, Hurlbert JS. Network range and health. Journal of Health and Social Behavior. 1992;33(3):254–266. [PubMed] [Google Scholar]
- 9.Berkman L, Glass T, Berkman L, Kawachi I. Social integration, social methods, social support, and health. In: Berkman L, Kawachi I, editors. Social epidemiology. Oxford University Press; New York: 2000. pp. 137–173. [Google Scholar]
- 10.Weissman MM, Bothwell S. Assessment of social adjustment by patient self-report. Archives of General Psychiatry. 1976;33(9):1111–1115. doi: 10.1001/archpsyc.1976.01770090101010. [DOI] [PubMed] [Google Scholar]
- 11.Henderson S, Duncan-Jones P, Byrne DG, Scott R. Measuring social relationships. The interview schedule for social interaction. Psychological Medicine. 1980;10(4):723–734. doi: 10.1017/s003329170005501x. [DOI] [PubMed] [Google Scholar]
- 12.Birchwood M, Smith J, Cochrane R, Wetton S, Copestake S. The social functioning scale. The development and validation of a new scale of social adjustment for use in family intervention programmes with schizophrenic patients. British Journal of Psychiatry. 1990;157:853–859. doi: 10.1192/bjp.157.6.853. [DOI] [PubMed] [Google Scholar]
- 13.Eisen SV, Normand SLT, Belanger AJ, Gevorkian S, Irvin EA. BASIS-32 and the revised behavioral symptom identification scale (BASIS-R) In: Maruish M, editor. The use of psychological testing for treatment planning and outcome assessment. 3rd ed. Vol. 3. Lawrence Erlbaum; Mahway, NJ: 1994. pp. 759–790. [Google Scholar]
- 14.Dijkers MP, Whiteneck G, El Jaroudi R. Measures of social outcomes in disability research. Archives of Physical Medicine and Rehabilitation. 2000;81(12 Suppl 2):S63–S80. doi: 10.1053/apmr.2000.20627. [DOI] [PubMed] [Google Scholar]
- 15.World Health Organization World Health Organization Disability Assessment Schedule II (WHODAS II) 2001 Nov 27; 2001. Retrieved 2005/03/15/, from http://www.who.int/lcidh/whodas/index.html.
- 16.Brekke JS, Long JD, Kay DD. The structure and invariance of a model of social functioning in schizophrenia. Journal of Nervous and Mental Disease. 2002;190(2):63–72. doi: 10.1097/00005053-200202000-00001. [DOI] [PubMed] [Google Scholar]
- 17.Horowitz LM, Rosenberg SE, Baer BA, Ureno G, Villasenor VS. Inventory of interpersonal problems: Psychometric properties and clinical applications. Journal of Consulting and Clinical Psychology. 1988;56(6):885–892. doi: 10.1037//0022-006x.56.6.885. [DOI] [PubMed] [Google Scholar]
- 18.Wills TA. Supportive functions of interpersonal relationships. In: Cohen S, Syme SL, editors. Social support and health. Academic Press, Inc.; Orlando, FL: 1985. pp. 61–82. [Google Scholar]
- 19.Hahn EA, Cella D, Bode RK, Hanrahan RT. Measuring social well-being in people with chronic illness. Social Indicators Research. 2010;96:381–401. [Google Scholar]
- 20.DeWalt DA, Rothrock N, Yount S, Stone AA. Evaluation of item candidates: The PROMIS qualitative item review. Medical Care. 2007;45(5 Suppl 1):S12–S21. doi: 10.1097/01.mlr.0000254567.79743.e2. [DOI] [PMC free article] [PubMed] [Google Scholar]
- 21.Castel LD, Williams KA, Bosworth HB, Eisen SV, Hahn EA, Irwin DE, et al. Content validity in the PROMIS social-health domain: A qualitative analysis of focus-group data. Quality of Life Research. 2008;17(5):737–749. doi: 10.1007/s11136-008-9352-3. [DOI] [PMC free article] [PubMed] [Google Scholar]
- 22.Cella D, Riley W, Stone AA, Rothrock N, Reeve BB, Yount S, et al. Initial item banks and first wave testing of the patient reported outcomes measurement information system (PROMIS) network: 2005–2008. Journal of Clinical Epidemiology. 2009 doi: 10.1016/j.jclinepi.2010.04.011. in press. [DOI] [PMC free article] [PubMed] [Google Scholar]
- 23.Hays RD, Bjorner J, Revicki DA, Spritzer K, Cella D. Development of physical and mental health summary scores from the patient reported outcomes measurement information system (PROMIS) global items. Quality of Life Research. 2009;18(7):873–880. doi: 10.1007/s11136-009-9496-9. [DOI] [PMC free article] [PubMed] [Google Scholar]
- 24.Ware JE, Jr., Sherbourne CD. The MOS 36-item Short-Form Health Survey (SF-36). I. Conceptual framework and item selection. Medical Care. 1992;30(6):473–483. [PubMed] [Google Scholar]
- 25.Brucker PS, Yost K, Cashy J, Webster K, Cella D. General population and cancer patient norms for the functional assessment of cancer therapy-general (FACT-G) Evaluation & The Health Professions. 2005;28(2):192–211. doi: 10.1177/0163278705275341. [DOI] [PubMed] [Google Scholar]
- 26.Reeve BB, Hays RD, Bjorner JB, Cook KF, Crane PK, Teresi JA, et al. Psychometric evaluation and calibration of health-related quality of life item banks: Plans for the patient-reported outcomes measurement information system (PROMIS) Medical Care. 2007;45(5 Suppl 1):S22–S31. doi: 10.1097/01.mlr.0000250483.85507.04. [DOI] [PubMed] [Google Scholar]
- 27.Muthen BO, du Toit SHC, Spisic D. Robust inference using weighted least squares and quadratic estimating equations in latent variable modeling with categorical and continuous outcomes. 1987 Retrieved 2007/01/08/, from http://www.gseis.ucla.edu/faculty/muthen/articles/Article_075.pdf.
- 28.Muthen LK, Muthen BO. Mplus user’s guide. Muthen & Muthen; Los Angeles, CA: 2006. [Google Scholar]
- 29.Hu LT, Bentler PM. Cutoff criteria for fit indexes in covariance structure analysis: Conventional criteria versus new alternatives. Structural Equation Modeling. 1999;6(1):1–55. [Google Scholar]
- 30.Gibbons R, Hedeker D. Full-information item bifactor analysis. Psychometrika. 1992;57(3):423–436. [Google Scholar]
- 31.McDonald RP. The dimensionality of test and items. British Journal of Mathematical and Statistical Psychology. 1981;34:100–117. [Google Scholar]
- 32.Samejima F. Estimation of latent ability using a response pattern of graded scores. Psychometrika Monograph Supplement, No. 17. 1969 [Google Scholar]
- 33.Thissen D. MULTILOG user’s guide. Multiple, categorical item analysis and test scoring using item response theory. Scientific Software International, Inc.; Lincolnwood, IL: 1991. [Google Scholar]
- 34.van der Linden WJ, Hambleton RK. Handbook of modern item response theory. Springer; New York: 1997. [Google Scholar]
- 35.Orlando M, Thissen D. Likelihood-based item-fit indices for dichotomous item response theory models. Applied Psychological Measurement. 2000;24:50–64. [Google Scholar]
- 36.Orlando M, Thissen D. Further examination of the performance of S−X2, an item fit index for dichotomous item response theory models. Applied Psychological Measurement. 2003;27:289–298. [Google Scholar]
- 37.Thissen D. IRTLRDIF-Software for the computation of the statistics involved in item response theory likelihood-ratio test for differential item functioning (Version 2.0b) 2003. [Google Scholar]
- 38.Garcia SF, Cella D, Clauser SB, Flynn KE, Lai JS, Reeve BB, et al. Standardizing patient-reported outcomes assessment in cancer clinical trials: a patient-reported outcomes measurement information system initiative. Journal of Clinical Oncology. 2007;25(32):5106–5112. doi: 10.1200/JCO.2007.12.2341. [DOI] [PubMed] [Google Scholar]