Abstract
Planar nanochannels are fabricated using sacrificial etching technology with sacrificial cores consisting of aluminum, chromium, and germanium, with heights ranging from 18 to 98 nm. Transient filling via capillary action is compared against the Washburn equation [E. W. Washburn, Phys. Rev. 17, 273 (1921)], showing experimental filling speeds significantly lower than classical continuum theory predicts. Departure from theory is expressed in terms of a varying dynamic contact angle, reaching values as high as 83° in channels with heights of 18 nm. The dynamic contact angle varies significantly from the macroscopic contact angle and increases with decreasing channel dimensions.
Nanofluidics is a powerful emerging field that promises to greatly expand the field of analytical separations.1 Some benefits of nanofluidics include the use of minute sample volumes and the ability to directly employ channel dimensions as the fractionating element in molecular separations.2, 3 Conversely, several drawbacks include difficulties encountered in sample introduction, detection, and fluid pumping.4 Capillary flow rates also decrease significantly from predicted continuum theory values when channel dimensions fall in the range of tens of nanometers or less.5, 6, 7, 8, 9 As such, nanofluidic filling methods must be stringently characterized, and nanofluidic fabrication methods must be developed which produce high device yields. One review that covers nanofluidic fabrication methods is presented by Perry et al.10
Capillary flow in nanochannels has been studied for several systems, and in most cases the flow is found to be slower than continuum-based theory predicts as the channel hydraulic diameter approaches tens of nanometers. This behavior has been attributed to electroviscosity,5, 6, 7, 11 bubble formation,8 and variations in the dynamic contact angle.9 While the exact mechanisms may not be fully understood, the result is increasingly shallow nanochannels fill more slowly than classical continuum-based theory predicts.
We present nanofluidic channels fabricated using sacrificial core techniques. These techniques lead to high device yield, high channel-to-channel reproducibility, and low fabrication costs. Due to the short length of our channels and the aggressive nature of the core etchant, these channels can also be fabricated quickly. We characterize capillary flow by recording video of filling experiments and measuring the liquid meniscus position over time. The resulting data are then compared against the Washburn formula, which is assumed to approximate the filling behavior of a planar channel. This comparison yields similar observations to those noted by other researchers, in that shallow channels fill more slowly than theory predicts.
Standard photolithographic methods are used in this treatment for fabricating nanochannels, as illustrated in Fig. 1. A silicon wafer is coated in approximately 200 nm of plasma-enhanced chemical vapor deposited (PECVD) silicon dioxide to form a wettable bottom surface (a). A sacrificial material is then deposited to the thickness of the desired channel height (b). Photoresist is spun-on and patterned to mask the nanochannel areas, and the exposed sacrificial material is etched away. The masking photoresist is dissolved in acetone, leaving behind the nanochannel sacrificial cores (c). The cores are then encased in a 5-μm-thick layer of PECVD silicon dioxide (d). Photoresist is used to mask reservoirs over the ends of the sacrificial cores, and the reservoirs are then etched into the oxide (e). The now-exposed cores are removed with a chemical etchant exhibiting a high selectivity for the sacrificial material compared to the encapsulating oxide (aqua regia for the aluminum cores, hydrogen peroxide for the germanium cores, Transene chromium etchant for the chromium cores, and piranha for the SU8 cores). Once the sacrificial cores are removed, the devices are soaked in de-ionized water for several days to allow etchant byproducts to diffuse out of the channels. The result is oxide-encased nanochannels with heights equal to the thickness of the original sacrificial layer (f). Completed nanochannels were 15 μm wide and 1200 μm long, and Table 1 contains statistical data gathered using surface profilometry, including the average channel heights, hav, the 95% confidence interval of heights measured from channel to channel, 2s, and the average surface roughness, Rs.
Figure 1.
Fabrication steps to create sacrificially etched nanochannels. (a) A silicon wafer is coated in a thin layer of PECVD silicon dioxide, after which (b) a sacrificial material is deposited to a thickness that corresponds to the height of the channel. (c) Parallel lines are etched out of the sacrificial layer, following which (d) a thick layer of oxide is deposited over the entire device. (e) Fluid reservoirs are etched into the oxide, and (f) the exposed sacrificial material is etched away, resulting in hollow silicon dioxide channels.
Table 1.
Average height data, hav, for channels fabricated from various sacrificial cores. The error listed, 2s, corresponds to 95% confidence, and Rs corresponds to average surface roughness.
| Core material | hav (nm) | 2s (nm) | Rs (nm) |
|---|---|---|---|
| Aluminum | 97 | 8 | 5 |
| Aluminum | 53 | 4 | 2 |
| Aluminum | 18 | 1 | 3 |
| Chromium | 98 | 7 | 5 |
| Chromium | 74 | 4 | 3 |
| Germanium | 91 | 10 | 6 |
| Germanium | 56 | 3 | 4 |
Sacrificially etched nanochannels can be easily filled using capillary action. Capillary flow in planar channels can be modeled by the Washburn equation,12
| (1) |
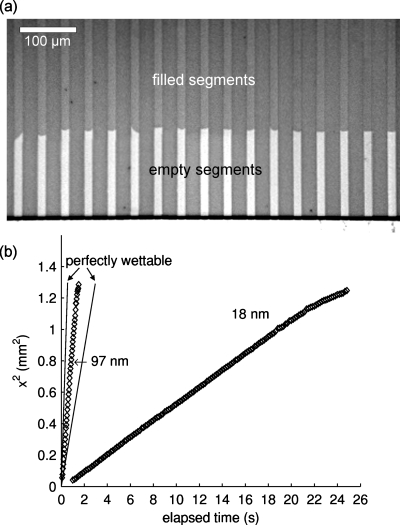
where x is the meniscus position, γ is the air-liquid surface tension, θ is the contact angle, η is the dynamic viscosity, h is the channel height, and t is the elapsed time. Equation 1 is generally accepted as an accurate model for capillary filling in planar channels and is used in most treatments to compare how far transient nanochannel filling departs from theory. Ralston et al. provided a review of experimental efforts validating the Washburn model for channels as short as 5 nm in height.13 However, this review also reports significant deviations from the Washburn model for channels tens and hundreds of nanometers tall, suggesting the Washburn model may not be completely valid for all types of nanochannels. To study this validity for sacrificially etched nanochannels, Fig. 2a shows a photo of de-ionized water filling a series of 97-nm-tall channels at approximately 1 s following injection. The filled channel portions are dark while the empty channel portions are light. Apparent in this figure is a slight variation in some of the meniscus fronts, which may be due to variations in surface roughness or inhomogeneities in channel surface chemistries. Figure 2b is a plot of the average fluid meniscus position squared versus elapsed time for channels with heights of 97 and 18 nm, where the average 2s meniscus position uncertainty across various chips is 5.8% for the 97-nm-tall channels and 3.4% for the 18-nm-tall channels. Since the viewing window to record meniscus position does not include the injection channel opening, a temporal shift of the data results in a confidence interval at the origin of ±0.256 and ±0.0246 s for 18-nm-tall channels and 97-nm-tall channels, respectively. These curves are linear (x2∝t), and the taller channels fill much more quickly than the shorter channels (x2∕t∝h), as predicted by Washburn’s equation. The slight decrease in slope for each curve around 1.2 mm2 is attributed to the slight change in cross-sectional area at the channel end due to the wet-etching methods used to create the reservoirs.
Figure 2.
Capillary filling of nanochannels. (a) Photograph of 97-nm-tall channels made from aluminum sacrificial cores. The channels fill from top to bottom, where the dark segments are filled with water approximately 1 s following the initial injection, and the light segments are empty. (b) Plot of meniscus position squared vs elapsed time for 97-nm-tall and 18-nm-tall channels. The coefficients of determination, R2, are 0.9987 and 0.9971 for the 18-nm-tall channels and the 97-nm-tall channels, respectively. Also shown in the figure are two solid lines representing the theoretical case for perfect wettability predicted by the Washburn equation for the 18-nm-tall channels and the 97-nm-tall channels.
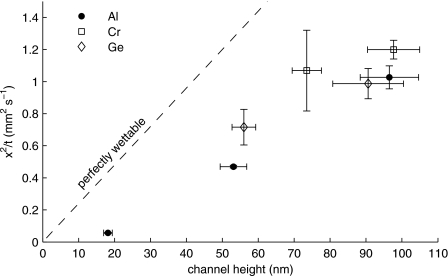
In order to more fully evaluate how well sacrificially etched nanochannels validate the Washburn equation, meniscus position squared over time (x2∕t) is plotted versus height for various nanochannels in Fig. 3. Included in this plot is a dashed line representing capillary flow in perfectly wettable channels (θ→0), where we assume standard values for γ and η of 72 mN m−1 and 1 cP at room temperature and atmospheric pressure. The data points shown in Fig. 3 correspond to nanochannels fabricated from aluminum, chromium, and germanium sacrificial cores. The horizontal error bars represent the range of 95% confidence in channel height measured across various channels, and the vertical error bars represent the range of 95% confidence in position squared per unit time measured across various chips.
Figure 3.
Nanochannel filling speeds vs channel height. Sacrificial core materials include aluminum (Al), chromium (Cr), and germanium (Ge). The dashed line indicates the expected theoretical result assuming perfect wettability. Each of the data points shown corresponds to channels with top wall thicknesses of 5 μm.
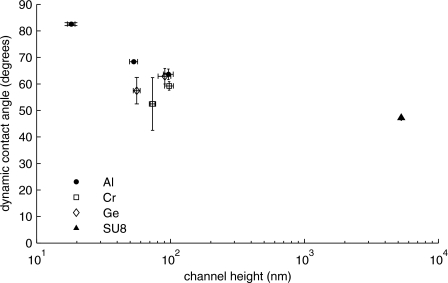
An effective method of comparing the experimental data against the Washburn model is to calculate the dynamic contact angle for various samples. The dynamic contact angle was chosen as the varying parameter of choice in this treatment as opposed to bubble formation or the electroviscous effect because other reports suggest that these mechanisms cannot account fully for the level of deviation from the theoretical model witnessed by the channels in this investigation.8, 10 The dynamic contact angle varies due to the instantaneous force balance that prevails during capillary filling, and for small channels this value has been shown to be larger than expected.9 It is also worth noting that, as the name implies, the dynamic contact angle varies during the filling process and is related to the velocity of the meniscus front. However, for the range of velocities in this treatment, the dynamic contact angle should not vary more than about 4° at any time for any tested channel according to the work reported by Ralston et al.13 While measured dynamic contact angles deviate from the static value at all scales, the departure appears to be quite significant for sacrificially etched nanochannels. Figure 4 shows the calculated dynamic contact angle for the same data of Fig. 3, including an additional data point for microfluidic channels fabricated from SU8 sacrificial cores. The dynamic contact angle increases dramatically for channels as short as 18 nm, whereas in the ideal case the contact angle would be constant for all channels. The general trend indicates that the dynamic contact angle decreases with increasing channel height. Microchannels with heights of 5.3 μm were used to determine if the dynamic contact angle would approach the expected macroscopic range of values for water on silicon dioxide, which was measured using a goniometer to be nominally 20° or lower. However, the resulting contact angle for these microchannels was 47°, which is significantly greater than the macroscopic contact angle. These large deviations from measured static contact angles are not unexpected and numerically approach values for water-filling channels reported by Han et al.14 Other deviations reported for bonded nanochannels are not as large as those presented here, where significantly lower contact angles (θ<10°) appeared to prevail.5 This would suggest some fundamental difference between channels made from sacrificial etching and bonding, such as variations in surface roughness or surface chemistry causing largely different magnitudes of θ. For example, Tas et al. reported surface roughnesses as low as 0.16 nm for bonded channels with a reported x2∕t deviation of about 24% from the theoretical value, which is a much smaller deviation than that reported here.7 Oh et al. furthered this observation by pointing out that channels as short as 6 nm exhibited a strong x2∝t relationship, while the overall filling speeds were reduced.15 Furthermore, Ralston et al. pointed out that chemically patterning walls lead to variations in the contact angle, which may be an effect at play for sacrificially etched channels.13 It should be noted that there is no empirical difference in filling behavior between channels fabricated with different sacrificial cores.
Figure 4.
Calculated dynamic contact angles versus channel heights. Sacrificial core materials include aluminum (Al), chromium (Cr), germanium (Ge), and SU8 photoresist. These results exhibit a trend of increasing dynamic contact angle with decreasing channel height.
Acknowledgments
This work has treated sacrificially etched nanochannels made from aluminum, germanium, chromium, and SU8 sacrificial cores. Hydrodynamic filling effects were analyzed and compared against the well-founded Washburn model for planar channels, and while the filling behavior matched the curve provided by the model, the values deviated significantly when compared against static contact angles measured for a sessile drop with a goniometer. Deviations were attributed to large dynamic contact angles, which occur due to instantaneous force balancing during capillary filling and may be related to channel surface roughness or surface chemistry.
References
- Abgrall P. and Nguyen N. T., Anal. Chem. 80, 2326 (2008). 10.1021/ac702296u [DOI] [PubMed] [Google Scholar]
- Fu J., Mao P., and Han J., Trends Biotechnol. 26, 311 (2008). 10.1016/j.tibtech.2008.02.009 [DOI] [PubMed] [Google Scholar]
- Hamblin M. N., Xuan J., Maynes D., Tolley H. D., Belnap D. M., Woolley A. T., Lee M. L., and Hawkins A. R., Lab Chip 10, 173 (2009). 10.1039/b916746c [DOI] [PubMed] [Google Scholar]
- Eijkel J. C. T. and van den Berg A., Microfluid. Nanofluid. 1, 249 (2005). 10.1007/s10404-004-0012-9 [DOI] [Google Scholar]
- Mortensen N. A. and Kristensen A., Appl. Phys. Lett. 92, 063110 (2008). 10.1063/1.2857470 [DOI] [Google Scholar]
- Haneveld J., Tas N. R., Brunets N., Jansen H. V., and Elwenspoek M., J. Appl. Phys. 104, 014309 (2008). 10.1063/1.2952053 [DOI] [Google Scholar]
- Tas N. R., Haneveld J., Jansen H. V., Elwenspoek M., and van den Berg A., Appl. Phys. Lett. 85, 3274 (2004). 10.1063/1.1804602 [DOI] [Google Scholar]
- Thamdrup L. H., Persson F., Bruus H., and Kristensen A., Appl. Phys. Lett. 91, 163505 (2007). 10.1063/1.2801397 [DOI] [Google Scholar]
- Zhu Y. and Petkovic-Duran K., Microfluid. Nanofluid. 8, 275 (2010). 10.1007/s10404-009-0516-4 [DOI] [Google Scholar]
- Phan V. -N., Yang C., and Nguyen N. -T., Microfluid. Nanofluid. 7, 519 (2009). 10.1007/s10404-009-0410-0 [DOI] [Google Scholar]
- Perry J. L. and Kandlikar S. G., Microfluid. Nanofluid. 2, 185 (2006). 10.1007/s10404-005-0068-1 [DOI] [Google Scholar]
- Washburn E. W., Phys. Rev. 17, 273 (1921). 10.1103/PhysRev.17.273 [DOI] [Google Scholar]
- Ralston J., Popescu M., and Sedev R., Annu. Rev. Mater. Res. 38, 23 (2008). 10.1146/annurev.matsci.38.060407.130231 [DOI] [Google Scholar]
- Han A., Mondin G., Hegelbach N. G., de Rooij N. F., and Staufer U., J. Colloid Interface Sci. 293, 151 (2006). 10.1016/j.jcis.2005.06.037 [DOI] [PubMed] [Google Scholar]
- Oh J. M., Telli F., de Beer S., and Mugele F., Microfluid. Nanofluid. 9, 123 (2010). 10.1007/s10404-009-0517-3 [DOI] [Google Scholar]


