

Abstract
Microstructural metrics obtained using magnetic resonance imaging (MRI) such as transverse relaxation time and radial diffusivity have been used as in vivo markers of human brain tissue integrity. Considering the sensitivity of these parameters to some common biophysical contributors and their structural and spatial heterogeneity, we hypothesized that strong inter and intra-regional association exist between these variables providing evidence to possible interplay between transverse relaxation time and radial diffusivity. To validate our hypothesis we obtained high resolution anatomical T1-weighted data and fused it with T2-relaxomotry and diffusion tensor imaging (DTI) data on a cohort of healthy adults. The anatomical data were parcellated using FreeSurfer and then coaligned and fused with the T2 and DTI maps. Our data reveal some association between transverse relaxation and radial diffusivity that may help towards the interpretation and modeling of the biophysical contributors to the measured MRI metrics.
Keywords: Diffusion tensor imaging, DTI, T2 relaxation time, relaxometry, atlas, human brain mapping, microstructure, FreeSurfer, cortex, basal ganglia, corpus callosum, gray matter, white matter, quantitative MRI, hippocampus, motor cortex, sensory cortex
Introduction
Magnetic resonance imaging (MRI) provides several parameters that can be used as in vivo markers of the structural alterations to brain tissue that accompany development, natural aging and neurological diseases such as epilepsy, multiple sclerosis and Alzheimer’s disease. Macroscopic volumetry derived by T1-weighted MRI can be used to investigate age related volume atrophy (Walhovd et al., 2005; Fjell et al., 2009; Ostby et al., 2009) and disease-driven volume atrophy (Ramasamy, et al., 2009; Hasan et al., 2009a) of various regions of the brain.
Quantitative MRI tissue markers such as T2 relaxation time derived using multiple spin-echo maps (Ono et al., 1993; Whittall et al., 1997; Baratti et al., 1999) and diffusion tensor imaging (DTI) metrics (Pierpaoli et al., 1996; Basser et al., 1997) such as fractional anisotropy (FA), mean diffusivity (MD), axial diffusivity (λ||) and radial diffusivity (λ⊥) are sensitive to tissue microstructural parameters such as intra-axonal and cellular integrity, water distribution and myelin content in the brain (Le Bihan et al., 2001; Beaulieu, 2002). Transverse relaxation time has been hypothesized to be a sensitive marker of myelination (Ono et al., 1993; Whittall et al., 1997), structural integrity (Georgiades et al., 2001; Bartzokis et al., 2004) and has also been shown to be affected by non-heme iron deposition (Haacke et al., 2005; Jara et al., 2006; Bartzokis et al., 2007; House et al., 2008; Mitsumori et al., 2009; Yao et al., 2009). DTI metrics such as FA MD, (Beaulieu, 2002) and subsequently generated fiber tracks have been λ|| and λ⊥ utilized in assessing the microstructural integrity of compact white matter (WM) fiber bundles (Stieltjes et al., 2001, Wakana et al., 2007; Lebel et al., 2008; Hasan et al., 2009b; Wahl et al., 2010). Understanding the regional distribution of these metrics and their association is essential as these parameters vary with age and disease. However, the specificity of these metrics using the contrast provided by each modality may not be optimal (Assaf et al., 2008; Bar-Shir et al, 2009; Barazany et al., 2009; Paus, et al., 2009) due to low spatial resolution and low signal-to-noise ratio (SNR).
A comprehensive empirical investigation of the interplay between MRI derived parameters using standardized volume-based methods in the healthy human brain gray matter (GM) and white matter (WM) has not been attempted to-date.
Since T2 relaxation time has been used as a marker of iron accumulation (Haacke et al., 2005; Bartzokis et al., 2007; House et al., 2008; Mitsumori et al., 2009), water content and myelination (Bartzokis et al., 2004; Dyakin et al., 2010) and given the hypothesis that radial diffusivity in white matter is dominantly affected by myelin integrity (Song et al., 2005; Drobyshevsky et al., 2005; Harsan et al., 2008; Ou et al., 2009) we attempted to investigate the interplay between T2 relaxation time and radial diffusivity in WM and GM, cortical and subcortical structures using standardized human brain atlas-based methods. First, we show the inter-regional or spatial heterogeneity relations for all segmented brain regions. Second, we investigate the relation using important benchmark structures such as the anterior and posterior corpus callosum (CC), putamen (PUT), hippocampus (HC), the cortical GM and WM of the motor and sensory lobes, respectively.
Materials and methods
Participants
This work has been approved by the local institutional review board of the University of Texas Health Science Center at Houston and is compliant with the Health Insurance Portability and Accountability Act (HIPAA). Also a written informed consent was obtained from each participant prior to data acquisition. All participants were identified as neurologically normal by review of medical history and were medically stable at the time of the assessments. All scans were read as “normal” by a board certified radiologist. The participants included 89 right-handed healthy adults with 43 males (age range = 18.7–57.6 years; mean age ± SD = 35.9 ± 10.7 years) and 46 females (age range = 19–56.9; mean age ± SD = 37.6 ± 10.0 years).
MRI Data Acquisition
We acquired whole-brain data using a Philips 3.0 T Intera system with a dual quasar gradient system with a maximum gradient amplitude of 80 mT/m, maximum slew rate of 200 mT/m per millisecond and an eight-channel SENSE compatible head coil (Philips Medical Systems, Best, Netherlands).
T1-weighted data
T1-weighted data acquired using 3D spoiled gradient-echo sequence (3D-SPGR) with a field-of-view (FOV) of 240 × 240 mm2 and isotropic voxel size of 0.9375 mm.
T2-weighted data
T2-weighted data acquired using 2D dual spin-echo sequence with TE1/TE2/TR=10/90/5000 ms, in the axial plane (3mm slice thickness, square FOV = 240×240 mm2 at 44 axial sections).
Diffusion-weighted data
The diffusion-weighted data were acquired using a single-shot spin echo diffusion sensitized echo-planar imaging (EPI) sequence with the balanced Icosa21 encoding scheme which uses twenty-one diffusion gradient orientations (Hasan et al., 2001; Hasan and Narayana, 2003), a diffusion sensitization of b=1000 s.mm−2, a repetition and echo times of TR=6.1 s, TE= 84 ms, respectively. EPI image distortion artifacts were reduced by using a SENSE acceleration factor or k-space under sampling of R of two. The slice thickness was 3 mm with 44 axial slices covering the whole-brain (foramen magnum to vertex), FOV =240 × 240 mm2, and an image matrix of 256 × 256 that matched the 3D-SPGR and 2D conventional MRI dual spin-echo sequences described above. The number of non-diffusion weighted or b~0 magnitude image averages was 8; in addition, each encoding was repeated twice and magnitude-averaged to enhance the SNR (Hasan and Narayana, 2003; Hasan, 2006).
Processing
A pictorial flowchart of the computational pipeline for conventional and DTI data processing is illustrated in Fig. 1. The MRI data processing pipeline used in this work is described in more details elsewhere (Walimuni et al., 2011).
Figure 1.
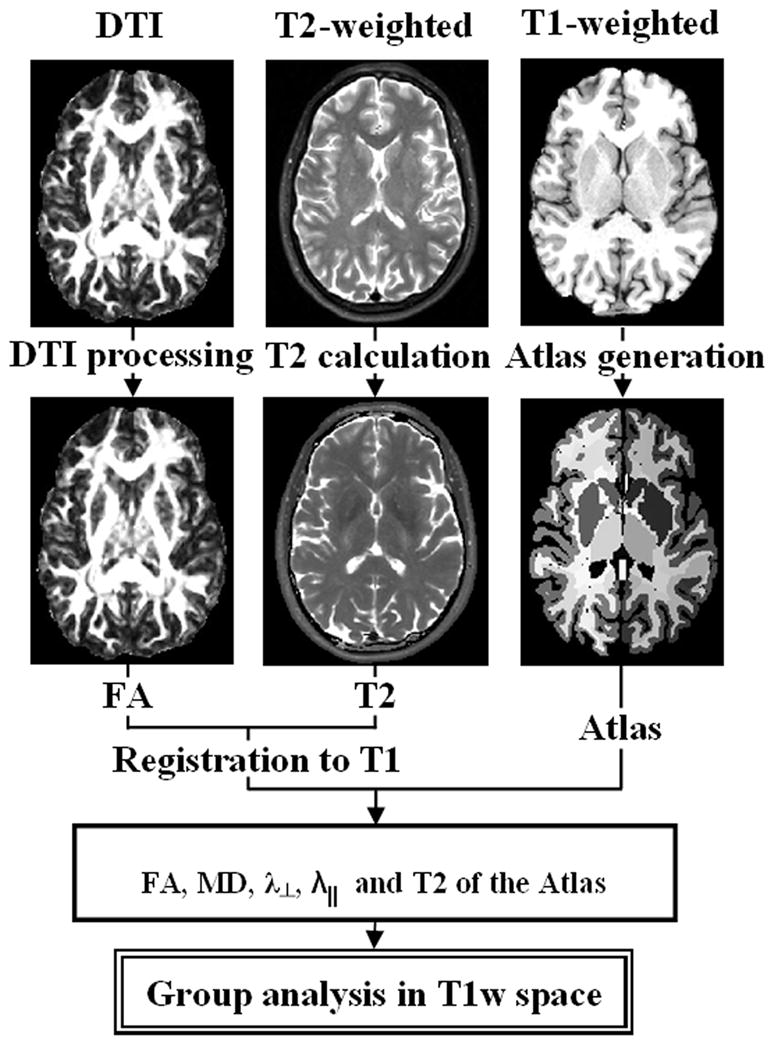
A pictorial flow chart of the processing pipeline adopted in this work. In-house developed software used to process DWI and dual echo data. FreeSurfer and ANTs used for segmentation and registration, respectively.
Segmentation and Parcellation of T1-weighted Data
The T1-weighted brain data were automatically segmented into cortical and sub-cortical regions using FreeSurfer software library (Fischl et al., 2002). We used FreeSurfer in our work as it has been previously validated (Fjell et al., 2008; Jovicich et al., 2009) and has been widely used in normal brain development (Ostby et al., 2009) and aging research (Fjell et al., 2009) and in disease (Sailer et al., 2003; Salat et al., 2009; Ramasamy et al., 2009; Bigler et al., 2010). Using the Cortical and sub-cortical segmentations provided by FreeSurfer (Desikan, et al., 2006), an atlas consisting of 179 white matter (WM), gray matter (GM), and cerebrospinal fluid (CSF) regions was generated for each subject in the T1-weighted native space. A tabulation of the brain anatomical labels (non-CSF) provided by FreeSurfer and used in this work is provided in Table 1 and Supplementary Material.
Table 1.
Classification of brain cortical and lobar parcellations (see Desikan et al., 2006).
| Frontal | Temporal | Parietal | Occipital | Cingulate |
|---|---|---|---|---|
| Middle Frontal Rostral middle frontal Caudal middle frontal |
Entorhinal | Postcentral | Lingual | Rostral anterior division |
| Inferior Frontal Pars opercularis Pars triangularis Pars orbitalis |
Parahippocampal | Supramarginal | Pericalcarine | Caudal anterior division |
| Orbitofrontal Medial orbitofrontal Lateral orbitofrontal |
Temporal pole | Inferior parietal | Cuneus | Posterior cingulate |
| Preccentral | Fusiform | Superior parietal | Lateral occipital | Isthmus cingulate |
| Paracentral Lobule | Superior temporal | Precuneus | Rostral and caudal extents of Corpus Callosum | |
| Superior frontal | Middle temporal | |||
| Frontal pole | Inferior temporal | |||
| Transverse temporal | ||||
| Banks of superior temporal sulcus |
Computation of Relaxation Time from Dual Spin Echo Data
The T2 relaxation times were estimated from the early and late echoes (TE1, TE2) volumes according to standard spin-echo procedures assuming a single compartment model:
| (1) |
where Si is the signal intensity of the ith echo; the T2 relaxation time is obtained as (Hasan et al., 2008a; Aubert-Broche et al., 2009):
| (2) |
Diffusion-weighted Data and DTI Metrics
Diffusion-weighted volumes were intra-registered to the baseline “b0” image (the volume without diffusion sensitization) to correct for eddy-current image distortions using the Philips PRIDE workstation (Philips Medical Systems). Subsequently, all DWI volumes were masked using brain extraction tool (BET) in order to remove non brain regions (Smith, 2002). The DWI data were decoded and the tensors were diagonalized to obtain the three eigenvalues. The eigenvalues were subsequently used to compute FA, mean, axial and radial diffusivities (Hasan and Narayana 2006). A detailed description of the DTI data processing pipeline is provided elsewhere (Hasan, 2006; Hasan et al., 2011).
Fusion of T2 Relaxation Time and DTI Metrics in T1-weighted or Atlas space
The DTI-derived and T2 relaxation time volumes were registered to the T1-weighted data space using advanced normalization tools (ANTs) with symmetric normalization (Avants et al., 2008; Klein et al., 2009). The ANTs tool has also been independently tested and compared against 14 different non-linear registration programs (Klein et al., 2009). This registration tool has been reported to provide the highest Dice overlap according to our previous evaluations (Walimuni et al., 2011). Fractional anisotropy and T2-weighted volumes were chosen as objects for the registration and the corresponding transformations were applied to the radial diffusivity and T2 maps, respectively. A detailed description of the methods used in the registration is presented previously (Walimuni et al., 2011). Since the T1-weighted volume and the brain atlas are in the same space, the atlas was used as a look-up table to locate chosen brain structures from all the other image modalities registered to the T1-weighted space.
Statistical analysis
Regional group comparisons were conducted using analysis-of-variance (ANOVA) methods. All analyses of global and regional atlas-based T2 variation and λ⊥ were conducted using a generalized linear model. The correlations between T2 and λ⊥ of grouped and inter-regional structures were computed using the Pearson correlation coefficient (Zou et al., 2003). All statistical analyses were conducted MATLAB R12.1 Statistical Toolbox v 3.0 (The Mathworks, Natick, MA).
Results
The healthy men and women in our cohort did not differ in age (p = 0.43). Given previous reports of insignificant gender-based differences in brain volumetry (Fjell et al., 2009) and to simplify the analyses we averaged microstructural brain data obtained from age-matched men and women used in this study.
Normal Human Brain Microstructural Spatial Heterogeneity
Figure 2 illustrates the utility of the multimodal quantitative MRI methods adopted in this work and applied to the human brain using FreeSurfer anatomical atlas labels of deep and cortical gray and white matter (Desikan et al., 2006). The spatial heterogeneity of fractional anisotropy, mean diffusivity and axial diffusivity are shown Fig. 2A, 2B and 2C, respectively. The radial diffusivity, T2 relaxation time and their corresponding intra-regional Pearson correlation coefficient maps are shown in Fig. 3A, 2B and 3C, respectively. Note the expected trend that FA values in white matter are greater than the average values in gray matter (Pierpaoli et al., 1996). The cortical gray matter FA values are generally smaller than the values in deep gray matter (Fig. 2A). The average radial diffusivity values are smaller in white matter structures than in gray matter (Fig. 3A). The T2 values in cortical gray matter are larger than T2 values in deep gray matter. (Fig. 3B). The T2 relaxation time is smallest in iron-rich structures such as the globus pallidus and putamen. The T2 relaxation time is generally smaller in white matter than in gray matter (Fig. 3B). Note that the posterior corpus callosum has the largest FA, largest axial diffusivity and smallest radial diffusivity of any other structure in the human brain. The mean T2 relaxation time in the anterior CC is smaller than that in the posterior CC. The regional microstructural heterogeneity of the human brain white matter is clearly exemplified by the trends exhibited by the corpus callosum (see regional quantitative analyses below).
Figure 2.

Visual illustration of FreeSurfer brain atlas-based spatial heterogeneity of (A) fractional anisotropy, (B) mean diffusivity, and (C) axial diffusivity. The entire group average values along with the corresponding colorbar are shown in MNI space.
Figure 3.

Visual illustration of FreeSurfer brain atlas-based spatial heterogeneity of (A) radial diffusivity, (B) T2 relaxation time, and (C) the intra-regional Pearson correlation coefficient of T2 and radial diffusivity (p < 0.1).
Interregional Heterogeneity of Normal Human Brain Tissue
The scatter of mean T2 relaxation time and radial diffusivity values for all bilateral 82 segmented brain regions (Fig. 3C) is shown in Fig. 4 (see Table 1 and Supplementary Material). When all WM and all GM are grouped separately for the entire cohort, significant correlations between T2 and radial diffusivity were observed for GM (r = 0.543; p = 0.0003) and WM (r = 0.493; p = 0.0011).
Figure 4.

Atlas-based and volume averaged inter-regional scatter of radial diffusivity and corresponding T2 relaxation time for the 82 GM and WM structures (see Table 1 and Supplementary Material). Each point corresponds to group average over the entire cohort.
Intra-regional Dependence of T2 and Radial Diffusivity
We explored the intra-regional dependence of T2 and radial diffusivity using the entire cohort on selected brain structures (see Fig. 3C). Fig. 5 shows a scatter plot and corresponding linear regression analyses of T2 relaxation time vs. λ⊥ for the anterior corpus callosum (CC) and posterior CC (Fig. 5A), the left hippocampus compared with left putamen (Fig. 45), left precentral GM (motor cortex) compared with left postcentral GM (sensory cortex), and left precentral WM (Fig. 5C) compared with left postcentral WM (Fig. 5D). Note that the average T2 values of anterior (genu) CC were smaller than the average values in the posterior (splenium) CC (p < 0.0001), the T2 values in the left hippocampus were much larger than the left putamen (p< 0.000001), the T2 values in motor cortex were not significantly different from those in the sensory cortex (p ~ 0.12), and the T2 mean values of left motor WM was larger than left sensory WM (p = 0.00001). The average radial diffusivity of the posterior CC was much larger than the anterior CC (p ~ 0.000000004), the average radial diffusivity of the hippocampus was much larger than the left putamen (p < 0000001).
Figure 5.

Intra-regional comparison of interplay between radial diffusivity and the T2 relaxation time for (A) anterior corpus callosum compared with posterior corpus callosum, (B) left hippocampus compared with left putamen, (C) left precentral GM compared with left postcentral GM, and (D) left precentral WM compared with left postcentral WM (see Figure 3C for the correlation coefficient map)
The scatter plots in Fig. 5 show also the Pearson correlation coefficient and its significance between T2 relaxation and for the anterior CC (r = 0.348; p < 0.001), posterior λ⊥ CC (r = 0.25; p = 0.018) left hippocampus (r = 0.475; p = 0.0000026), left putamen (r=0.188; p = 0.077), left motor cortex (r = 0.279; p = 0.008), left sensory cortex (r = 0.249; p = 0.019), left motor WM (r = −0.116; p = 0.277) and left sensory WM (r = −0.143; p = 181). Note that the strongest correlation between T2 relaxation time and radial diffusivity is observed in the hippocampus (Fig 3C; Fig. 5B).
Discussion
To the best of our knowledge, this is the first human brain atlas-based report on the spatial heterogeneity and interplay between T2 relaxation and radial diffusivity on a large cohort of healthy adults. We presented qMRI maps of the subcortical, cortical gray matter, deep and lobar white matter. The average normative FA, axial, radial and mean diffusivity values in both gray matter and white matter are generally consistent with published reports on healthy adults (Pierpaoli et al., 1996).
In this work we investigated the interplay between T2 relaxation time and as these λ⊥ indices are affected by the water spin environment (Beaulieu et al., 1998). The T2 relaxation time measured using spin-echo methods is speculated to be dependent on tissue microstructural composition such as water content, myelin (Whittall et al., 1997; Dyakin et al., 2010; Bartzokis et al., 2010) and iron deposition (Haacke et al., 2005; Hikita et al., 2005; Jara et al., 2006; Bartozkis et al., 2007), whereas radial diffusivity has been hypothesized to be a sensitive marker of myelination (Beaulieu et al., 2002; Drobyshevsky et al., 2005; Song et al., 2005).
In accordance with previous reports we found significant region-dependent variations in transverse T2 relaxation (Whittall et al., 1997; Georgiades et al., 2001; Bartzokis et al., 2004; Aubert-Broche et al., 2009; Hasan et al., 2010a) and DTI metrics (Pierpaoli et al., 1996; Lebel et al., 2008; Hasan et al., 2010b) in both GM and WM. Our qMRI findings (e.g. caudate vs. putamen; anterior vs. posterior; motor vs. sensory) may generally reflect region-dependent water and iron content (Hallgren and Sourander, 1958) in addition to myelination (Lebel et al., 2008; Hasan et al., 2010b).
In this work we sought to explore the interplay between radial diffusivity and T2 relaxation time as these metrics relate to physical variables. In two separate studies using a mouse model of dysmyelination the radial diffusivity (Song al., 2005) and T2 relaxation time (Dyakin et al., 2010) measurements of the corpus callosum were related to myelination. For correlation testing we assumed that the radial and axial diffusivities (Beaulieu et al., 2002) are independent, but some confounding effects due to fiber orientation have been reported recently (Wheeler-Kingshott and Cercignani, 2009). In this report we considered the radial diffusivity as a marker of inter-axonal and extracellular environment integrity (Song et al., 2005; Ou et al., 2009). The axial diffusivity may be affected by the intra-cellular or intra-axonal cytoskeletal microstructure (Kinoshita et al., 1999; Beaulieu, 2002) in addition to intra-voxel tortuosuity (Takahashi et al., 2000; Le Bihan et al., 2001).
For correlation testing we did not adjust for regional volumetry as tissue macrostructure and microstructural integrity are not expected to be generally unrelated (Fjell et al., 2008). Both tissue quantity (macrostructure) and quality (microstructure) depended on age and the age trends were used for quality assurance; the intra-regional qMRI correlations in this work did not alter when age was covaried. We also did not examine the interplay between T2 relaxation time and other metrics such as mean diffusivity and FA. Mean diffusivity is a superposition of radial and axial diffusivities (e.g. MD = (2*Radial Diffusivity + Axial Diffusivity)/3)) and FA is a function of the standard deviation of the tensor eigenvalues divided by MD that can be expressed as a ratio of axial and radial diffusivities (Hasan and Narayana 2003; Hasan and Narayana, 2006). A commensurate alteration in both axial and radial diffusivities would not be captured by FA (Mukherjee et al., 2002; Bar-Shir et al., 2009).
Consistent with previous reports using T2 relaxometry (Whittall et al., 1997) and DTI (Hasan et al., 2008b; Lebel et al., 2008; Hasan et al., 2009b; Lebel et al., 2010), our results on the anterior and posterior CC (Fig. 3A) show a significant heterogeneity between the anterior and posterior sectors of the corpus callosum. This observation may be attributed to axonal caliber, axonal orientation, axonal packing and myelin distribution. Our data show that in the anterior λ⊥ CC is significantly larger than that in posterior CC predicting that the anterior CC is populated with lightly-myelinated fibers compared to the posterior CC. This finding is consistent with histopathological data on the human CC (Aboitiz et al., 1992) and in vivo measurements using myelin water volume mapping methods (Whittall et al., 1997; Laule et al., 2004).
Consistent with previous reports on the regional heterogeneity of the corpus callosum using T2 relaxation time measurements (Whittall et al., 1997; Bartzokis et al., 2004; Kim et al., 2007; Levesque et al., 2010), our data indicate that T2 relaxation time values of the anterior CC are significantly smaller than that of the posterior CC (Fig. 3A). In view of the DTI findings discussed above, this is an unexpected result as the posterior CC contains more myelin than the frontal CC (Aboitiz et al., 1992). This paradoxical result indicates that other biophysical factors in addition to myelin may contribute to the measured T2 relaxation time. Potential contributors to T2 relaxation time measurements in unmyelinated axons may include axonal packing and fiber orientation (Denk et al., 2011). Published normative magnetization transfer ratio (Vavasour et al., 1998) is also paradoxically greater in the less-meyelinated genu of CC compared to the splenium. These observations indicate that axonal membranes or adjacent macromolecular layer (Beaulieu et al., 1998; Sled et al., 2004) with short relaxation time may contribute to the reduced relaxation time in the more packed callosal genu via fast exchange mechanisms (Minty et al., 2009, Dula et al., 2010). A relatively larger iron content in the frontal CC than the posterior CC would offer another plausible explanation to the finding on the CC. To the best of our knowledge, there has been no comprehensive histopathological report (Yao et al., 2009) on the iron content of the different subdivisions of the human corpus callosum. Moreover, a recent study did not report strong association between iron content and relaxation rate in compact white matter (Li et al., 2009). Higher iron content in the genu of the CC compared to the splenium CC has been extrapolated by Bartzokis et al. (2007) using the postmortem data in Hallgren and Sourander (1958).
Our finding of strong correlation between hippocampal T2 and radial diffusivity may be related to higher water content and reduced iron in this region (see Haacke et al., 2005). A reduction in obstacles or barriers to random translational diffusion as a result reduced myelin or increased water content in the extracellular space would increase the diffusion rate and hence would allow water spins to average out the local magnetic field gradients and hence increase the relaxation time (Weisskoff et al., 2004). If water spins experience such scenario then a strong relation between T2 relaxation and diffusivity may be postulated on theoretical grounds (Baratti et al., 1999; Jara et al., 2006).
Despite the use of validated tissue segmentation (Fischl et al., 2010) and advanced multimodal MRI registration methods (Klein et al., 2009), our study has some limitations. Our normative data were collected to help interpret data collected from patients and our whole brain MRI data acquisition protocol was limited to ~ 30 minutes. Due to scan time considerations, the DTI data were acquired using echo-planar imaging with intrinsic voxel size of ~ 2mm × 2mm × 3mm, while the dual spin echo spatial resolution was ~ 1 mm × 1 mm × 3 mm. The DTI-derived and T2 relaxation time maps were registered to the T1-weighted map with spatial resolution of ~ 1mm × 1mm × 1mm. Therefore, partial volume averaging of CSF with brain parenchyma may have affected the estimated metrics in some regions. Our data quality assurance tests (Walimuni et al., 2011), visual inspection and quantitative analyses on the deep and cortical (e.g. volumetry vs. age) indicate minimal contamination with CSF. In this work we adopted a single compartment model for both DTI and relaxation time measurements in both gray and white matter. More sophisticated models for white matter have been proposed (Lancaster et al., 2003). We have ignored the possible contribution from short-lived compartments such as water trapped in myelin (Madler et al., 2008; Mackay et al., 2009) or the fast-exchanging water layer adjacent to cellular or axonal membranes (Sled et al., 2004). Optimized three-dimensional high resolution multi-echo relaxometry and myelin mapping methods may provide more specific metrics to model these compartments (Deoni et al., 2011). Due to the lack of histological data, we could not relate our DTI and relaxometry measurements in gray matter to neuronal size or to iron content directly. Our DTI and relaxation time measurements in white matter could not be related to myelin or axonal size distribution, axonal packing and axonal cytoskelatal microstructure (Pierpaoli et al., 1996; Paus et al., 2010). Recent attempts to relate diffusion metrics in white matter to axonal size are promising (Assaf et al., 2008; Barazany et al., 2009; Alexander et al., 2010).
Additional histopathological and in situ standardized quantitative MRI measurements of key human brain structures such as amgydala, hippocampus, motor and sensory cortices, anterior and posterior CC are needed to help isolate or model the in vivo contributors to MRI microstructural metrics (Beaulieu, 2002). In this work we used a large cohort of right-handed healthy controls with a wide age range, but we did not examine the interaction with age, gender and side. A future extension of this work will use a larger healthy cohort and will stratify the population by age and gender to examine more thoroughly the interplay between qMRI metrics and side. In conclusion, our results underscore the utility of using standardized multimodal and atlas-based approaches and the need for additional statistical models to understand the yet unresolved biophysical contributors to MRI signal.
Supplementary Material
Acknowledgments
This work is funded by NIH-NINDS Grant R01 NS052505-04 and the Dunn Foundation. We wish to thank Vipul Kumar Patel for helping in data acquisition.
Footnotes
Presented Recently:
Walimuni IS, Hasan KM. Brain Atlas-based Study of the Interplay between Normal Tissue Microstructural MRI Parameters. 19th Annual Meeting and Exhibition of International Society for Magnetic Resonance in Medicine 7–13 May 2011, Montréal, Québec, Canada; #4017.
Publisher's Disclaimer: This is a PDF file of an unedited manuscript that has been accepted for publication. As a service to our customers we are providing this early version of the manuscript. The manuscript will undergo copyediting, typesetting, and review of the resulting proof before it is published in its final citable form. Please note that during the production process errors may be discovered which could affect the content, and all legal disclaimers that apply to the journal pertain.
References
- 1.Aboitiz F, Scheibel AB, Fisher RS, Zaidel E. Fiber composition of the human corpus callosum. Brain Res. 1992;598:143–153. doi: 10.1016/0006-8993(92)90178-c. [DOI] [PubMed] [Google Scholar]
- 2.Alexander DC, Hubbard PL, Hall MG, Moore EA, Ptito M, Parker GJ, Dyrby TB. Orientationally invariant indices of axon diameter and density from diffusion MRI. Neuroimage. 2010;52:1374–1389. doi: 10.1016/j.neuroimage.2010.05.043. [DOI] [PubMed] [Google Scholar]
- 3.Assaf Y, Blumenfeld-Katzir T, Yovel Y, Basser PJ. AxCaliber: a method for measuring axon diameter distribution from diffusion MRI. Magn Reson Med. 2008;59:1347–54. doi: 10.1002/mrm.21577. [DOI] [PMC free article] [PubMed] [Google Scholar]
- 4.Aubert-Broche B, Grova C, Pike GB, Collins DL. Clustering of atlas-defined cortical regions based on relaxation times and proton density. NeuroImage. 2009;47:523–532. doi: 10.1016/j.neuroimage.2009.04.079. [DOI] [PubMed] [Google Scholar]
- 5.Avants BB, Epstein CL, Grossman M, Gee JC. Symmetric diffeomorphic image registration with cross-correlation: evaluating automated labeling of elderly and neurodegenerative brain. Medical Image Analysis. 2008;12:26–41. doi: 10.1016/j.media.2007.06.004. [DOI] [PMC free article] [PubMed] [Google Scholar]
- 6.Bar-Shir A, Duncan ID, Cohen Y. QSI and DTI of excised brains of the myelin-deficient rat. Neuroimage. 2009;48:109–116. doi: 10.1016/j.neuroimage.2009.06.019. [DOI] [PubMed] [Google Scholar]
- 7.Baratti C, Barnett AS, Pierpaoli C. Comparative MR imaging study of brain maturation in kittens with T1, T2, and the trace of the diffusion tensor. Radiology. 1999;210:133–142. doi: 10.1148/radiology.210.1.r99ja09133. [DOI] [PubMed] [Google Scholar]
- 8.Barazany D, Basser PJ, Assaf Y. In vivo measurement of axon diameter distribution in the corpus callosum of rat brain. Brain. 2009;132:1210–1220. doi: 10.1093/brain/awp042. [DOI] [PMC free article] [PubMed] [Google Scholar]
- 9.Bartzokis G, Sultzer D, Lu PH, Nuechterlein KH, Mintz J, Cummings JL. Heterogeneous age-related breakdown of white matter structural integrity: implications for cortical “disconnection” in aging and Alzheimer’s disease. Neurobiol Aging. 2004;25:843–851. doi: 10.1016/j.neurobiolaging.2003.09.005. [DOI] [PubMed] [Google Scholar]
- 10.Bartzokis G, Tishler TA, Lu PH, Villablanca P, Altshuler LL, Carter M, Huang D, Edwards N, Mintz J. Brain ferritin iron may influence age- and gender-related risks of neurodegeneration. Neurobiol Aging. 2007;28:414–423. doi: 10.1016/j.neurobiolaging.2006.02.005. [DOI] [PubMed] [Google Scholar]
- 11.Bartzokis G, Lu PH, Tingus K, Mendez MF, Richard A, Peters DG, Oluwadara B, Barrall KA, Finn JP, Villablanca P, Thompson PM, Mintz J. Lifespan trajectory of myelin integrity and maximum motor speed. Neurobiology of Aging. 2010;31:1554–1562. doi: 10.1016/j.neurobiolaging.2008.08.015. [DOI] [PMC free article] [PubMed] [Google Scholar]
- 12.Basser PJ. New histological and physiological stains derived from diffusion-tensor MR images. Ann N Y Acad Sci. 1997;820:123–38. doi: 10.1111/j.1749-6632.1997.tb46192.x. Review. [DOI] [PubMed] [Google Scholar]
- 13.Beaulieu C, Fenrich FR, Allen PS. Multicomponent water proton transverse relaxation and T2-discriminated water diffusion in myelinated and nonmyelinated nerve. Magn Reson Imaging. 1998;16:1201–1210. doi: 10.1016/s0730-725x(98)00151-9. [DOI] [PubMed] [Google Scholar]
- 14.Beaulieu C. The basis of anisotropic water diffusion in the nervous system. NMR Biomed. 2002;15:435–455. doi: 10.1002/nbm.782. [DOI] [PubMed] [Google Scholar]
- 15.Bigler ED, Abildskov TJ, Wilde EA, McCauley SR, Li X, Merkley TL, Fearing MA, Newsome MR, Scheibel RS, Hunter JV, Chu Z, Levin HS. Diffuse damage in pediatric traumatic brain injury: a comparison of automated versus operator-controlled quantification methods. Neuroimage. 2010;50:1017–1026. doi: 10.1016/j.neuroimage.2010.01.003. [DOI] [PubMed] [Google Scholar]
- 16.Cherubini A, Péran P, Caltagirone C, Sabatini U, Spalletta G. Aging of subcortical nuclei: microstructural, mineralization and atrophy modifications measured in vivo using MRI. NeuroImage. 2009;48:29–36. doi: 10.1016/j.neuroimage.2009.06.035. [DOI] [PubMed] [Google Scholar]
- 17.Cherubini A, Péran P, Hagberg GE, Varsi AE, Luccichenti G, Caltagirone C, Sabatini U, Spalletta G. Characterization of white matter fiber bundles with T*2 relaxometry and diffusion tensor imaging. Magn Reson Med. 2009;61:1066–1072. doi: 10.1002/mrm.21978. [DOI] [PubMed] [Google Scholar]
- 18.Denk C, Torres EH, Mackay A, Rauscher A. The influence of white matter fibre orientation on MR signal phase and decay. NMR Biomed. 2011;24:246–252. doi: 10.1002/nbm.1581. [DOI] [PubMed] [Google Scholar]
- 19.Deoni SC, Mercure E, Blasi A, Gasston D, Thomson A, Johnson M, Williams SC, Murphy DG. Mapping infant brain myelination with magnetic resonance imaging. J Neurosci. 2011;31:784–91. doi: 10.1523/JNEUROSCI.2106-10.2011. [DOI] [PMC free article] [PubMed] [Google Scholar]
- 20.Desikan RS, Ségonnec F, Fischl B, Quinn BT, Dickerson BC, Blacker D, Bucknerb RL, Dale AM, Maguire RP, Hyman BT, Albert MS, Killiany RJ. An automated labeling system for subdividing the human cerebral cortex on MRI scans into gyral based regions of interest. NeuroImage. 2006;31:968–980. doi: 10.1016/j.neuroimage.2006.01.021. [DOI] [PubMed] [Google Scholar]
- 21.Drobyshevsky A, Song SK, Gamkrelidze G, Wyrwicz AM, Derrick M, Meng F, Li L, Ji X, Trommer B, Beardsley DJ, Luo NL, Back SA, Tan S. Developmental changes in diffusion anisotropy coincide with immature oligodendrocyte progression and maturation of compound action potential. J Neurosci. 2005;25:5988–5997. doi: 10.1523/JNEUROSCI.4983-04.2005. [DOI] [PMC free article] [PubMed] [Google Scholar]
- 22.Dula AN, Gochberg DF, Valentine HL, Valentine WM, Does MD. Multiexponential T2, magnetization transfer, and quantitative histology in white matter tracts of rat spinal cord. Magn Reson Med. 2010;63:902–909. doi: 10.1002/mrm.22267. [DOI] [PMC free article] [PubMed] [Google Scholar]
- 23.Dyakin VV, Chen Y, Branch CA, Veeranna, Yuan A, Rao M, Kumar A, Peterhoff CM, Nixon RA. The contributions of myelin and axonal caliber to transverse relaxation time in shiverer and neurofilament-deficient mouse models. Neuroimage. 2010;51:1098–1105. doi: 10.1016/j.neuroimage.2010.03.013. [DOI] [PMC free article] [PubMed] [Google Scholar]
- 24.Fischl B, Salat DH, Evelina Busa E, Albert M, Dieterich M, Haselgrove C, Van der Kouwe A, Killiany R, Kennedy D, Klaveness S, Montillo A, Makris N, Rosen B, Dale AM. Whole brain segmentation: automated labeling of neuroanatomical structures in the human brain. Neuron. 2002;33:341–355. doi: 10.1016/s0896-6273(02)00569-x. [DOI] [PubMed] [Google Scholar]
- 25.Fjell AM, Westlye LT, Greve DN, Fischl B, Benner T, van der Kouwe AJ, Salat D, Bjørnerud A, Due-Tønnessen P, Walhovd KB. The relationship between diffusion tensor imaging and volumetry as measures of white matter properties. Neuroimage. 2008;42:1654–1668. doi: 10.1016/j.neuroimage.2008.06.005. [DOI] [PMC free article] [PubMed] [Google Scholar]
- 26.Fjell AM, Westlye LT, Amlien I, Espeseth T, Reinvang I, Raz N, Agartz I, Salat DH, Greve DN, Fischl B, Dale AM, Walhovd KB. Minute effects of sex on the aging brain: a multisample magnetic resonance imaging study of healthy aging and Alzheimer’s disease. J Neurosci. 2009;29:8774–8783. doi: 10.1523/JNEUROSCI.0115-09.2009. [DOI] [PMC free article] [PubMed] [Google Scholar]
- 27.Georgiades CS, Itoh R, Golay X, van Zijl PC, Melhem ER. MR imaging of the human brain at 1.5 T: regional variations in transverse relaxation rates in the cerebral cortex. Am J Neuroradiol. 2001;22:1732–1737. [PMC free article] [PubMed] [Google Scholar]
- 28.Haacke EM, Cheng NY, House MJ, Liu Q, Neelavalli J, Ogg RJ, Khan A, Ayaz M, Kirsch W, Obenaus A. Imaging iron stores in the brain using magnetic resonance imaging. Magn Reson Imaging. 2005;23:1–25. doi: 10.1016/j.mri.2004.10.001. [DOI] [PubMed] [Google Scholar]
- 29.Hallgren B, Sourander P. The effect of age on the non-haemin iron in the human brain. J Neurochem. 1958;3:41–51. doi: 10.1111/j.1471-4159.1958.tb12607.x. [DOI] [PubMed] [Google Scholar]
- 30.Harsan LA, Steibel J, Zaremba A, Agin A, Sapin R, Poulet P, Guignard B, Parizel N, Grucker D, Boehm N, Miller RH, Ghandour MS. Recovery from chronic demyelination by thyroid hormone therapy: myelinogenesis induction and assessment by diffusion tensor magnetic resonance imaging. J Neurosci. 2008;28:14189–14201. doi: 10.1523/JNEUROSCI.4453-08.2008. [DOI] [PMC free article] [PubMed] [Google Scholar]
- 31.Hasan KM, Parker DL, Alexander AL. Comparison of gradient encoding schemes for diffusion-tensor MRI. J Magn Reson Imaging. 2001;13:769–780. doi: 10.1002/jmri.1107. [DOI] [PubMed] [Google Scholar]
- 32.Hasan KM, Narayana PA. Computation of the fractional anisotropy and mean diffusivity maps without tensor decoding and diagonalization: theoretical analysis and validation. Magn Reson Med. 2003;50:589–598. doi: 10.1002/mrm.10552. [DOI] [PubMed] [Google Scholar]
- 33.Hasan KM, Narayana PA. Retrospective measurement of the diffusion tensor eigenvalues from diffusion anisotropy and mean diffusivity in DTI. Magn Reson Med. 2006;56:130–137. doi: 10.1002/mrm.20935. [DOI] [PubMed] [Google Scholar]
- 34.Hasan KM. Fundamentals of diffusion tensor imaging of the entire human brain: review of basic theory, data acquisition, processing and potential applications at 1.5 T and 3.0 T. In: Chen FJ, editor. Progress in Brain Mapping Research. Chapter 1. Nova Science Publishers Inc; Hauppauge, NY: 2006. pp. 1–80. [Google Scholar]
- 35.Hasan KM, Halphen C, Boska MD, Narayana PA. Diffusion tensor metrics, T2 relaxation, and volumetry of the naturally aging human caudate nuclei in healthy young and middle-aged adults: possible implications for the neurobiology of human brain aging and disease. Magn Reson Med. 2008a;59:7–13. doi: 10.1002/mrm.21434. [DOI] [PubMed] [Google Scholar]
- 36.Hasan KM, Kamali A, Kramer LA, Papnicolaou AC, Fletcher JM, Ewing-Cobbs L. Diffusion tensor quantification of the human midsagittal corpus callosum subdivisions across the lifespan. Brain Res. 2008b;1227:52–67. doi: 10.1016/j.brainres.2008.06.030. [DOI] [PMC free article] [PubMed] [Google Scholar]
- 37.Hasan KM, Halphen C, Kamali A, Nelson FM, Wolinsky JS, Narayana PA. Caudate Nuclei Volume, Diffusion Tensor Metrics, and T2 Relaxation in Healthy Adults and Relapsing-Remitting Multiple Sclerosis Patients: Implications to Understanding Gray Matter Degeneration. J Magn Reson Imaging. 2009a;29:70–77. doi: 10.1002/jmri.21648. [DOI] [PMC free article] [PubMed] [Google Scholar]
- 38.Hasan KM, Kamali A, Iftikhar A, Kramer LA, Papanicolaou AC, Fletcher JM, Ewing-Cobbs L. Diffusion tensor tractography quantification of the human corpus callosum fiber pathways across the lifespan. Brain Res. 2009b;1249:91–100. doi: 10.1016/j.brainres.2008.10.026. [DOI] [PMC free article] [PubMed] [Google Scholar]
- 39.Hasan KM, Kamali A, Abid H, Kramer LA, Fletcher JM, Ewing-Cobbs L. Quantification of the spatiotemporal microstructural organization of the human brain association, projection and commissural pathways across the lifespan using diffusion tensor tractography. Brain Struct Funct. 2010a;214:361–73. doi: 10.1007/s00429-009-0238-0. [DOI] [PMC free article] [PubMed] [Google Scholar]
- 40.Hasan KM, Walimuni IS, Kramer LA, Frye RE. Human brain atlas-based volumetry and relaxometry: application to healthy development and natural aging. Magn Reson Med. 2010b;64:1382–9. doi: 10.1002/mrm.22515. [DOI] [PubMed] [Google Scholar]
- 41.Hasan KM, Walimuni IS, Abid H, Hahn KR. A review of diffusion tensor magnetic resonance imaging computational methods and software tools. Comput Biol Med. 2011 doi: 10.1016/j.compbiomed.2010.10.008. [DOI] [PMC free article] [PubMed] [Google Scholar]
- 42.Hikita T, Abe K, Sakoda S, Tanaka H, Murase K, Fujita N. Determination of transverse relaxation rate for estimating iron deposits in central nervous system. Neurosci Res. 2005;51:67–71. doi: 10.1016/j.neures.2004.09.006. [DOI] [PubMed] [Google Scholar]
- 43.House MJ, St Pierre TG, McLean C. 1.4T study of proton magnetic relaxation rates, iron concentrations, and plaque burden in Alzheimer’s disease and control postmortem brain tissue. Magn Reson Med. 2008;60:41–52. doi: 10.1002/mrm.21586. [DOI] [PubMed] [Google Scholar]
- 44.Jara H, Sakai O, Mankal P, Irving RP, Norbash AM. Multispectral quantitative magnetic resonance imaging of brain iron stores: a theoretical perspective. Top Magn Reson Imaging. 2006;17:19–30. doi: 10.1097/01.rmr.0000245460.82782.69. Review. [DOI] [PubMed] [Google Scholar]
- 45.Jovicich J, Czanner S, Han X, Salat D, van der Kouwe A, Quinn B, Pacheco J, Albert M, Killiany R, Blacker D, Maguire P, Rosas D, Makris N, Gollub R, Dale A, Dickerson BC, Fischl B. MRI-derived measurements of human subcortical, ventricular and intracranial brain volumes: Reliability effects of scan sessions, acquisition sequences, data analyses, scanner upgrade, scanner vendors and field strengths. Neuroimage. 2009;46:177–192. doi: 10.1016/j.neuroimage.2009.02.010. [DOI] [PMC free article] [PubMed] [Google Scholar]
- 46.Kim EY, Kim DH, Yoo E, Park HJ, Golay X, Lee SK, Kim DJ, Kim J, Kim DI. Visualization of maturation of the corpus callosum during childhood and adolescence using T2 relaxometry. Int J Dev Neurosci. 2007;25:409–414. doi: 10.1016/j.ijdevneu.2007.05.005. [DOI] [PubMed] [Google Scholar]
- 47.Kinoshita Y, Ohnishi A, Kohshi K, Yokota A. Apparent diffusion coefficient on rat brain and nerves intoxicated with methylmercury. Environ Res. 1999;80:348–354. doi: 10.1006/enrs.1998.3935. [DOI] [PubMed] [Google Scholar]
- 48.Klein A, Andersson J, Ardekani BA, Ashburner J, Avants B, Chiang M, Christensen GE, Collins DL, Gee J, Hellier P, Song JH, Jenkinson M, Lepage C, Rueckert D, Thompson P, Vercauteren T, Woods RP, Mann JJ, Parsey RV. Evaluation of 14 nonlinear deformation algorithms applied to human brain MRI registration. NeuroImage. 2009;46:786–802. doi: 10.1016/j.neuroimage.2008.12.037. [DOI] [PMC free article] [PubMed] [Google Scholar]
- 49.Lancaster JL, Andrews T, Hardies LJ, Dodd S, Fox PT. Three-pool model of white matter. J Magn Reson Imaging. 2003;17:1–10. doi: 10.1002/jmri.10230. [DOI] [PubMed] [Google Scholar]
- 50.Laule C, Vavasour IM, Moore GR, Oger J, Li DK, Paty DW, MacKay AL. Water content and myelin water fraction in multiple sclerosis. A T2 relaxation study. J Neurol. 2004;251:284–293. doi: 10.1007/s00415-004-0306-6. [DOI] [PubMed] [Google Scholar]
- 51.Lebel C, Walker L, Leemans A, Phillips L, Beaulieu C. Microstructural maturation of the human brain from childhood to adulthood. Neuroimage. 2008;40:1044–55. doi: 10.1016/j.neuroimage.2007.12.053. [DOI] [PubMed] [Google Scholar]
- 52.Lebel C, Caverhill-Godkewitsch S, Beaulieu C. Age-related regional variations of the corpus callosum identified by diffusion tensor tractography. Neuroimage. 2010;52:20–31. doi: 10.1016/j.neuroimage.2010.03.072. [DOI] [PubMed] [Google Scholar]
- 53.Larsson HBW, Thomsen C, Frederiksen J, Stubgaard M, Henriksen O. In vivo magnetic resonance diffusion measurement in the brain of patients with multiple sclerosis. Magn Reson Imaging. 1992;10:7–12. doi: 10.1016/0730-725x(92)90367-9. [DOI] [PubMed] [Google Scholar]
- 54.Levesque IR, Chia CL, Pike GB. Reproducibility of in vivo magnetic resonance imaging-based measurement of myelin water. J Magn Reson Imaging. 2010;32:60–68. doi: 10.1002/jmri.22170. [DOI] [PubMed] [Google Scholar]
- 55.Li TQ, Yao B, van Gelderen P, Merkle H, Dodd S, Talagala L, Koretsky AP, Duyn J. Characterization of T(2)* heterogeneity in human brain white matter. Magn Reson Med. 2009;62:1652–1657. doi: 10.1002/mrm.22156. [DOI] [PMC free article] [PubMed] [Google Scholar]
- 56.MacKay A, Laule C, Vavasour I, Bjarnason T, Kolind S, Mädler B. Insights into brain microstructure from the T2 distribution. Magn Reson Imaging. 2006;24:515–525. doi: 10.1016/j.mri.2005.12.037. [DOI] [PubMed] [Google Scholar]
- 57.MacKay AL, Vavasour IM, Rauscher A, Kolind SH, Madler B, Moore GR, Traboulsee AL, Li DK, Laule C. MR relaxation in multiple sclerosis. Neuroimaging Clin N Am. 2009;19:1–26. doi: 10.1016/j.nic.2008.09.007. [DOI] [PubMed] [Google Scholar]
- 58.Mädler B, Drabycz SA, Kolind SH, Whittall KP, MacKay AL. Is diffusion anisotropy an accurate monitor of myelination? Correlation of multicomponent T2 relaxation and diffusion tensor anisotropy in human brain. Magn Reson Imaging. 2008;26:874–888. doi: 10.1016/j.mri.2008.01.047. [DOI] [PubMed] [Google Scholar]
- 59.Mitsumori F, Watanabe H, Takaya N. Estimation of brain iron concentration in vivo using a linear relationship between regional iron and apparent transverse relaxation rate of the tissue water at 4.7T. Magn Reson Med. 2009;62:1326–1330. doi: 10.1002/mrm.22097. [DOI] [PubMed] [Google Scholar]
- 60.Mukherjee P, Miller JH, Shimony JS, Philip JV, Nehra D, Snyder AZ, Conturo TE, Neil JJ, McKinstry RC. Diffusion-tensor MR imaging of gray and white matter development during normal human brain maturation. AJNR Am J Neuroradiol. 2002;23:1445–1456. [PMC free article] [PubMed] [Google Scholar]
- 61.Ono J, Kodaka R, Imai K, Itagaki Y, Tanaka J, Inui K, Nagai T, Sakurai K, Harada K, Okada S. Evaluation of myelination by means of the T2 value on magnetic resonance imaging. Brain Dev. 1993;15:433–438. doi: 10.1016/0387-7604(93)90083-k. [DOI] [PubMed] [Google Scholar]
- 62.Ostby Y, Tamnes CK, Fjell AM, Westlye LT, Due-Tønnessen P, Walhovd KB. Heterogeneity in subcortical brain development: A structural magnetic resonance imaging study of brain maturation from 8 to 30 years. J Neurosci. 2009;38:11772–11782. doi: 10.1523/JNEUROSCI.1242-09.2009. [DOI] [PMC free article] [PubMed] [Google Scholar]
- 63.Ou X, Sun SW, Liang HF, Song SK, Gochberg DF. The MT pool size ratio and the DTI radial diffusivity may reflect the myelination in shiverer and control mice. NMR in Biomedicine. 2009;22:480–487. doi: 10.1002/nbm.1358. [DOI] [PMC free article] [PubMed] [Google Scholar]
- 64.Paus T. Growth of white matter in the adolescent brain: myelin or axon? Brain Cogn. 2010;72:26–35. doi: 10.1016/j.bandc.2009.06.002. [DOI] [PubMed] [Google Scholar]
- 65.Pierpaoli C, Jezzard P, Basser PJ, Barnett A, Di Chiro G. Diffusion tensor MR imaging of the human brain. Radiology. 1996;201:637–48. doi: 10.1148/radiology.201.3.8939209. [DOI] [PubMed] [Google Scholar]
- 66.Ramasamy DP, Benedict RH, Cox JL, Fritz D, Abdelrahman N, Hussein S, Minagar A, Dwyer MG, Zivadinov R. Extent of cerebellum, subcortical and cortical atrophy in patients with MS: a case-control study. J Neurol Sci. 2009;282:47–54. doi: 10.1016/j.jns.2008.12.034. [DOI] [PubMed] [Google Scholar]
- 67.Sailer M, Fischl B, Salat D, Tempelmann C, Schönfeld MA, Busa E, Bodammer N, Heinze HJ, Dale A. Focal thinning of the cerebral cortex in multiple sclerosis. Brain. 2003;126:1734–1744. doi: 10.1093/brain/awg175. [DOI] [PubMed] [Google Scholar]
- 68.Salat DH, Greve DN, Pacheco JL, Quinn BT, Helmer KG, Buckner RL, Fischl B. Regional white matter volume differences in nondemented aging and Alzheimer’s disease. Neuroimage. 2009;44:1247–1258. doi: 10.1016/j.neuroimage.2008.10.030. [DOI] [PMC free article] [PubMed] [Google Scholar]
- 69.Sled JG, Levesque I, Santos AC, Francis SJ, Narayanan S, Brass SD, Arnold DL, Pike GB. Regional variations in normal brain shown by quantitative magnetization transfer imaging. Magn Reson Med. 2004;51:299–303. doi: 10.1002/mrm.10701. [DOI] [PubMed] [Google Scholar]
- 70.Smith SM. Fast Robust Automated Brain Extraction. Human Brain Mapping. 2002;17:143–155. doi: 10.1002/hbm.10062. [DOI] [PMC free article] [PubMed] [Google Scholar]
- 71.Song SK, Sun SW, Ramsbottom MJ, Chang C, Russell J, Cross AH. Dysmyelination revealed through MRI as increased radial (but unchanged axial) diffusion of water. Neuroimage. 2002;17:1429–1436. doi: 10.1006/nimg.2002.1267. [DOI] [PubMed] [Google Scholar]
- 72.Song SK, Sun SW, Ju WK, Lin SJ, Cross AH, Neufeld AH. Diffusion tensor imaging detects and differentiates axon and myelin degeneration in mouse optic nerve after retinal ischemia. Neuroimage. 2003;20:1714–1722. doi: 10.1016/j.neuroimage.2003.07.005. [DOI] [PubMed] [Google Scholar]
- 73.Song SK, Yoshino TJ, Le TQ, Lin SJ, Sun SW, Cross AH, Armstronga RC. Demyelination increases radial diffusivity in corpus callosum of mouse brain. NeuroImage. 2005;26:132–140. doi: 10.1016/j.neuroimage.2005.01.028. [DOI] [PubMed] [Google Scholar]
- 74.Stieltjes B, Kaufmann WE, van Zijl PC, Fredericksen K, Pearlson GD, Solaiyappan M, Mori S. Diffusion tensor imaging and axonal tracking in the human brainstem. Neuroimage. 2001;14:723–735. doi: 10.1006/nimg.2001.0861. [DOI] [PubMed] [Google Scholar]
- 75.Takahashi M, Ono J, Harada K, Maeda M, Hackney DB. Diffusional anisotropy in cranial nerves with maturation: quantitative evaluation with diffusion MR imaging in rats. Radiology. 2000;216:881–885. doi: 10.1148/radiology.216.3.r00se41881. [DOI] [PubMed] [Google Scholar]
- 76.Vavasour IM, Whittall KP, MacKay AL, Li DK, Vorobeychik G, Paty DW. A comparison between magnetization transfer ratios and myelin water percentages in normals and multiple sclerosis patients. Magn Reson Med. 1998;40:763–768. doi: 10.1002/mrm.1910400518. [DOI] [PubMed] [Google Scholar]
- 77.Wahl M, Li Y, Ng J, LaHue SC, Cooper SR, Sherr EH, Mukherjee P. Microstructural correlations of white matter tracts in the human brain. NeuroImage. 2010;51:531–541. doi: 10.1016/j.neuroimage.2010.02.072. [DOI] [PMC free article] [PubMed] [Google Scholar]
- 78.Wakana S, Caprihan A, Panzenboeck MM, Fallon JH, Perry M, Gollub RL, Hua K, Zhang J, Jiang H, Dubey P, Blitz A, Van Zij P, Mori S. Reproducibility of quantitative tractography methods applied to cerebral white matter. NeuroImage. 2007;36:630–644. doi: 10.1016/j.neuroimage.2007.02.049. [DOI] [PMC free article] [PubMed] [Google Scholar]
- 79.Walhovd KB, Fjell AM, Reinvang I, Lundervold A, Dale AM, Eilertsen DE, Quinn BT, Salat D, Makris N, Fischl B. Effects of age on volumes of cortex, whte matter and subcortical structures. Neurobiol of Aging. 2005;26:1261–1270. doi: 10.1016/j.neurobiolaging.2005.05.020. [DOI] [PubMed] [Google Scholar]
- 80.Walimuni IS, Humaira A, Hasan KM. A computational framework to quantify tissue microstructural integrity using conventional MRI macrostructural volumetry. Comp Biol Med. 2011 doi: 10.1016/j.compbiomed.2010.10.009. [DOI] [PubMed] [Google Scholar]
- 81.Weisskoff RM, Zuo CS, Boxerman JL, Rosen BR. Microscopic susceptibility variation and transverse relaxation: Theory and experiment. Magn Res Med. 1994;31:601–610. doi: 10.1002/mrm.1910310605. [DOI] [PubMed] [Google Scholar]
- 82.Wheeler-Kingshott CA, Cercignani M. About “axial” and “radial”diffusivities. Magn Reson Med. 2009;61:1255–1260. doi: 10.1002/mrm.21965. [DOI] [PubMed] [Google Scholar]
- 83.Whittall KP, MacKay AL, Graeb DA, Nugent RA, Li DKB, Paty DW. In vivo measurement of T2 distributions and water contents in normal human brain. Magn Reson Med. 1997;37:34–43. doi: 10.1002/mrm.1910370107. [DOI] [PubMed] [Google Scholar]
- 84.Yao B, Li TQ, Gelderen P, Shmueli K, de Zwart JA, Duyn JH. Susceptibility contrast in high field MRI of human brain as a function of tissue iron content. Neuroimage. 2009;44:1259–1266. doi: 10.1016/j.neuroimage.2008.10.029. [DOI] [PMC free article] [PubMed] [Google Scholar]
- 85.Zou KH, Tuncali K, Silverman SG. Correlation and simple linear regression. Radiology. 2003;227:617–622. doi: 10.1148/radiol.2273011499. [DOI] [PubMed] [Google Scholar]
Associated Data
This section collects any data citations, data availability statements, or supplementary materials included in this article.