Abstract
This paper focuses on the detection of retinal blood vessels which play a vital role in reducing the proliferative diabetic retinopathy and for preventing the loss of visual capability. The proposed algorithm which takes advantage of the powerful preprocessing techniques such as the contrast enhancement and thresholding offers an automated segmentation procedure for retinal blood vessels. To evaluate the performance of the new algorithm, experiments are conducted on 40 images collected from DRIVE database. The results show that the proposed algorithm performs better than the other known algorithms in terms of accuracy. Furthermore, the proposed algorithm being simple and easy to implement, is best suited for fast processing applications.
Key Words: Diabetic retinopathy, blood vessel segmentation, automatic thresholding, histogram equalization
Introduction
Due to the rapid development in computing technology and techniques, algorithms that support automated medical diagnosis have been gaining importance. Retinal vasculature has received attention by specialists in different pathologies, where the detection and analysis of retinal vasculature may lead to early diagnosis and prevention of several diseases, such as hypertension, diabetes, arteriosclerosis, cardiovascular disease and stroke.1 One of the well-known and commonest diseases that need a computer-aided medical diagnosis is diabetic retinopathy (DR), which leads in most cases to partial or even complete loss of visual capability.2 The accurate diagnosis of this disease depends upon some features which have to be analyzed in order to quantify the severity level of the disease. Retinal blood vessels are considered as one of the most important features for the detection of DR. As diabetic retinopathy is a progressive disease, regular screening of the human retina is essential for reducing the proliferative diabetic retinopathy and for preventing the subsequent loss of visual capability. The screening should be done every 6 months, which includes obtaining and analyzing a sequence of fundus images and observing the early changes in blood vessel patterns as well as the presence of microaneurysms.3–6
In the literature, a number of algorithms for automated blood vessel segmentation have been reported. These algorithms fall into several categories, such as matched filter based,7,8 tracking based,9–12 threshold probing based,13 model based,14,15 neural network based,16 and pattern recognition based.17,18
This paper presents a blood vessel segmentation algorithm which takes advantage of simple and powerful image processing techniques. For instance, as the contrast between the blood vessels (foreground) and the retinal tissue (background) is generally poor in the fundus images, an effective technique called contrast-limited adaptive histogram equalization (CLAHE)19 is utilized for contrast enhancement by limiting the maximum slope in the transformation function. Another technique, called Isodata20 that provides an automatic threshold value for binarization is also employed. Furthermore, the proposed algorithm is characterized by low processing time thus making it suitable for fast processing applications.
The remainder of the paper is organized as follows: “Overview of the Proposed Methodology” presents an overview of the proposed algorithm, “Results and Discussion” presents the results and discussion and “Conclusion” provides conclusions.
Overview of the Proposed Methodology
Database
Our algorithm has been tested over sets of fundus images collected from publicly available database, called DRIVE database.21 The DRIVE database contains 40 test images, compressed in JPEG format of size 565 × 584 pixels obtained from a diabetic retinopathy screening program. The images are acquired using a Canon CR5 non-mydriatic 3CCd camera at 45° field of view.
The 40 images were divided into two sets, a test set and a training set, each containing 20 images. The images have been manually segmented by three observers to be used as references for comparing the computer-generated segmentations. For each image in test set, two manual segmentations (first and second manuals) are available, whereas for an image in the training set, only one manual segmentation is available.
Proposed Methodology
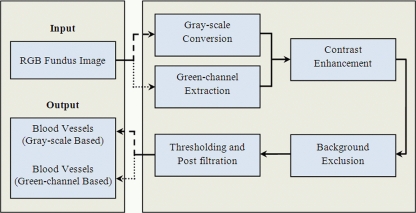
The proposed algorithm is designed for retinal blood vessels segmentation. Input to the system is a color fundus image of human retina acquired by a fundus camera and the output is a binary image which contains only the blood vessels. The main modules of the algorithm are: Color image (RGB) to gray/green conversion, contrast enhancement, background exclusion, and thresholding and post-filtration. Figure 1 shows the block diagram of the proposed algorithm.
Fig. 1.
Block diagram of the proposed algorithm.
RGB to Gray/Green Conversion
Color fundus image is first converted into a gray-scale/green-channel image in order to facilitate the blood vessels segmentation and to decrease the computational time. Gray-scale image provides only the luminance information from the color image after eliminating the hue and saturation, while the green-channel image provides maximum local contrast between the background and foreground.22,23 The segmentation results are obtained using gray and green-channel images and they are then compared with the results obtained using other known algorithms. The conversion from the color image to gray-scale image is done by forming a weighted sum of the RGB components, as in Eq. (1):
 |
1 |
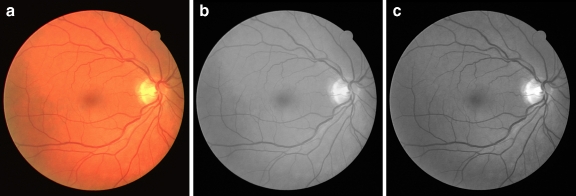
where R, G, and B represent the red, green, and blue components respectively. Figure 2 shows an RGB image and the extracted gray-scale and green-channel images.
Fig. 2.
a Color retinal image, b gray-scale image, c green-channel image.
Contrast Enhancement
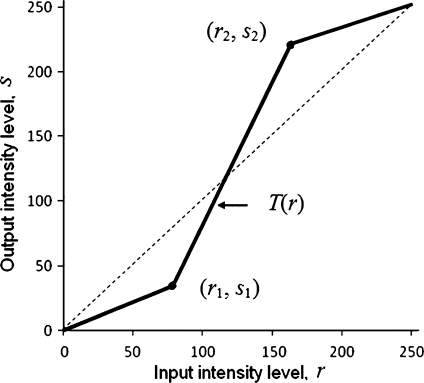
Low contrast images could occur often due to several reasons, such as poor or non-uniform lighting condition, nonlinearity or small dynamic range of the imaging sensor, i.e., illumination is distributed non-uniformly within the image. Therefore, it is necessary to deepen the contrast of these images to provide a better transform representation for subsequent image analysis steps.24,25 The contrast stretching process applied to the gray-scale/green-channel image is illustrated in Figure 3, where T(r) represents the transformation function controlled by the locations of points (r1, s1) and (r2, s2). A wide variety of techniques is employed to improve the contrast by stretching the range of intensity values of the image so that the full dynamic range of the image is covered. Techniques such as decorrelation stretch transform, unsharp mask, histogram equalization, adaptive histogram equalization (AHE), contrast-limited adaptive histogram equalization (CLAHE) are used for enhancing the image contrast. In the proposed algorithm, CLAHE technique is adopted to perform the contrast enhancement.
Fig. 3.
Explanatory illustration of contrast stretching transformation.
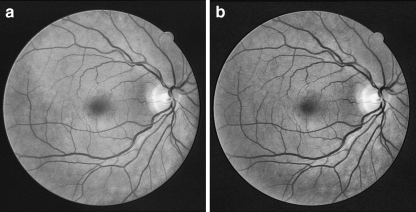
CLAHE is a widely used contrast enhancement technique which has proved itself to be very effective for medical images. This technique enhances the contrast adaptively across the image by limiting the maximum slope in the transformation function. Instead of applying the histogram equalization on the entire image, it is applied only on small non-overlapping regions in the image. Then, the neighboring tiles are combined using bilinear interpolation to reduce induced boundaries.26,27 In our implementation, the size of each region was 8 × 8 pixels with 128 bins for the histogram. Figure 4 shows the results of applying the CLAHE on the gray-scale and green-channel images.
Fig. 4.
Results of contrast enhancement a Gray-scale image, b Green-channel.
Background Exclusion
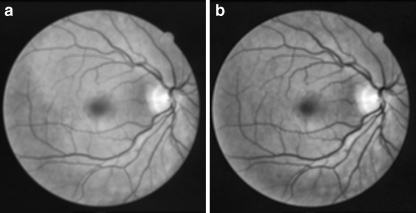
The main purpose of this step is eliminating background variations in illumination from an image so that the foreground objects may be more easily analyzed. In the proposed algorithm, the background exclusion is performed by subtracting the original intensity image from the average-filtered image.
Average filter is one of the simplest local operations over an image, which is also called as “neighborhood average method”. The essential idea of a standard moving average filter is to replace the value of the center pixel  by the average value of a predefined number of neighboring pixels gi(x, y) as shown in Eq. (2).28,29
 |
2 |
In the proposed algorithm, a window size (M × N) of 9 × 9 pixels is used for implementing the average filter. Figure 5 shows the results of applying the average filter on the gray-scale and green-channel images.
Fig. 5.
Average-filtered images with a 9 × 9 pixels a Gray-scale image, b Green-channel.
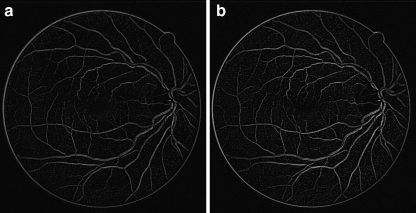
The original image g is subtracted from the average-filtered image  and the result is shown in Figure 6. Mathematically, the difference image h(x, y) between two images
  and g, is generated by computing the difference ‘t’ between all pairs of corresponding pixels in
  and g(x, y),30 as shown in Eq. (3).
 |
3 |
Fig. 6.
The resultant image of background exclusion a Gray-scale image, b Green-channel.
Thresholding and Post-Filtration
The aim of this module is to produce a binary image in which the value of each pixel is either 1 (blood vessel) or 0 (background). Unfortunately, there exists no thresholding technique for determining a unique threshold value which will provide perfect results in all cases. However, in the proposed algorithm, we made use of the so-called Isodata technique which provides an automatic threshold value for producing a binary image B. This technique divides the histogram into two parts, P1 and P2 using an initial threshold value T0. Subsequently, the mean values µ1 and µ2 of both the parts are calculated, and a new threshold value is determined which represents the average of µ1 and µ2, as shown in Eqs. (4) and (5). This process is repeated iteratively until the threshold values Tk and Tk-1, converge (i.e., Tk ≈ Tk-1), where:
 |
4 |
 |
5 |
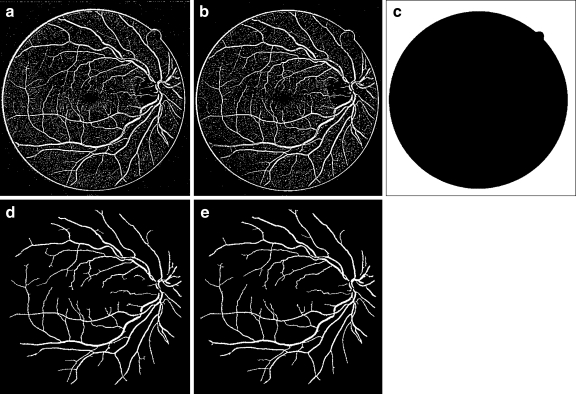
The gray-scale/green-channel images h(x, y) are then converted to binary images based on the threshold values Tk using Eq. (6). The resulting binary images are shown in Figure 7a, b, respectively.
 |
6 |
Fig. 7.
a Gray-scale binary image after thresholding b green-channel binary image after thresholding c mask image Imaskd gray-scale binary image after post-filtration e green-channel binary image after post-filtration.
As a result of the thresholding, some unwanted pixels would appear as noise (false positive) in the resultant binary image, and therefore, some post-processing should be adopted for refining the image and retaining the desired objects. For this purpose, a morphological operation (opening)26 is employed to remove the undesired objects that have fewer than 35 pixels. The bright circle corresponding to the edge of retina can also be removed by subtracting a mask image Imask which is shown in Figure 7c from the binary image, as illustrated in Eqs. 7–10.
 |
7 |
 |
8 |
 |
9 |
 |
10 |
The resulting gray-scale and green-channel images after post-filtration are shown in Figures 7d, e, respectively.
Results and Discussion
The experiments are carried out using the same values for all of the parameters mentioned in the different steps of the proposed algorithm. All the 40 images of the DRIVE database (20 training images and 20 test images) are used to evaluate the performance of the proposed algorithm. A number of criteria, namely, accuracy (Acc.),31 true-positive fraction (TPF), false-positive fraction (FPF), area under the ROC curve (Az),32 and Kappa statistics (k)33 are used to evaluate the performance of the proposed algorithm. The accuracy is computed by the ratio of the total number of correctly classified points to the number of points in the image. TPF denotes the fraction of pixels correctly classified as blood vessel pixels, while FPF denotes the fraction of pixels erroneously classified as blood vessel pixels. TPF and FPF are calculated using Eqs. 11 and 12, respectively.
 |
11 |
 |
12 |
where true positive (TP) refers to positive pixels correctly labeled as positive. False positive (FP) refers to negative pixels incorrectly labeled as positive. False negative (FN) refers to positive pixels incorrectly labeled as negative. Finally, True Negative (TN) refers to negative pixels correctly labeled as negative. Area under the ROC curve is obtained by plotting the TPF against the FPF32. The Kappa coefficient (k) is used to estimate the agreement between the automated- and manually segmented blood vessels which is calculated using Eq. (13).33
 |
13 |
where Pr(a) and Pr(e) represent the observed and chance agreements respectively. The average values of the Acc., TPF, FPF, Az and k are obtained for the proposed algorithm using DRIVE database images. Table 1 compares the results obtained using the proposed algorithm with those obtained by other known algorithms.
Table 1.
Performance of different algorithms for blood vessel segmentation on DRIVE database
| Method | Acc. | TPF | FPF | Az | k |
|---|---|---|---|---|---|
| 2nd Human observer20 | 0.9473 | 0.7761 | 0.0275 | – | – |
| Mendonca (gray-scale)31 | 0.9463 | 0.7315 | 0.0219 | – | – |
| Mendonca (green- channel)31 | 0.9452 | 0.7344 | 0.0236 | – | – |
| Staal20, 34 | 0.9442 | 0.7194 | 0.0227 | – | – |
| Niemeijer20, 35 | 0.9417 | 0.6898 | 0.0304 | – | – |
| RGB-Q36 | – | 0.7704 | 0.0693 | – | – |
| G-Q36 | – | 0.7500 | 0.0732 | – | – |
| Proposed algorithm (gray-scale) | 0.9554 | 0.8303 | 0.0308 | 0.8865 | 0.7298 |
| Proposed algorithm (green-channel) | 0.9630 | 0.8423 | 0.0342 | 0.8987 | 0.7419 |
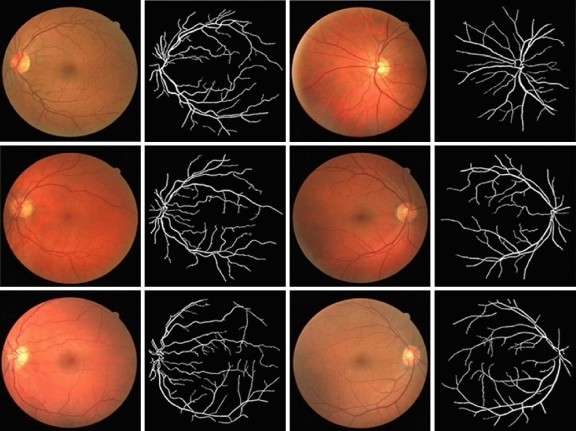
Based on the experimental results presented in Tables 1, it is clear that the proposed algorithm yields superior results compared with other known algorithms with respect to the accuracy and TPF values. The FPF values obtained by the proposed algorithm are comparable to the values obtained by other methods. Figure 8 shows some sample results obtained using the proposed algorithm.
Fig. 8.
Random samples of original and segmented images: a and b Green-channel, c and d gray-scale.
Since the proposed algorithm makes use of only simple computing techniques, the processing time for this algorithm will be significantly less compared with the algorithms which make use of computationally intensive techniques such as neural networks and region-growing. Hence this algorithm is best suited for fast-processing screening applications. Using MATLAB 7.6 with a P. IV/CPU 2.80 GHz/2 GB of RAM, the proposed algorithm took an average time of approximately 0.3 s per image.
Conclusion
In this paper, a simple and computationally efficient algorithm for retinal blood vessel segmentation has been presented. The proposed algorithm has employed modules such as contrast enhancement, background exclusion and thresholding. Experimental results obtained by using gray-scale as well as green-channel images have been presented. For binarization, an automatic thresholding technique, called Isodata has been employed. The performance of the proposed algorithm has been tested using DRIVE database images. From the experimental results, it is found that the proposed algorithm yields superior results compared with other known algorithms with respect to the accuracy and TPF values. Also, since the proposed algorithm makes use of only simple and computationally less intensive processing steps, it is best suited for fast processing applications.
References
- 1.Kanski JJ. Clinical Ophthalmology: A Systematic Approach. London, UK: Butterworth-Heinemann; 1989. [Google Scholar]
- 2.Sussman EJ, Tsiaras WG, Soper KA. Diagnosis of diabetic eye disease. J Am Med Assoc. 1982;247:3231–3234. doi: 10.1001/jama.247.23.3231. [DOI] [PubMed] [Google Scholar]
- 3.Lee SJ, McCarty CA, Taylor HR, Keeffe JE. Costs of mobile screening for diabetic retinopathy: A practical framework for rural populations. Aust J Rural Health. 2001;8:186–192. doi: 10.1046/j.1038-5282.2001.00356.x. [DOI] [PubMed] [Google Scholar]
- 4.Taylor HR, Keeffe JE. World blindness: A 21st century perspective. Brit J Ophthalmol. 2001;85:261–266. doi: 10.1136/bjo.85.3.261. [DOI] [PMC free article] [PubMed] [Google Scholar]
- 5.Streeter L, Cree MJ: Microaneurysm detection in colour fundus images. In: Image and Vision Computing. New Zealand, Palmerston North, New Zealand, Nov. 2003, pp. 280–284
- 6.Soares JVB, Leandro JJG, Cesar RM, Jr, Jelinek HF, Cree MJ. Retinal vessel segmentation using the 2-D Gabor wavelet and supervised classification. IEEE Trans Med Imag. 2006;25(9):1214–1222. doi: 10.1109/TMI.2006.879967. [DOI] [PubMed] [Google Scholar]
- 7.Hoover A, Kouznetsova V, Goldbaum M. Locating blood vessels in retinal images by piecewise threshold probing of a matched filter response. IEEE Trans Med Imag. 2000;19(3):203–210. doi: 10.1109/42.845178. [DOI] [PubMed] [Google Scholar]
- 8.Chaudhuri S, Chatterjee S, Katz N, Nelson M, Goldbaum M. Detection of blood vessels in retinal images using two-dimensional matched filters. IEEE Trans Med Imag. 1989;8:263–269. doi: 10.1109/42.34715. [DOI] [PubMed] [Google Scholar]
- 9.Tolias Y, Panas S. A fuzzy vessel tracking algorithm for retinal images based on fuzzy clustering. IEEE Trans Med Imag. 1998;17:263–273. doi: 10.1109/42.700738. [DOI] [PubMed] [Google Scholar]
- 10.Sun Y. Automated identification of vessel contours in coronary arteriograms by an adaptive tracking algorithm. IEEE Trans Med Imag. 1989;8:78–88. doi: 10.1109/42.20365. [DOI] [PubMed] [Google Scholar]
- 11.Tamura S, Okamoto Y, Yanashima K. Zero-crossing interval correction in tracing eye-fundus blood vessels. Pattern Recognit. 1988;21(3):227–233. doi: 10.1016/0031-3203(88)90057-X. [DOI] [Google Scholar]
- 12.Tamura S, Tanaka K, Ohmori S, Okazaki K, Okada A, Hoshi M. Semiautomatic leakage analyzing system for time series fluorescein ocular fundus angiography. Pattern Recognit. 1983;16(2):149–162. doi: 10.1016/0031-3203(83)90018-3. [DOI] [Google Scholar]
- 13.Jiang X, Mojon D. Adaptive local thresholding by verification-based multithreshold probing with application to vessel detection in retinal images. IEEE Trans Pattern Anal Mach Intell. 2003;25(1):131–137. doi: 10.1109/TPAMI.2003.1159954. [DOI] [Google Scholar]
- 14.Thackray BD, Nelson AC. Semi-automatic segmentation of vascular network images using a rotating structuring element (ROSE) with mathematical morphology and dual feature thresholding. IEEE Trans Med Imag. 1993;12:385–392. doi: 10.1109/42.241865. [DOI] [PubMed] [Google Scholar]
- 15.Klein AK, Lee F, Amini A. Quantitive coronary angiography with deformable spline models. IEEE Trans Med Imag. 1997;16:468–482. doi: 10.1109/42.640737. [DOI] [PubMed] [Google Scholar]
- 16.Nekovei R, Sun Y. Back-propagation network and its configuration for blood vessel detection in angiograms. IEEE Trans Neural Networks. 1995;6:64–72. doi: 10.1109/72.363449. [DOI] [PubMed] [Google Scholar]
- 17.Thackray BD, Nelson AC. Semi-automatic segmentation of vascular network images using a rotating structuring element (ROSE) with mathematical morphology and dual feature thresholding. IEEE Trans Med Imag. 1993;12:385–392. doi: 10.1109/42.241865. [DOI] [PubMed] [Google Scholar]
- 18.Ritchings RT, Colchester ACF. Detection of abnormalities on carotid angiograms. Pattern Recogn Lett. 1986;4:367–374. doi: 10.1016/0167-8655(86)90058-9. [DOI] [Google Scholar]
- 19.Pizer SM, Johnston RE, Ericksen JP, Yankaskas BC, Muller KE: Contrast-limited adaptive histogram equalization: Speed and effectiveness. In: Proc. of the 1st Conf. on Visualization in Biomedical Computing, 1990, pp 337–345
- 20.Ridler TW, Calvard: Picture thresholding using an iterative selection method. In: Proc. IEEE Trans. On Systems, Man, Cybernetics, vol. SMC-8, 1978, pp 630–632
- 21.Niemeijer M, van Ginneken B: 2002 [Online]. Available: http://www.isi.uu.nl/Reseach/Databases/DRIVE/results.php
- 22.Leandro JJG, Soares JVB, Cesar RM Jr., Jelinek HF: Blood vessels segmentation in non-mydriatic images using wavelets and statistical classifiers. In: Proc. of the 16th Brazilian Symposium on Computer Graphics and Image Processing (SIBGRAPI), 2003, pp 262–269
- 23.Salem NM, Nandi AK. Novel and adaptive contribution of the red channel in pre-processing of colour fundus images. J Franklin Inst. 2007;344:243–256. doi: 10.1016/j.jfranklin.2006.09.001. [DOI] [Google Scholar]
- 24.Jain AK: Fundamental of digital image processing. Prentice Hall, 1989, ISBN: 0133325764
- 25.Hossain F, Alsharif MR: Image enhancement based on logarithmic transform coefficient and adaptive histogram equalization. In: Proc. of Int. Conf. on Convergence Information Technology. 2007, pp 1439–1444
- 26.The MathWorks, Inc, (1994–2010). The Matlab package, [online]. Available: http://www.mathworks.com/ [2008, October 18]
- 27.Papadopoulos A, Fotiadis DI, Costaridou L. Improvement of microcalcification cluster detection in mammography utilizing image enhancement techniques. J Comput Biol Med. 2008;38:1045–1055. doi: 10.1016/j.compbiomed.2008.07.006. [DOI] [PubMed] [Google Scholar]
- 28.Costa LF, Cesar RM Jr: Shape analysis and classification: Theory and practice. Boca Raton: CRC Press, 2001, ISBN 0-8493-3493-4
- 29.Kwan HK: Fuzzy filters for noisy image filtering. In: Proc. Int. Sym. on Circuits and Systems (ISCAS), vol. 4, 2003, pp 161–164
- 30.Gonzalez RC, Woods RE: Digital Image Processing, 2nd edition. Englewood Cliffs, NJ: Prentice hall, 2002. ISBN: 0201180758
- 31.Mendonca AM: Segmentation of retinal blood vessels by combining the detection of centerlines and morphological reconstruction. In: Proc. IEEE Trans. on Med. Imag., vol. 25, no. 9, pp. 1200–1213, 2006 [DOI] [PubMed]
- 32.Metz CE. Basic principles of ROC analysis. Semin Nucl Med. 1978;8(4):283–298. doi: 10.1016/S0001-2998(78)80014-2. [DOI] [PubMed] [Google Scholar]
- 33.Cohen J. A coefficient of agreement for nominal scales. Educ Psychol Meas. 1960;20(1):37–46. doi: 10.1177/001316446002000104. [DOI] [Google Scholar]
- 34.Staal J, Abramoff MD, Niemeijer M, Viergever MA, Ginneken B. Ridge-based vessel segmentation in color images of the retina. IEEE Trans Med Img. 2004;23(4):501–509. doi: 10.1109/TMI.2004.825627. [DOI] [PubMed] [Google Scholar]
- 35.Niemeijer M, Staal J, Van Ginneken B, Loog M, Abramoff MD: Comparative study of retinal vessel segmentation methods on a new publicly available database. In: Fitzpatrick M, Sonka M Eds. Proc. SPIE Med. Image, vol. 5370, 2004, pp. 648–656
- 36.Reza AW, Eswaran C, Hati S. Diabetic retinopathy: A quadtree based blood vessel detection algorithm using RGB components in fundus images. J Med Syst. 2008;32(2):147–155. doi: 10.1007/s10916-007-9117-5. [DOI] [PubMed] [Google Scholar]


