Abstract
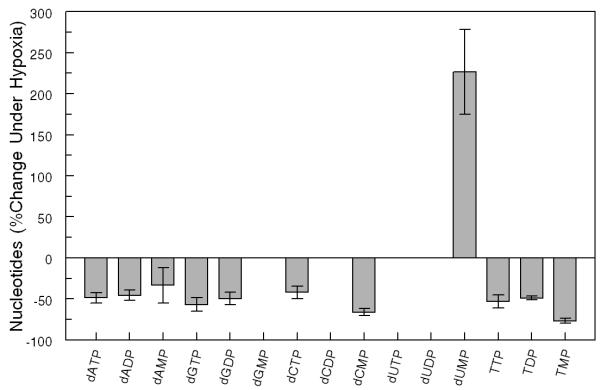
Endogenous ribonucleotides and deoxyribonucleotides play a critical role in cell function, and determination of their levels is of fundamental importance in understanding key cellular processes involved in energy metabolism and molecular and biochemical signaling pathways. In this study, we determined the respective ribonucleotide and deoxyribonucleotide pool sizes in different human cell lines using a simple sample preparation method and LC/MS/MS. This assay was used to determine alterations in deoxyribonucleotide pools in human pancreatic PANC-1 cells in response to hypoxia and to treatment with either hydroxyurea or aphidicolin. The levels of all deoxyribonucleotide metabolites decreased with hypoxia treatment, except for dUMP, which increased by two-fold. This LC/MS/MS assay is simple, fast, and sensitive, and it represents a significant advance over previously published methodologies.
Keywords: ribonucleotides, deoxyribonucleotides, LC/MS/MS, hypoxia, hydroxyurea, aphidicolin
1. Introduction
Deoxyribonucleotides (dRNs) are essential metabolites that play an important role in a broad range of key cellular functions. To date, determination of intracellular dRN pools has been limited by the relatively low levels of dRNs present in most cells. Moreover, there has been difficulty in separating them from the more abundant ribonucleotides (RNs). As a result, there is a clear need for a more sensitive and rapid assay to measure dRN pool sizes. The current analytical methods for measuring intracellular RNs and dRNs include an enzymatic assay using E. coli DNA polymerase and synthetic oligonucleotides, a radioimmunoassay (RIA), and high performance liquid chromatography (HPLC) methods with UV and mass spectrometry detector [1-4]. The DNA polymerase assay quantifies the amount of DNA synthesized in an in vitro polymerization system with the dRNs of interest as the limiting factor in the reaction mixture [5, 6]. This assay has been the most widely used method to measure dRN levels. However, it is relatively insensitive and requires a large number of cells with a minimum detection on the order of 0.1-0.5 pmol [5]. In addition, the respective monophosphate (dNMP) and diphosphate deoxyribonucleotides (dNDP) cannot be measured with this assay. Furthermore, the determination of dRN levels has been hampered by the presence of nucleoside analog triphosphate metabolites that inhibit the enzymatic activity of E. coli DNA polymerase. The RIA method provides an attractive alternative for measuring dRNs as it is a sensitive assay that is relatively simple to perform [7]. However, the specific dRN metabolites that can be quantified are limited by the lack of specific antibodies directed against the dRNs, in particular, antibodies for most of the monophosphate and diphosphate nucleotides. The potential use of HPLC with either UV detector or coupled with tandem mass spectrometry (LC/MS/MS) has been explored by several investigators. To date, the main limitations of HPLC have been: (1) poor retention on reversed-phase HPLC columns with conventional mobile phase due to their high polarity, (2) the less than optimum degradation of RNs with periodate and methylamine before quantification of dRNs e.g. different bases convert with different efficiency [4], and (3) the need for strong anion exchange (SAX) columns for separation of nucleotides, which are not compatible with mass spectrometry as this method requires non-volatile high salt concentrations in the mobile phase.
Benech et al developed an HPLC/MS/MS analysis for measuring endogenous nucleotides by means of ion-pairing HPLC and the periodate oxidation method for the degradation of dRNs interfering with dGTP and ATP [4]. However, with this approach, sample preparation involved a complex oxidation procedure limiting its routine use. Shewach developed a boronate affinity column followed by ion-exchange HPLC procedure to quantitate the level of deoxyribonucleotide triphosphates (dNTPs)[8]. This methodology, however, is not compatible with mass spectrometry as this method requires non-volatile high salt concentrations in the boronate column. Cohen et al reported a new method based on a combination of a selective sample preparation and an ion-pair liquid chromatography-electrospray tandem mass spectrometry that could simultaneously determine eight endogenous ribonucleotide triphosphates (rNTP) and dNTPs [9]. While this methods can measure the respective triphosphate pools, it remains unclear that this strategy can be used to accurately measure dNMP and dNDP levels. In addition, sample preparation for this method is time-consuming, thereby limiting its potential clinical application.
In this report, we have modified the LC/MS/MS assay developed for rapid and simultaneous determination of all RNs and dRNs [9]. Using this newly developed method, we measured RN and dRN pool sizes in four different human cancer cell lines (e.g., H23, PANC1, HepG2, and H1975) and investigated the effect of hypoxia, hydroxyurea (HU), and aphidicolin (APH) treatment on RN and dRN metabolite levels in human pancreatic PANC1 cancer cells. To our knowledge, this is the first report in which the individual levels of 27 RNs and dRNs (i.e., mono-, di-, and tri-phophate nucleotides) have been analyzed simultaneously in a single assay.
2. Materials and Methods
2.1 Chemicals and reagents
ATP, ADP, AMP, dATP, dADP, dAMP, CTP, CDP, CMP, dCTP, dCDP, dCMP, UTP, UDP, UMP, dUTP, dUMP, GTP, GDP, GMP, dGTP, dGDP, dGMP, TTP, TDP, TMP, and stable isotope labeled adenosine-13C10,15N5-triphosphate (ATP13C,15N) were purchased from Sigma (St. Louis, MO). dUDP was purchased from Carbosynth (Berkshire, UK). HPLC-mass grade methanol, HPLC-mass grade acetonitrile, HPLC-mass grade water, trichloroacetic acid (TCA), acetic acid (AcOH), and 0.05% formic acid were obtained from J. T. Baker (Phillipsburg, NJ). Hexylamine (HA), diethylamine (DEA), hydroxyurea, trioctylamine, 1, 1, 2-trichlorotrifluoroethane and aphidicolin were purchased from Sigma (St. Louis, MO).
2.2 Cell lines
Human pancreatic cancer cell line (PANC1), human lymphoblastoma cell line (H9), and human hepatocellular cancer cell line (HepG2) were obtained from American Type Culture Collection (ATCC; Rockville, MD), and human lung cancer cell line (H23) and human non-small cell cancer cell line (H1975) were gifts from Prof. Don X. Nguyen, Department of Pathology, Yale School of Medicine, New Haven, CT.
2.3 Antibodies
Thymidylate synthase (TS) and CMP kinase (CMPK) antibodies were developed in the laboratories of Dr. Chu and Dr. Cheng, respectively. Antibodies to ribonucleotide reductase subunits M1 (RRM1) and M2 (RRM2) and P53-controlled ribonucleotide reductase (RRP53R2) were gifts from Dr. Yun Yen, City of Hope Comprehensive Cancer Center, Duarte, CA. Thymidine kinase-1 (TK-1) antibody was a gift from Dr. Staffan Eriksson, Department of Anatomy, Physiology and Biochemistry, Swedish University of Agricultural Sciences, Uppsala, Sweden. dCMP deaminase (dCMPDA) antibody was a gift from Dr. Frank Maley, New York State Department of Health, Albany, NY. The antibody to α/β tubulin was purchased from Cell Signaling Technology (Beverly, MA).
2.4 Instrumentation
The chromatographic system consisted of an Agilent 1200s HPLC series, including a binary pump (Model G1312B), a vacuum degasser (Model G1379B), an autosampler (Model G1367C), and a column oven (Model G1316B). The mass spectrometer was an Applied Biosystems Sciex 4000 Q-trap® mass spectrometer (Applied Biosystems Sciex; Foster, CA). Data acquisition was carried out by Analyst 1.4.2® software on a Dell computer.
2.5 LC/MS/MS conditions
The chromatographic separation was achieved on a XTerra-MS C18 column (150 mm ×2.1 mm i.d., 3.5 μm, Waters, Milford, MA). The two eluents were: (A) 5 mM HA–0.5% DEA in water, pH adjusted to 10 with AcOH; and (B) 50% acetonitrile in water. The mobile phase consisted of linear gradients of A and B: 0–15 min, 100–80 % A (v/v); 15–35 min, 80–70% A; 35–45 min, 70–45 % A; 45-46 min, 45–0 % A; 46–50 min, 0–0 % A; 51–70 min, 100–100 % A. The liquid flow-rate was set at 0.3 mL/min, and the column temperature was maintained at 30°C. For all RNs and dRNs, the following optimized parameters were obtained. The curtain gas reached 20 psi. The ionspray voltage was set at 4500 V, and the temperature at 650°C. The nebulizer gas (GS1) and turbo gas (GS2) were 55 psi and 50 psi, respectively.
2.6 Cell Culture
All cells were cultured in RPMI-1640 medium supplemented with 10% dialyzed fetal bovine serum (dFBS), 100 units/mL penicillin, 100 μg/mL streptomycin, 4.5 g/L glucose, and 25 mmol/L HEPES (pH 7.4) in a 37°C humidified incubator with a 5% CO2 atmosphere as normoxic condition or in a 37°C hypoxic chamber that was continuously pumped with a gas mixture of 1% O2, 5% CO2, and balanced 94% N2 (Airgas, New Haven, CT). PANC1, H23, HepG2, and H1975 cells were seeded in 100 mm by 20 mm dishes (Corning Inc, NY) with initial cell number of 5×10⁶ and reached approximately 60 to 70 % confluence after two days incubation in normoxic or three days in hypoxic conditions. An extra dish of each cell line was incubated for cell counting on the day of cell harvest for normalization of nucleotide pools, and the viability assessed by trypan blue exclusion assay (only cells with more than 95% viability were used).
2.7 Preparation of cell pellets
Monolayer cells PANC1, H23, HepG2, and H1975 cells were washed with ice-cold PBS once and were trypsinized with pancreatin. Cells from two or three dishes were then resuspended with 12 mL ice-cold phosphate buffered isotonic saline solution (PBS) containing 60 μL dFBS. After centrifugation at 1,000 rpm for 3 minutes, cell pellet was washed with 1 mL ice-cold PBS again and spun down at 1,000 rpm for 3 minutes. The cell pellet was treated with 150 μL of 15% trichloroacetic acid (TCA) containing 3 μL of 19.8 uM 13C-ATP as internal standard and placed on ice for 30 minutes. After centrifugation at 13,500 rpm for 10 min in the cold room, the acidic supernatant was separated and neutralized twice with 80 μL mixture of trioctylamine and 1, 1, 2-trichlorotrifluoroethane (a volume ratio of 45 to 55). Samples were stored at −80°C until analysis, which was performed within two days.
2.8 Calibration
We used the addition calibration method for quantification of nucleotide levels [4, 10]. Several aliquots of H9 cells containing different concentrations of all RNs and dRNs were pooled, centrifuged, and extracted for analysis as described above in “Preparation of cell pellets” section. A calibration curve for each RN and dRN was obtained by quadratic regression analysis with 1/X2 weighting based on the peak area ratio of the analyte to the internal standard. Calibration curves with a correlation coefficient (r) higher than 0.98 were acceptable. The lower limit of quantification (LLOQ) was defined as the lowest concentration on the calibration curve.
2.9 Cell size and volume determination
The Agilent 2100 bioanalyzer (Agilent Technologies, Palo Alto, CA) was used for cell size distribution according to manufacturer instructions. In brief, monolayer cancer cells were detached by pancreatin and approximately 2.5×10⁵ cells were suspended in 1 mL RPMI medium supplemented with 10% FBS, diluted in 20 mL normal saline, and immediately analyzed. For each sample, the length of the count was less than 13 seconds to ensure accuracy. The mean value of the diameter distribution curve was taken as the cell diameter, and all experiments were repeated at three times for each sample. Finally, cell size was calculated according to the equation of the volume of a sphere ( V =4×π × R3/3).
2.10 Expression of enzymes involved in the metabolic pathways of deoxyribonucleotide synthesis
The expression of key enzymes involved in DNA biosynthesis including TS, RRM1, RRM2, RRP53R2, dCMPDA, CMPK, and TK-1, was determined by standard Western blot analysis as previously described [11]. In brief, whole cell lysates containing 100 μg of protein from the cell extract were resolved on a 12% SDS-polyacrylamide gel and transferred to a nitrocellulose membrane (Amersham Biosciences, Piscataway, NJ). The membrane was incubated overnight at 4°C with blocking solution (TBS, 0.2% Tween 20, and 5% nonfat milk), followed by incubation with the specific primary antibody of interest. The membrane was then incubated with horseradish peroxidase-conjugated anti-mouse IgG (1:3000; Sigma) or anti-rabbit IgG (1: 10,000; Sigma, ST Louis, MO), and the signal was visualized using enhanced chemiluminescence (Perkin-Elmer Life Science; Akron, OH) according to the manufacturer’s instructions. Protein expression was quantified using BD Pathway™ Software (BD Biosciences, San Jose, CA). The density of the band for protein expression was normalized to that of a control housekeeping protein tubulin.
3. Results
3.1 Assay Development
Herein, we report on a novel LC/MS/MS methodology that is capable of determining 27 endogenous RNs and dRNs simultaneously in various human cancer cell lines. This is a simple, quick, and sensitive assay that can assess alterations in intracellular pool sizes under various conditions, including hypoxia and treatment with HU and APH. The changes in the RN and dRN pool sizes observed under these different treatment conditions are consistent with what has been previously reported using different methodologies[12, 13]. Our method can also be used to determine the intracellular metabolites of various nucleoside analogs (unpublished data). Thus, the interaction of dRNs and nucleoside analog metabolites in cells can be directly examined. The use of this method will facilitate clinical studies of nucleoside analogs by overcoming the labor intensive nature and technical difficulties associated with current analytical methods for measuring intracellular dRNs[1-4].
While Cohen et al recently validated the use of LC/MS/MS for simultaneous intracellular quantification of RNs and dRNs [9], our group has improved upon their method with a simple and quick sample preparation procedure along with incorporating of an ion-pair liquid chromatography-electrospray tandem mass spectrometry. With our approach, we were able to obtain sufficient isolation of each of the respective RNs and dRNs. Historically, chromatographic separation of ATP and dGTP has been particularly challenging to most investigators including Cohen’s group [4, 9, 14, 15]. ATP and dGTP have the same molecular weight (mw: 507) and the same transition (m/z: 506 → 159.0) [9]. Moreover, the concentration of ATP is about 1000-fold greater in cells than the concentration of dGTP [16]. In the past, the interference of ATP on dGTP quantification was overcome by oxidation of the sample to remove ATP [4]. However, this approach is time consuming and requires two separate injections for analyzing RNs and dRNs adding to the already cumbersome nature of RN and dRN determination. The ionization mode for each of the nucleotide analytes was done in the negative ion mode except for that of deoxyguanosine nucleotides (i.e., dGMP, dGDP, and dGTP), which were analyzed in the positive ion mode. We obtained satisfactory separation of each of the 12 ribonucleotides and 15 deoxyribonucleotides (Table 2 and Table 3). Under the experimental conditions described herein, a satisfactory separation of ATP and dGTP was obtained (Figure. 1). Thus, this procedure provides a solution to the simultaneous quantification of intracellular RNs and dRNs.
Table 2.
Levels of RNs normalized with cell volume.
| Compound | Retention time (min) |
PANC1 | H1975 | HepG2 | H23 |
|---|---|---|---|---|---|
| pmol/106cell | |||||
| ATP | 37.2 | 6190±536 | 7316 ± 343 | 4959 ± 588 | 6409 ± 397 |
| ADP | 22.2 | 349±321 | 316 ± 29 | 1161 ± 181 | 348 ± 38 |
| AMP | 15.0 | 132±201 | 120 ± 8 | 557 ± 89 | 87 ± 11 |
| GTP | 40.1 | 2464±128 | 3544 ± 110 | 1956 ± 167 | 3608 ± 200 |
| GDP | 22.1 | 152±16 | 176 ± 9 | 324 ± 13 | 165 ± 14 |
| GMP | 13.6 | 25±2 | 22 ± 1 | 197 ± 30 | 19 ± 3 |
| CTP | 30 | 3221±275 | 2731 ± 51 | 669 ± 68 | 3180 ± 108 |
| CDP | 19.7 | 112±13 | 89 ± 15 | 89 ± 10 | 102 ± 14 |
| CMP | 9.21 | 340±33 | 422 ± 28 | 402 ± 56 | 532 ± 45 |
| UTP | 40.3 | 3980±111 | 5480 ± 270 | 3093 ± 382 | 4544 ± 101 |
| UDP | 21.6 | 166±10 | 197 ± 18 | 484 ± 68 | 121 ± 13 |
| UMP | 11.2 | 54±5 | 86 ± 7 | 407 ± 42 | 42 ± 4 |
Note: Each data point is an average of two independent experiments (done in triplicate) and is reported as mean ± standard deviation.
Table 3.
Profile of deoxyribonucleotide pool normalized with ATP.
| Compound | Retention time(min) |
ionization mode |
linear range(pmol) |
PANC1 | 1975 | HepG2 | H23 |
|---|---|---|---|---|---|---|---|
| pmol/106cell | |||||||
| dATP | 39.5 | negative | 0.25 - 60 | 28.50±1.56 | 16.57 ± 0.89 | 4.24 ± 0.34 | 12.75 ± 0.84 |
| dADP | 23.1 | negative | 0.072 - 5.6 | 0.65±0.07 | 0.28 ± 0.04 | 0.00 ± 0.00 | 0.00 ± 0.00 |
| dAMP | 16.6 | negative | 0.0086 - 1.36 | 0.08±0.01 | 0.03 ± 0.00 | 0.08 ± 0.02 | 0.00 ± 0.00 |
| dGTP | 41.0 | positive | 0.25 - 60 | 15.77±0.72 | 7.60 ± 0.40 | 7.40 ± 0.72 | 7.07 ± 0.56 |
| dGDP | 23.6 | positive | 0.082-10.4 | 2.69±0.19 | 1.06 ± 0.07 | 1.37 ± 0.20 | 0.96 ± 0.25 |
| dGMP | 15.3 | positive | 0.1 - 12.8 | UDL* | UDL* | UDL* | UDL* |
| dCTP | 30.8 | negative | 0.25 - 60 | 18.54±1.00 | 7.96 ± 0.67 | 4.20 ± 0.40 | 9.12 ± 0.66 |
| dCDP | 20.2 | negative | 0.076-6.166 | UDL* | UDL* | UDL* | UDL* |
| dCMP | 10.6 | negative | 0.1 - 8 | 1.40±0.20 | 0.29 ± 0.04 | 1.45 ± 0.18 | 0.82 ± 0.05 |
| dUTP | 42.4 | negative | 0.95 - 38 | UDL* | UDL* | UDL* | UDL* |
| dUDP | 21.7 | negative | 0.1-16 | UDL* | UDL* | UDL* | UDL* |
| dUMP | 13.5 | negative | 0.1 - 8 | 6.36±1.12 | 8.15 ± 1.52 | 23.77 ± 4.79 | 3.55 ± 0.95 |
| TTP | 41.2 | negative | 0.25 - 60 | 91.64±4.26 | 62.12 ± 2.54 | 18.35 ± 1.63 | 68.32 ± 7.33 |
| TDP | 22.8 | negative | 0.42 - 9 | 20.23±2.28 | 13.74 ± 1.52 | 13.80 ± 1.80 | 11.72 ± 1.31 |
| TMP | 14.8 | negative | 0.0172 - 1.36 | 0.42±0.07 | 0.14±0.02 | 0.95 ± 0.18 | 0.17 ± 0.03 |
Note: Each data point is an average of two independent experiments (done in triplicate) and is reported as mean ± standard deviation.
UDL, under detected limit of assay.
Figure 1.
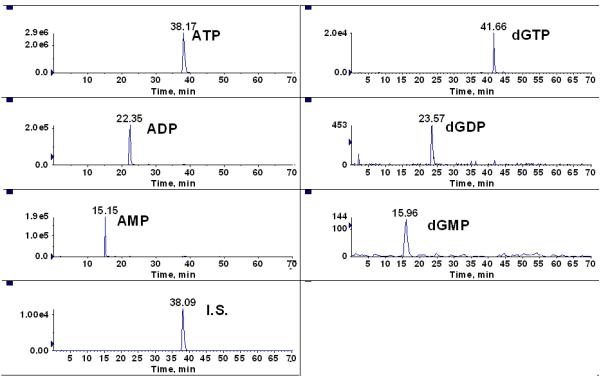
MRM chromatography of adenosine ribonucleotides (ATP, ADP, AMP) and guanosine deoxyribonucleotides (dGTP, dGDP, dGMP).
We used the addition calibration method for the preparation of the calibration curves for the standards for the respective RNs and dRNs [4, 10]. The best line of fit for each curve was determined using a regression analysis. The lower limit of quantification (LLOQ) of the assay was sufficient for the quantification of all 12 RNs and 15 dRNs in each cell line studied.
3.2 Variations in the ribonucleotides and deoxyribonucleotides pool size of four cancer cell lines
Using the above methodology, RN and dRN pool sizes were measured in PANC1, H1975, HepG2, and H23 cells. As anticipated, the RN levels in each cell line was significantly greater than that of dRNs (Tables 1-3), and the respective pool sizes varied from one cell line to another. The variation persisted when the pool size was normalized with the volume of the cell (Table 2). The order of RN pool size from the highest to the lowest was H1975 > PANC1 >H23 > HepG2. Of note, we did not observe significant differences in ATP levels. However, we observed differences in the energy charge of the individual cell lines. The energy charge was defined as the concentration of ATP divided by the concentration of ADP in each cell line. The energy charge was 23, 18, 18, and 4 for H1975, PANC1, H23, and HepG2, respectively (Table 1B). Adenosine ribonucleotides constituted the highest portion of the RN pool size in each cell line followed by uridine, guanosine, and cytidine. We observed a monotonic increase in concentration from the mono-, di-, to tri-phosphate metabolites for all the RNs except for cytosine where CMP levels were higher than CDP.
Table 1A.
Levels of RNs in human cancer cell lines.
| Compound | Ionization mode |
Linear range(pmol) | PANC1 | H1975 | HepG2 | H23 |
|---|---|---|---|---|---|---|
| pmol/106cell | ||||||
| ATP | negative | 77 - 9240 | 6190±536 | 10157±476 | 3159± 75 | 4434±275 |
| ADP | negative | 6.5 - 650 | 349±321 | 439±41 | 740 ± 115 | 241±26 |
| AMP | negative | 7.5 - 750 | 132±201 | 167±12 | 355 ± 56 | 60±8 |
| GTP | negative | 25 - 1000 | 2464±128 | 4920±153 | 1246 ± 106 | 2496±139 |
| GDP | negative | 1.8 - 142 | 152±16 | 245±13 | 207 ± 8 | 114±10 |
| GMP | negative | 1.2 - 96 | 25±2 | 31±1 | 125 ± 19 | 13±2 |
| CTP | negative | 6.4 - 640 | 3221±275 | 3791±71 | 427 ± 44 | 2200±75 |
| CDP | negative | 1.75 - 140 | 112±13 | 123±21 | 56 ± 6 | 71±10 |
| CMP | negative | 2.5 - 200 | 340±33 | 586±39 | 256 ± 36 | 368±31 |
| UTP | negative | 7 - 350 | 3980±111 | 7608±375 | 1971 ± 244 | 3143±70 |
| UDP | negative | 5 - 200 | 166±10 | 273±25 | 308 ± 43 | 84±9 |
| UMP | negative | 1.4 - 54 | 54±5 | 120±10 | 259 ± 27 | 29±3 |
Note: Each data point is an average of two independent experiments (done in triplicate) and is reported as mean ± standard deviation.
Table 1B.
General properties of human cancer cell lines.
| PANC1 | H1975 | HepG2 | H23 | |
|---|---|---|---|---|
| Cell volume (uM3)* | 7312 | 10152 | 4659 | 5059 |
| ATP/ADP | 17.76 | 23.14 | 4.27 | 18.44 |
| ATP/dATP | 217 | 374 | 1458 | 486 |
| GTP/dGTP | 156 | 394 | 330 | 493 |
| CTP/dCTP | 174 | 290 | 199 | 337 |
Note: this data point is an average
We observed significant variation in the dRN pool sizes. Since the ATP concentration did not differ much from cell to cell, we normalized the dRNs pool size with ATP (Table 3). The order of the total dRNs pool size in each of the cell lines from the highest to the lowest was PANC1 > H1975 > H23 > HepG2. The relative levels of each dRN was thymidine > adenosine > guanosine > cytidine > uridine. The triphosphate metabolite was the highest followed by the diphosphate metabolite for thymidine, deoxyadenosine, and deoxyguanosine. The concentrations of dGMP, dCDP, dUTP, and dUDP in each of the cell lines were below the limit of detection of the assay. Interestingly, dUMP was the only deoxyribonucleotide monophosphate metabolite that was larger than its respective triphosphate metabolite. PANC1 cells expressed the highest concentration of dATP, while H23 cells had the least amount of dAMP and dADP compared with the other three cell lines.
We next investigated whether the general properties of a given cell line could explain the observed differences in RN and dRN pool sizes. The variables considered were cell volume, energy charge, and NTP/dNTP ratios (Table 1B). In order of decreasing cell volume, H1975 > PANC1> HepG2 >H23. The size or the volume of a cell was directly proportional to the concentration of ATP in the cell. However, no apparent relationship was observed between ATP and energy charge or NTP/dNTP ratios.
3.3 Perturbation of dRN pool size by hypoxia in PANC1 cells
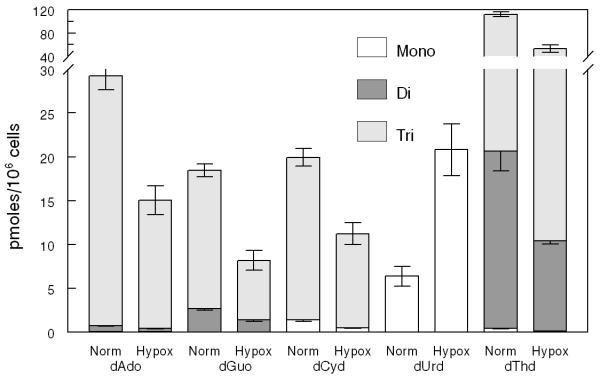
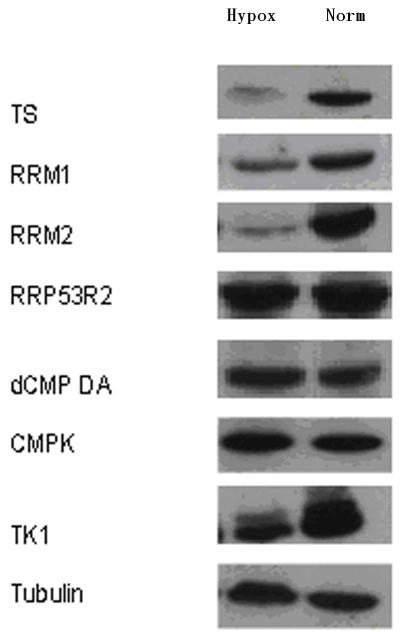
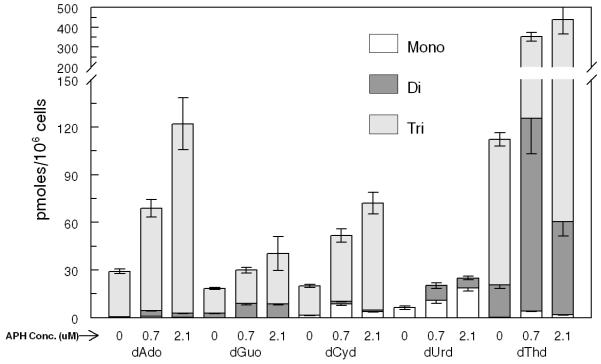
PANC1 cells were cultured under hypoxic conditions (1% oxygen), and dRNs were extracted and quantified as described in the Methods section. Under hypoxic conditions, the pool size of all the RNs except ATP and GTP decreased compared with the pool size under normoxic conditions (data not shown). Furthermore, the dRNs pool size decreased with hypoxic treatment except that of dUMP, which increased by about 2-fold under hypoxia (Figure 2A, B). To further investigate these observations, we determined the expression of some of the key enzymes involved in the metabolic pathways of dRNs (Figure 2C). The expression of RRM1 and RRM2, which are responsible for the conversion of NDP to dNDP, decreased during hypoxia. Furthermore, the expression of TS, which is responsible for the conversion of dUMP to dTMP, was significantly decreased during hypoxic conditions. The expression of TK-1 also decreased under hypoxic conditions. In contrast, hypoxia did not alter the expressions of dCMPDA, CMPK, and RRP53R2 (Figure 2C).
Figure 2.
(A) Representative profile of deoxyribonucleotides (dRNs) in the PANC1 cell line under hypoxia (Hypox) and normoxia (Norm) conditions. (B) Percent decrease in dRNs pool under hypoxia. Each data point is an average of two independent experiments (done in triplicate) and is reported as mean ± standard deviation. (C) Western blot analysis of the effect of hypoxia on expression of metabolic enzymes (Thymidylate synthase (TS), ribonucleotide reductase subunits M1 (RRM1) and M2 (RRM2), P53-controlled ribonucleotide reductase (RRP53R2), dCMP deaminase (dCMPDA), CMP kinase (CMPK) and Thymidine kinase-1 (TK-1)) in PANC1 cells using tubulin as control. Mono(monophosphate), Di (Diphosphate), Tri (triphosphate), dAdo (deoxyadenosine), dGuo (deoxyguanosine),dCyd (deoxycytidine), dUrd (deoxyuridine) and dThd (thymidine)
3.4 Alteration of deoxyribonucleotide pool size by inhibitors of DNA synthesis
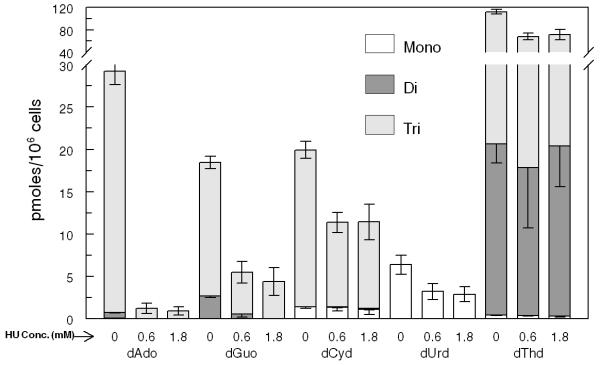
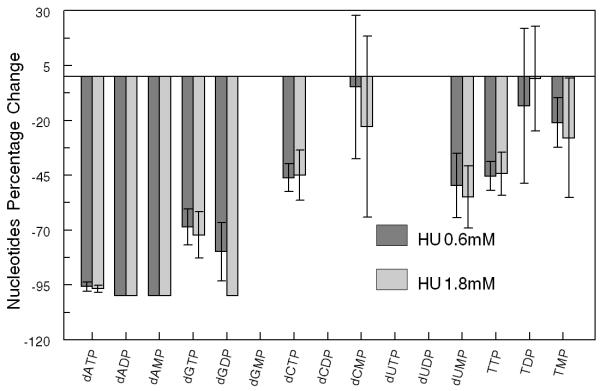
We examined the effect of hydroxyurea (HU) treatment on dRN pool sizes. HU is a well-established anticancer agent that inhibits DNA synthesis by specifically inhibiting the subunit RRM2 of RR, resulting in blocking of de novo synthesis of dRNs [17]. We observed a significant reduction in the pool size of all the dRNs when cells were treated with 0.6 mM (ID50) of HU (Fig. 3A). No significant dose effect was observed when cells were treated with 1.8 mM (3×ID50) of HU (Fig. 3B).
Figure 3.
(A) Representative profile of deoxyribonucleotides (dRNs) in PANC1 cells treated without and with hydroxyurea (HU) − 0.6 (1×ID50) and 1.8 mM (3×ID50). (B) Percent decrease in dRNs after treatment of PANC1 cells with 0.6 and 1.8 mM of HU. Each data point is an average of two independent experiments (done in triplicate) and is reported as mean ± standard deviation.
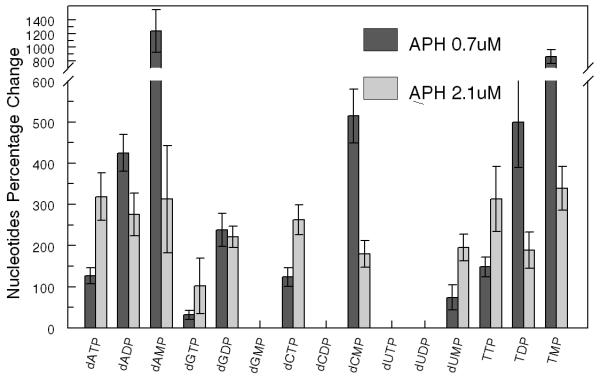
Aphidicolin (APH) is a reversible inhibitor of eukaryotic nuclear DNA replication, which blocks the cell cycle in the early S phase [18, 19]. The effect of APH treatment on PANC1 cell dRNs pool size was studied. PANC1 cells were cultivated with either 0.7 μM (ID50) or 2.1 μM (3×ID50) of APH. As seen in figure 4, APH treatment increased all the dRNs pool size, except that of dUTP, in a dose-dependent manner. At the same time, the dCDP and dUDP increased from 0 to 0.23 and 1.73 pmol/1×106 cells with 0.7 μM APH treatment and to 0.17 and 1.16 pmol/1×106 cells with 2.1 μM APH treatment, respectively. In contrast, no dose-dependent effect was observed with respect to APH treatment on dNMP and dNDP pool sizes.
Figure 4.
(A) Representative profile of deoxyribonucleotides (dRNs) in the PANC1 cells treated without and with aphidicolin (APH) − 0.7 (1×ID50) and 2.1. μM (3×ID50) (B) Percent increase in dRNs pool after treatment of PANC1 cells with 0.7 and 2.1. μM of APH. Each data point is an average of two independent experiments (done in triplicate) and is reported as mean ± standard deviation.
4. Discussion
As has been shown in previous studies, we observed large variations in the levels of RNs and dRNs in each of the four cancer cell lines studied [20-22]. There was a monotonic increase in concentration from mono-, di-, to tri-phosphate for each of the dRNs except for deoxycytidine and deoxyuridine. The concentration of dCMP was higher than the concentration of dCDP. Since dCMP is a precursor of TTP, which is essential for DNA synthesis, it is conceivable that dCDP is converted into dCMP by a unique dCDP phosphatase, thereby resulting in intracellular accumulation of dCMP. This hypothesis is currently the focus of further investigation in our laboratory. In all cells, the dUMP pool was greater than dUTP. This finding is consistent with the fact that the presence of dUTP phosphate catalyzes the degradation of dUTP to dUMP to maintain a high TTP/dUTP ratio, which is critical to avoid incorporation of uracil into DNA and cause DNA strand breaks through activity of uracil N-glycosidase and apurine endonuclease.[23]
Hypoxic tumor cells are present in solid tumors such as pancreatic cancer and lung cancer, and these cells are usually resistant to radiotherapy and chemotherapy. We observed a significant decrease in each of the dRN metabolites, except for dUMP, in PANC1 cells under hypoxic conditions. The decrease in the expression of RRM1 and RRM2 may be, at least in part, responsible for this observation. There was a 2-fold increase in dUMP under hypoxic conditions. The expression of TS, which is responsible for the conversion of dUMP to TMP, decreased under hypoxia (Fig 2C). This observation could be partly responsible for the accumulation of dUMP and depletion of the thymidine nucleotide pools under hypoxic conditions.
To further validate our assay, we studied the effect of known inhibitors of DNA synthesis on pool size in PANC1 cells. Hydroxyurea (HU) treatment results in inhibition of DNA synthesis through its effects as an inhibitor of RR without interfering with the synthesis of ribonucleic acid or of protein [17]. As expected, we observed a decrease in all four dRNs with HU treatment. However, levels of deoxyadenosine and deoxyguanosine ribonucleotides were decreased more sharply in our experiment. This finding suggests that HU has a greater impact on deoxyadenosine, and deoxyguanosine ribonucleotides. No significant differences were observed when cells were treated with different concentrations of HU (e.g. 1×ID50 and 3×ID50). This observation may be due to the relatively short duration of treatment with HU, only three-hour. Aphidicolin (APH) is a specific inhibitor of DNA polymerase-α [18], and drug treatment increased the dNTP pools in a dose-dependent manner but not for dNDP or dNMP pool in PANC1 cells. These observations are consistent with the expected mechanisms of action of APH as an inhibitor of DNA polymerase. The alteration of different dRNs was not to the same extent, a finding that could be due to the complex mechanism of feedback regulation of dRN metabolites and the associated DNA synthesis enzymes including RR, dCMP deaminase, etc. These studies are beyond the present scope of this work and are the subject of further investigation.
In summary, the methodology reported herein using LC/MS/MS allows for simultaneous quantification of all dRNs in cellular extracts prepared by a simple procedure. We observed that different cell lines have different profiles of dRNs. The data obtained from PANC1 cells in response to hypoxia, HU, and APH are consistent with the known effects of these treatment conditions. This assay can also be used to study the dynamics of interaction between endogenous dRNs and the respective metabolites of nucleoside analogs used for cancer chemotherapy and HIV chemotherapy, and in so doing, enhance our understanding of how these analogs work and may predict nucleoside analog efficacy and toxicity.
Acknowledgement
This work was supported by Public Health Service grants AI-38204 from NIAID and RO1CA63477 from NCI to Y.C.C. Y.C.C. is a fellow of the National Foundation for Cancer Research. E.P was supported by grant K08AI074404 from NIAID.
Footnotes
Publisher's Disclaimer: This is a PDF file of an unedited manuscript that has been accepted for publication. As a service to our customers we are providing this early version of the manuscript. The manuscript will undergo copyediting, typesetting, and review of the resulting proof before it is published in its final citable form. Please note that during the production process errors may be discovered which could affect the content, and all legal disclaimers that apply to the journal pertain.
References
- [1].Fagny C, Vandevelde M, Svoboda M, Robberecht P. Ribonucleotide reductase and thymidine phosphorylation: two potential targets of azodicarbonamide. Biochem Pharmacol. 2002;64:451–6. doi: 10.1016/s0006-2952(02)01185-1. [DOI] [PubMed] [Google Scholar]
- [2].Chen P, Chai Y. Dynamics of cAMP/cGMP in patients under a stress state. Chin J Traumatol. 2002;5:115–7. [PubMed] [Google Scholar]
- [3].Horvath Z, Hochtl T, Bauer W, Fritzer-Szekeres M, Elford HL, Szekeres T, et al. Synergistic cytotoxicity of the ribonucleotide reductase inhibitor didox (3,4-dihydroxy-benzohydroxamic acid) and the alkylating agent carmustine (BCNU) in 9L rat gliosarcoma cells and DAOY human medulloblastoma cells. Cancer Chemother Pharmacol. 2004;54:139–45. doi: 10.1007/s00280-004-0795-0. [DOI] [PubMed] [Google Scholar]
- [4].Hennere G, Becher F, Pruvost A, Goujard C, Grassi J, Benech H. Liquid chromatography-tandem mass spectrometry assays for intracellular deoxyribonucleotide triphosphate competitors of nucleoside antiretrovirals. J Chromatogr B Analyt Technol Biomed Life Sci. 2003;789:273–81. doi: 10.1016/s1570-0232(03)00099-0. [DOI] [PubMed] [Google Scholar]
- [5].Solter AW, Handschumacher RE. A rapid quantitative determination of deoxyribonucleoside triphosphates based on the enzymatic synthesis of DNA. Biochim Biophys Acta. 1969;174:585–90. doi: 10.1016/0005-2787(69)90288-3. [DOI] [PubMed] [Google Scholar]
- [6].Yegian CD. A procedure for the measurement of intracellular deoxyribonucleoside triphosphate pools by thin layer chromatography. Anal Biochem. 1974;58:231–7. doi: 10.1016/0003-2697(74)90462-x. [DOI] [PubMed] [Google Scholar]
- [7].Piall EM, Aherne GW, Marks V. The quantitative determination of 2′-deoxycytidine-5′-triphosphate in cell extracts by radioimmunoassay. Anal Biochem. 1986;154:276–81. doi: 10.1016/0003-2697(86)90526-9. [DOI] [PubMed] [Google Scholar]
- [8].Shewach DS. Quantitation of deoxyribonucleoside 5′-triphosphates by a sequential boronate and anion-exchange high-pressure liquid chromatographic procedure. Anal Biochem. 1992;206:178–82. doi: 10.1016/s0003-2697(05)80030-2. [DOI] [PubMed] [Google Scholar]
- [9].Cohen S, Megherbi M, Jordheim LP, Lefebvre I, Perigaud C, Dumontet C, et al. Simultaneous analysis of eight nucleoside triphosphates in cell lines by liquid chromatography coupled with tandem mass spectrometry. J Chromatogr B Analyt Technol Biomed Life Sci. 2009;877:3831–40. doi: 10.1016/j.jchromb.2009.09.030. [DOI] [PubMed] [Google Scholar]
- [10].Chi J, Jayewardene A, Stone J, Gambertoglio JG, Aweeka FT. A direct determination of thymidine triphosphate concentrations without dephosphorylation in peripheral blood mononuclear cells by LC/MS/MS. J Pharm Biomed Anal. 2001;26:829–36. doi: 10.1016/s0731-7085(01)00469-1. [DOI] [PubMed] [Google Scholar]
- [11].Paintsil E, Dutschman GE, Hu R, Grill SP, Lam W, Baba M, et al. Intracellular metabolism and persistence of the anti-human immunodeficiency virus activity of 2′,3′-didehydro-3′-deoxy-4′-ethynylthymidine, a novel thymidine analog. Antimicrob Agents Chemother. 2007;51:3870–9. doi: 10.1128/AAC.00692-07. [DOI] [PMC free article] [PubMed] [Google Scholar]
- [12].Ferraro P, Bianchi V, Biasin MR, Celotti L. Deoxynucleotide pools and DNA synthesis in resting and PHA-stimulated human lymphocytes treated with mutagens. Exp Cell Res. 1992;199:349–54. doi: 10.1016/0014-4827(92)90444-d. [DOI] [PubMed] [Google Scholar]
- [13].Iwasaki H, Huang P, Keating MJ, Plunkett W. Differential incorporation of ara-C, gemcitabine, and fludarabine into replicating and repairing DNA in proliferating human leukemia cells. Blood. 1997;90:270–8. [PubMed] [Google Scholar]
- [14].Coulier L, Bas R, Jespersen S, Verheij E, van der Werf MJ, Hankemeier T. Simultaneous quantitative analysis of metabolites using ion-pair liquid chromatography-electrospray ionization mass spectrometry. Anal Chem. 2006;78:6573–82. doi: 10.1021/ac0607616. [DOI] [PubMed] [Google Scholar]
- [15].Cai Z, Song F, Yang MS. Capillary liquid chromatographic-high-resolution mass spectrometric analysis of ribonucleotides. J Chromatogr A. 2002;976:135–43. doi: 10.1016/s0021-9673(02)01155-x. [DOI] [PubMed] [Google Scholar]
- [16].Van Moorsel CJ, Smid K, Voorn DA, Bergman AM, Pinedo HM, Peters GJ. Effect of gemcitabine and cis-platinum combinations on ribonucleotide and deoxyribonucleotide pools in ovarian cancer cell lines. Int J Oncol. 2003;22:201–7. doi: 10.3892/ijo.22.1.201. [DOI] [PubMed] [Google Scholar]
- [17].Van Rompay AR, Johansson M, Karlsson A. Phosphorylation of nucleosides and nucleoside analogs by mammalian nucleoside monophosphate kinases. Pharmacol Ther. 2000;87:189–98. doi: 10.1016/s0163-7258(00)00048-6. [DOI] [PubMed] [Google Scholar]
- [18].Kurose A, Tanaka T, Huang X, Traganos F, Dai W, Darzynkiewicz Z. Effects of hydroxyurea and aphidicolin on phosphorylation of ataxia telangiectasia mutated on Ser 1981 and histone H2AX on Ser 139 in relation to cell cycle phase and induction of apoptosis. Cytometry A. 2006;69:212–21. doi: 10.1002/cyto.a.20241. [DOI] [PubMed] [Google Scholar]
- [19].Fukuda M, Ohashi M. Aphidicolin inhibits cell growth by accumulation of G2 cells. Cell Biol Int Rep. 1983;7:579–85. doi: 10.1016/0309-1651(83)90111-x. [DOI] [PubMed] [Google Scholar]
- [20].Smitskamp-Wilms E, Pinedo HM, Veerman G, van Haperen VW Ruiz, Peters GJ. Postconfluent multilayered cell line cultures for selective screening of gemcitabine. Eur J Cancer. 1998;34:921–6. doi: 10.1016/s0959-8049(97)10125-3. [DOI] [PubMed] [Google Scholar]
- [21].Traut TW. Physiological concentrations of purines and pyrimidines. Mol Cell Biochem. 1994;140:1–22. doi: 10.1007/BF00928361. [DOI] [PubMed] [Google Scholar]
- [22].van Moorsel CJ, Bergman AM, Veerman G, Voorn DA, van Haperen VW Ruiz, Kroep JR, et al. Differential effects of gemcitabine on ribonucleotide pools of twenty-one solid tumour and leukaemia cell lines. Biochim Biophys Acta. 2000;1474:5–12. doi: 10.1016/s0304-4165(99)00209-3. [DOI] [PubMed] [Google Scholar]
- [23].Gadsden MH, McIntosh EM, Game JC, Wilson PJ, Haynes RH. dUTP pyrophosphatase is an essential enzyme in Saccharomyces cerevisiae. EMBO J. 1993;12:4425–31. doi: 10.1002/j.1460-2075.1993.tb06127.x. [DOI] [PMC free article] [PubMed] [Google Scholar]


