

Abstract
Background
The effects of dietary polyunsaturated (PUFAs) and monounsaturated fatty acids (MUFAs) on intestinal cytokinetics within the context of colon cancer initiation and progression have been extensively studied. n-3 PUFAs have received the most attention due to their potential protective role. However, further investigation of the epigenetic perturbations caused by fatty acids in the context of colon cancer development is needed.
Methods
We used DNA microarrays to identify discriminative gene signatures (gene combinations) for the purpose of classifying n-3 PUFA-fed, carcinogen-injected, Sprague–Dawley rats at the initiation and progression stages. Animals were assigned to three dietary treatments differing only in the type of fat (corn oil/n-6 PUFA, fish oil/n-3 PUFA, or olive oil/n-9 monounsaturated fatty acid).
Results
The effects of diet on colonic mucosal gene expression signatures during tumor initiation and progression were subsequently compared (12 h and 10 weeks after azoxymethane injection). Microarray analysis revealed that the number of differentially expressed (DE) genes in each of the three diet comparisons increased with the progression of colon cancer. Each dietary lipid source exhibited its own unique transcriptional profile, as assessed by linear discriminant analysis. Applying this novel approach, we identified the single genes and the two- to three-gene combinations that best distinguished the dietary treatment groups. For the chemoprotective (fish oil) diet, mediators of stem cell homeostasis, e.g., ephrin B1 and bone morphogenic protein 4, were the top-performing gene classifiers.
Conclusions
These results suggest that dietary chemoprotective n-3 PUFA impact genes that regulate the colon stem cell niche and tumor evolution.
Keywords: Chemoprevention, Cancer initiation and progression, Fish oil, Linear discriminant analysis
Background
Second only to lung cancer, colon cancer is a major cause of cancer death in the United States [1]. Environmental factors, including diet, influence both colon cancer initiation and promotion [2]. Epidemiologic, clinical, and laboratory animal-based studies indicate that the type of dietary fat modulates colon tumor development. Specifically, diets rich in n-6 polyunsaturated fatty acids (PUFAs) enhance the development of colon tumors [3-5], whereas n-3 PUFA-containing diets reduce colon cancer incidence [2, 4, 6-8]. This is significant because the typical Western diet contains 10–20 times more n-6 than n-3 PUFA. Furthermore, it has been suggested that diets containing appreciable levels of monounsaturated fatty acids (MUFAs), e.g., olive oil, may also have chemopreventive activity against colon carcinogenesis [9-11]. Other studies indicate that MUFAs do not modulate tumor progression [12]. The underlying mechanisms by which dietary fat composition exerts tumor-enhancing or inhibitory effects have been under examination [12-21], and some mechanisms at the molecular level are beginning to emerge. For example, rats that received injections of colon carcinogen, (azoxymethane, AOM) and fed n-3 PUFA-containing diets, have higher levels of colonocyte apoptosis compared to n-6 PUFA-fed rats, in part due to alterations in mitochondrial membrane composition and reactive oxygen species generation [15, 18].
Since it is difficult to study the subtle global and site-specific epigenetic mechanisms involved in colon tumor development, we utilized a highly relevant rat colon cancer model in combination with an unbiased microarray approach to help decipher the changes in gene expression due to fish oil/n-3 PUFA, corn oil/n-6 PUFA, and olive oil/n-9 MUFA feeding. Due to the fact that dietary factors may differentially act at the initiation and promotion/progression phases [3, 4], we examined the effects of the three types of fatty acids at both the earliest stage (12 h) of carcinogenesis, as well as during a later stage (10 weeks) when preneoplastic changes are occurring. These times were selected because critical phenotypic changes, e.g., cell cycle activity, apoptosis and the formation of high multiplicity aberrant crypt foci, occur at these points in the chronology of cancer development [22, 23].
We demonstrate for the first time that there is a clear time-dependent, divergent regulation of gene expression signatures in response to the fatty acid content of the diet. In addition, as opposed to using expression levels of either significantly increased or decreased genes, we applied a novel linear discriminator algorithm in order to identify the best single genes and two- to three-gene combinations for distinguishing rats fed the chemoprotective fish oil diet.
Methods
Animals
Thirty weanling male Sprague–Dawley rats (Harlan, Houston, TX) were acclimated for 1 week in a temperature- and humidity-controlled facility on a 12-h light/dark cycle. The animal use protocol was approved by the University Animal Care Committee of Texas A&M University and conformed to NIH guidelines. The study was a 3 × 2 factorial design with three types of dietary fat (n-6 PUFA, n-3 PUFA, or n-9 MUFA), and two time points (12 h and 10 weeks after first injection). All rats were injected with azoxymethane (AOM) in order to induce tumorigenesis. Animals were stratified by body weight after the acclimation period so that mean initial body weights did not differ. Body weight and food intake were monitored during the study.
Diets
After a 1-week acclimation period on a standard pelleted diet, rats were assigned to one of three diet groups, which differed only in type of fat. The diets contained (g/100 g diet): dextrose, 51.06; casein, 22.35; D,L-methionine, 0.34; AIN-76 salt mix, 3.91; AIN-76 vitamin mix, 1.12; choline chloride, 0.22; and pectin, 6.00. The total fat content of each diet was 15% by weight as follows: n-6 diet, 15.00 g corn oil/100 g diet; n-3, 11.50 g fish oil/100 g diet; and 3.50 g corn oil/100 g diet; n-9 MUFA, 11.50 g olive oil/100 g diet and 3.5 g corn oil/100 g diet. The fat sources were chosen based on their different fatty acid content, with the corn oil diet being enriched in n-6 PUFA, the fish oil diet enriched in n-3 PUFA, and the olive oil diet enriched in n-9 MUFA. The fish oil and olive oil diets each contained 3.5% corn oil to ensure that essential fatty acid requirements were met. To prevent formation of oxidized lipids, diets were stored at −20°C and freely provided to the animals fresh each day. Corn oil, ultra-refined marine lipids (containing 18% 20:5n-3 and 11% 22:6n-3), and olive oil were obtained from Degussa BioActives (Champaign, IL). To protect against lipid oxidation during storage, 0.025% tertiary butylhydroquinone and mixed tocopherols (MTS-50; ADM, Decatur, IL) were added to the oils. Mixed tocopherols were added to the fish and olive oils so that total tocopherol levels were equivalent to the endogenous level in the corn oil (0.7 mg/g oil).
Carcinogen Treatment
After 3 weeks on the experimental diets, ten rats per diet group received injections of AOM (Sigma, St. Louis, MO) s.c. at 15 mg/kg body weight. Four to five rats per diet/treatment group were killed 12 h after AOM injection. The remaining rats received a second AOM injection 1 week later and were terminated 10 weeks after the first AOM injection.
RNA Isolation
Upon termination, each colon (4–5 rats per diet treatment/time group) was resected proximally at the junction between the cecum and colon and distally at the rectum. The colon was opened longitudinally, flushed clean with PBS, and scraped with a glass slide to remove the mucosal layer, which was placed into denaturation solution (Totally RNA kit; Ambion, Austin, TX), homogenized on ice with a Teflon-in-glass homogenizer, and frozen at −80°C until RNA was isolated using the Totally RNA kit followed by DNase treatment (DNA Free; Ambion). After isolation, RNA integrity was assessed using an Agilent 2100 Bioanalyzer (Agilent, Palo Alto, CA). mRNA obtained from each animal was considered as a sample point and was hybridized on a separate microarray.
Gene Expression Bioarrays
The Applied Microarray (Tempe, AZ) CodeLink™ system using the UniSetRat I Expression Bioarray, containing 9,028 genes probes, was used to generate colonic global transcription profiles. This array contains a broad range of genes derived from publicly available, well-annotated mRNA sequences. The CodeLink array is unique in being capable of detecting minimal differences in gene expression, as low as 1.3-fold with 95% confidence [51]. One array per animal was used, ×4–5 rats per diet treatment/time group for each time point (12 h and 10 weeks).
Target Preparation and Array Hybridization
All reagents were provided in the CodeLink expression assay kit (Applied Microarray), except where noted. cRNA synthesis was performed as per the manufacturer’s instructions using 10 μg of total RNA. First-strand cDNA was generated using Superscript II reverse transcriptase and a T7 primer. Subsequently, second-strand cDNA was produced using Escherichia coli DNA polymerase I and RNase H. The resultant double-stranded cDNA was purified on a QIAquick column (Qiagen, Valencia, CA) and cRNA was generated via an in vitro transcription reaction using T7 RNA polymerase and biotin-11-UTP (PerkinElmer, Boston, MA). cRNA was purified using an RNeasy column (Qiagen), quantified by UV spectrophotometry, and fragmented by heating at 94°C for 20 min in the presence of magnesium. The fragmented cRNA was hybridized overnight at 37°C in hybridization buffer to a UniSet Rat I Bioarray in an Innova 4080 shaking incubator (New Brunswick, Edison, NJ) at 300 rpm. After hybridization, the arrays were washed followed by incubation with streptavidin-Alexa 647 (Molecular Probes, Eugene, OR). Images were captured on an Axon GenePix Scanner (Arlington, TX) using CodeLink Expression Scanning Software and were analyzed using CodeLink Expression Analysis Software. Raw intensity values from each array were adjusted using a global median normalization method. Differentially expressed genes were identified by fold change combined with the required significance value.
Linear Discriminant Analysis (LDA)
In addition to classical statistical analysis, we performed LDA classification analysis to determine if classifiers based on feature/gene sets of sizes one, two, and three can discriminate between the different dietary treatments. LDA is a technique developed for the purpose of statistical pattern recognition [52, 53]. Using a selected list of features, it aims at constructing a discriminating hyperplane that separates the observations from two different classes with a minimum misclassification error [40]. In the setting of microarray expression data, the features of interest are the individual genes represented on the microarray. The discriminating hyperplane can be constructed every time a specific combination of genes is selected. Thus, a main challenge in applying LDA to gene expression sets is the appropriate feature selection, which allows for determination of the optimal discriminating hyperplane. The topperforming feature sets are identified based on this measure of misclassification. To avoid the problems associated with feature selection [41, 52, 53], we used a previously established list of 250 colonic biomarkers as an initial feature set [40]. From this list, 187 biomarkers matched the probes on the rat CodeLink array. Thus, we were able to exhaustively search all possible combinations of one, two, and three genes, and rank them with respect to their bolstered resubstitution misclassification error [40]. The top-performing features sets were identified based on this measure of misclassification.
Statistics
Statistical analysis including data homoskedasticity assessment was performed using GeneSifter software (http://www.geospiza.com). Pair-wise Student’s t-test was performed between the three dietary fatty acids: n-3 PUFA, n-6 PUFA, and n-9 MUFA. Microarray data were median normalized and log-transformed before running the statistical test. Differentially expressed (DE) genes were obtained in three comparisons of interest: Fish-Olive oil, Fish-Corn oil, and Corn-Olive oil at each time point. Genes that were differentially expressed (p < 0.05) between diets from each time point were used for functional categorization based on the statistical association between genes and each pathway (ArrayXpath™) as assessed by Fisher’s exact test (http://www.snubi.org/software/ArrayXPath/) [54]. By importing lists of differentially expressed genes, pathways with p values less than the 0.05 threshold were considered significantly affected by diet and time. Gene annotation and data can be accessed at GEO (GSE25912) in accordance with MIAME guidelines. To validate expression patterns, we performed real-time PCR on RNA from four animals per diet/treatment/time point as previously described [22].
Results and Discussion
Since we have previously demonstrated that dietary n-3 PUFA suppress colon tumorigenesis [3, 7, 22], experiments were designed to examine corn oil and olive oil effects relative to the chemoprotective diet (fish oil) in the presence of carcinogen. Therefore, fish oil was used as a baseline diet and contrasted against corn oil and olive oil (i.e., fish oil divided by corn oil or olive oil expression level) gene expression profiles at 12 h and 10 weeks. With respect to functional mapping of gene expression signatures, the steady-state mRNA expression level does not always accurately reflect the status of critical signaling proteins. In these cases, control is exerted at the epigenetic level of recruitment of mRNAs to polysomes, the factories of ribosomes that mediate efficient translation of many cellular messages. Since we have recently demonstrated that transcriptional alterations are far more extensive relative to translational alterations in mediating the effects of diet [23], we have focused on mRNA analyses.
The DE genes in AOM-injected rats fed the three different diets at two time points (12 h and 10 weeks) were initially annotated. The numbers of DE genes together with the direction, up or down-regulated, are shown in Table 1. A Venn diagram documenting the overlap of DE genes in the treatment groups is shown in Fig. 1. Interestingly, there were noticeable divergent effects of the three fatty acid sources on the global colonic gene expression profiles. Specifically, the results from Table 1 indicate that as time progressed following AOM exposure, the number of DE expressed genes in each of the three diet comparisons increased. Moreover, each pair-wise diet comparison exhibited a large and unique (for that comparison) set of DE genes, which was evident for both time points (see below for details). These results suggest that regardless of the chemoprotective potential, each dietary lipid source has its own specific genomic signature in the presence of carcinogen (AOM) exposure.
Table 1.
Effect of diet on differentially expressed genes at the tumor initiation and progression time points
| Comparison | 12 h (initiation) | 10 weeks (progression) |
|---|---|---|
| Fish oil versus olive oila | Up: 398 | Up: 1,315 |
| Down: 411 | Down: 546 | |
| Fish oil versus corn oila | Up: 288 | Up: 149 |
| Down: 409 | Down: 1,430 | |
| Olive oil versus corn oilb | Up: 751 | Up: 1,953 |
| Down: 539 | Down: 21 |
Rats were injected with AOM and terminated 12 h or 10 weeks later. Values represent the mean number of significantly (p < 0.05) up and down-regulated genes across treatment groups, n = 4-5 per diet group
Represents relative expression level in the colon of fish oil-fed rats divided by expression in olive or corn oil fed rats
Represents relative expression level in the colon of olive oil-fed rats divided by expression in corn oil fed rats
Fig. 1.
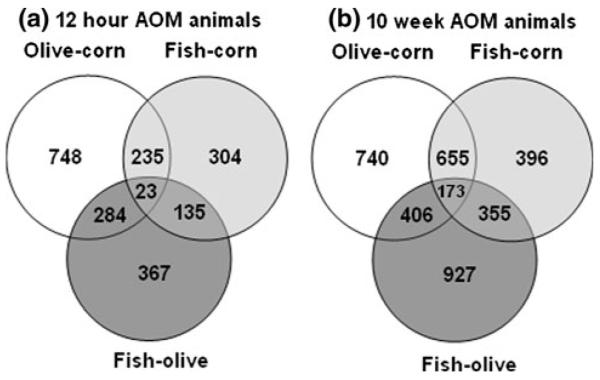
Overlap of differentially expressed (p < 0.05) genes across treatment groups. a DE gene overlap at the initiation stage (12 h) for three pair-wise comparisons: Fish oil versus olive oil, fish oil versus corn oil, and olive oil versus corn oil. In total, 23 DE genes were common for all three pair-wise comparisons. b DE gene overlap at the progression stage (10 weeks) for the three pair-wise comparisons. In total, 173 DE genes were common for all three pair-wise comparisons
Diet Differentially Influences Genetic Signatures During Colon Cancer Initiation and Progression
The experimental protocol enabled us to identify subtle regulatory relationships among DE genes inversely expressed at the initiation as compared to progression time point (Fig. 2). Specifically, for the fish oil versus olive oil diet comparison at 12 h and 10 weeks, 257 genes were common DE over the time course. Out of these 257 genes, 184 were unaffected by time in terms of the direction of regulation (up or down). However, out of the 257 genes, 73 exhibited an opposite (inverse) fold-regulation (Supplementary Table 1). For example, at 12 h, Tenascin C (Tnc) was down-regulated in fish oil-fed animals (0.4 fold, fish oil expression value divided by olive oil) and upregulated at the 10-week stage (1.4 fold). In contrast, there were 250 DE genes (out of 283 common genes across time points) that showed the same trend in fold change at both time points in the fish oil versus corn oil comparison. Out of 283 genes, 33 displayed opposite (inverse) regulation (Supplementary Table 2). With respect to the olive oil versus corn oil comparison, there were 322 common DE genes at 12 h versus 10 weeks, out of which 93 displayed opposite (inverse) fold expression and 229 exhibited a consistent fold change direction, i.e., unchanged (Supplementary Table 3). Of the time-dependent, inversely regulated DE genes, for the fish oil versus olive oil comparison (Supplementary Table 1), Suppressor of cytokine signaling 3 (Socs3) was down-regulated at 12 h (0.7 fold) and up-regulated at 10 weeks (1.3 fold). Socs3 can modulate cytokine action in intestinal epithelial cells (IEC), and therefore may protect against crypt hyperplasia and neoplasia [24]. In contrast, the reverse scenario was observed with regard to ephrin B3 (Efnb3), which was up-regulated at 12 h and down-regulated at 10 weeks (Supplementary Table 1). Ephrin ligands direct cellular localization and migratory behavior with the crypt [25]. Additional inversely regulated DE genes for the fish oil versus corn oil and olive oil versus corn oil comparisons are shown in Supplementary Tables 2 and 3, respectively. NADPH oxidase 1 (Nox1) is another example of an inversely regulated DE gene, i.e., up-regulated at 12 h (1.2 fold) and down-regulated at 10 weeks (0.8 fold) (Supplementary Table 2). This is noteworthy because Nox1 over-expression has been implicated in both the promotion of mitogenesis and suppression of apoptosis, suggesting that aberrant expression of Nox1 could contribute to the development of colorectal cancer. Nox1 protein is over-expressed in colon cancer and is strongly correlated with activating K-ras mutations [26].
Fig. 2.

Pair-wise comparison of the three dietary treatments over time. a Overlap of DE genes in the fish oil versus olive oil diet comparison at the 12-h and 10-week stages. In total, 697 (513 + 184) genes were differentially expressed at 12 h and 1,506 (1,322 + 184) at 10 weeks. Of these, 184 genes were found common, and 73 exhibited opposite fold regulation. b Overlap of DE genes in fish oil versus corn oil diet comparison at the 12-h and 10-week stages. In total, 250 genes were found common out of which 33 exhibited opposite fold regulation. c Overlap of DE genes in the olive oil versus corn oil diet comparison at the 12-h and 10-week stages. In total, 229 genes were found common out of which 93 exhibited opposite fold regulation
An explanation as for why dietary lipids regulate gene expression in an opposite-fold manner over time may be derived from the progression of tumor evolution. Temporal modeling of key genetic and phenotypic events in human sporadic and rodent AOM-induced colorectal cancer has been largely delineated [27, 28]. At the initiation time point, profound changes occur with respect to cell cycle arrest, early induction of nuclear aberrations, and the triggering of apoptosis [29]. These acute effects of carcinogen reach a maximum at 24 h and persist for days [30]. As alterations in AOM-induced colonic lesions progress with time, additional molecular events ensue, resulting in distinct perturbations in gene expression [28]. Therefore, it is not surprising that diet should differentially impact the expression of genes in the early versus later steps of colon carcinogenesis. Since the evolution of lethal colon cancer evolves in a similar manner in humans [27], the differential impact of lipid source has important implications for understanding how chemoprotective diets modulate human tumor pathogenesis.
In order to further probe the biological relevance of DE genes, we determined which biological pathways were significantly different in each pair-wise diet comparison. ArrayXpath™ software (http://www.snubi.org/software/ArrayXPath/) was used for this purpose. This program utilizes microarray gene expression data and, via probe identifiers, searches major public pathway resources such as GenMAPP (http://www.genmapp.org), KEGG (http://www.genome.jp/kegg) and BioCarta (http://cgap.nci.nih.gov/Pathways/BioCarta_Pathways). By computing the statistical association between genes and each pathway using Fisher’s exact test, pathways with p values less than the 0.05 threshold were identified. For example, there were 367 genes uniquely modulated for the fish oil–olive oil comparison at 12 h (Fig. 1). For the same comparison at 10 weeks, there were 927 DE genes. While there were no pathways that were significantly (p < 0.05) enriched for the 367 DE genes from the fish oil–olive oil comparison at 12 h, there were three significantly enriched pathways for the 927 DE gene comparisons at 10 weeks: (i) Alanine and aspartate metabolism—(glutamic-oxaloacetic transaminase 1 (Got1), glutamic-pyruvate transaminase (Gpt), and pyruvate carboxylase (Pc)). This pathway was queried using the KEGG database and ranked first with a p value of 0.0098. Interestingly, aspartate aminotransferase encoded by the Got1 gene is known to be elevated in colon cancer cells [31]; (ii) The oxidative phosphorylation pathway consisted of—(NADH dehydrogenase (ubiquinone) 1 alpha subcomplex 5 (Ndufa5), cytochrome c oxidase subunit IV isoform 1(Cox4i1), NADH dehydrogenase (ubiquinone) Fe–S protein 6 (Ndufs6), ATPase, H transporting, lysosomal V1 subunit F (Atp6v1f), ATP synthase, H+ transporting, and mitochondrial F0 complex, subunit E (Atp5i)). This pathway had a p value of 0.0176. It is tempting to speculate that oxidative phosphorylation is important in the context of our results since carcinogenesis generally involves a suppressed apoptosis (energy-dependent) phenotype [32]. Impaired oxidative phosphorylation has been observed in colorectal tumor cells [33]. The final pathway (iii) included ubiquinone biosynthesis−(NADH dehydrogenase (ubiquinone) 1 alpha subcomplex 5 (Ndufa5), NADH dehydrogenase (ubiquinone) Fe–S protein 6 (Ndufs6), and protein geranylgeranyltransferase type I, beta subunit (Pggt1b)), with a p value of 0.0242. Relevant genes, such as NADH dehydrogenase (ubiquinone) Fe–S protein 3, are associated with the mitochondrial electron transport chain, which has been linked to tumorigenicity [34].
With respect to the 304 DE genes specific to the fish oil–corn oil comparison at 12 h (Fig. 1), there were two significantly (p < 0.05) enriched biological pathways: (i) purine metabolism (phosphodiesterase 4B (Pde4b), pyruvate kinase (Pkm2), natriuretic peptide receptor A (Npr1), polymerase (RNA) I polypeptide B (Polr1b), and guanine deaminase (Gda), with a p value = 0.0223. In addition, the pyruvate metabolism pathway (malic enzyme 1, NADP (+)-dependent (Me1), and pyruvate kinase (Pkm2)) from the KEGG database had a p value of 0.0276. This is noteworthy, because cancer cells tend to have reduced oxidative phosphorylation in mitochondria, and exhibit increased glycolysis. Indeed, tumor tissues exclusively express the embryonic M2 isoform of pyruvate kinase (Pkm2) [35]. M2 expression is necessary for aerobic glycolysis and this metabolic phenotype provides a selective growth advantage for tumor cells in vivo [36].
Of the 396 DE genes specific to the fish oil–corn oil comparison at 10 weeks (Fig. 1), only one statistically significant pathway emerged: propanoate metabolism (aldehyde dehydrogenase family 1, subfamily A7 (Aldh1a7), and acetyl-coenzyme A carboxylase alpha (Acaca)), p = 0.049. It is noteworthy that metastatic tissue exhibits a decreased expression of several genes in propanoate metabolism compared to normal colon tissue [37]. In contrast, for the 748 DE genes specific for corn oil–olive oil comparison at 12 h, there was only one significantly enriched pathway: pyrimidine metabolism—(5′ nucleotidase (Nt5e), deoxycytidine kinase (Dck), polymerase (RNA) II (DNA directed) polypeptide F (Polr2f), and non-metastatic cells 3 (Nme3), with a p value = 0.0266. Typically, many drugs target de novo pyrimidine synthesis for the purpose of inducing tumoricidal activity [38]. Of the 740 DE genes specific for the same comparison at 10 weeks, only the D-arginine and D-ornithine metabolism—(glyceraldehyde-3-phosphate dehydrogenase (Gapdh), and D-amino-acid oxidase (Dao1)) pathway was enriched with a p value of 0.0427. Ornithine metabolism is a critical regulator of the tumorigenic response [39], and its modulation profoundly impacts AOM-induced biochemical changes and aberrant crypt foci formation [39]. In summary, these results demonstrate the usefulness of comparing the effect of chemopreventive agents at different stages of carcinogen-induced colon tumorigenesis.
Classification of Dietary Lipid Treatment Using a Linear Discriminant Algorithm
In order to further elucidate the mechanisms by which dietary fat composition modulates colon cancer risk, we utilized a systems biology approach involving computational linear discriminant analysis (LDA) to identify the best single genes and two- to three-gene combinations for distinguishing the transcription profiles from rats fed n-3 PUFA, n-6 PUFA, and n-9 MUFA. We have shown that LDA can be used to obtain feature sets that categorize samples based on the expression values of genes [40]. During the classification process, estimating the classification error is of critical importance when the number of potential feature sets is large. In addition, when the sample size is limited, an error estimator may have a large variance and therefore may often be low. This can produce many feature sets and classifiers with low error estimates [41]. We mitigated this problem by applying bolstered error estimation [40]. The number of genes (features) for each linear classifier was limited to three, which allowed for an exhaustive search, and thus avoided errors associated with the small-sample setting. We identified the top ten single, two, and three-gene classifiers to distinguish diets (fish oil, corn oil, and olive oil) at the two time points (12 h and 10 weeks) (Supplementary Tables 4–9). The classification results demonstrate that there are several cases where single genes can provide good (in terms of the error estimate) classification. However, when considering these features as part of two or three-gene classifiers, we observed a significant decrease in the classification error. To estimate the improvements of the classification performance, we introduced two quantities for each feature set: εbolstered and Δεbolstered. εbolstered denotes the bolstered resubstitution error for the LDA classifier for the respective feature set of size n, and Δεbolstered denotes the decrease in error with respect to the highest ranked of its subsets of features (in the list of features of size n-1, n = 2, 3). The feature sets were ranked based on the value of εbolstered.
Having obtained multiple lists of the best-performing gene classifiers for each diet pair-wise comparison at each time point (12 h and 10 weeks) (Supplementary Tables 4–9), we generated a Venn diagram summarizing the overlap of the top-performing single-, two-, and three-gene diet classifiers (Supplementary Fig. 1). Consistent with our hypothesis, we demonstrate for the first time that fish-, corn-, and olive oil-containing diets exhibit unique feature (gene) sets, implying that n-3, n-6, and n-9 dietary fatty acids uniquely regulate colon cancer initiation and progression.
Classification of a Uniquely Chemoprotective (Fish Oil) Diet Using Linear Discriminant Analysis
We have previously demonstrated that fish oil containing n-3 PUFA beneficially modulates the balance between colonic DNA adduct formation, epithelial cell apoptosis, as well as aberrant crypt and tumor formation [22, 23]. This effect is due to the direct action of n-3 PUFA and not to a reduction in n-6 or n-9 fatty acid content. As a follow-up to these studies, in order to identify the best discriminative molecular signatures, i.e., “chemoprotective” gene combinations, we examined the effect of fish oil treatment versus other (corn plus olive oil). At the initiation, 12-h time point, the top single-gene classifier (one feature), phospholipase C gamma 1 (Plcg1) (ranked 1 in the list of single-gene classifiers), had an estimated classification error of 0.1096 (Table 2). Interestingly, when Plcg1 was combined with ephrin B1 (Efnb1) and natriuretic peptide precursor A (Nppa), it resulted in a three-gene classifier with a much lower estimated error of 0.0199 (Fig. 3a). Indeed, the high frequency with which both Plcg1 and Efnb1 appear in the classification table suggest that these genes react coordinately in response to fish oil treatment. Increased levels of the phosphoinositide-specific Plcg1 protein have been reported to play an important role in colon carcinogenesis [42]. In addition, Plcg1 is up-regulated by AOM treatment [43] and fish oil feeding suppresses both its expression and activity [44, 45]. Eph/Eprhin molecules maintain cellular boundaries and regulate the correct position of cells within the stem cell niche [25]. Hence, a major finding of the study is that chemoprotective n-3 PUFA may be influencing a critical signaling pathway, which promotes cell cycle reentry of stem/progenitor cells and regulates mitogenic activity in the colon. Further studies are needed in order to better understand how the colonic stem cell population responds to diet and carcinogen exposure.
Table 2.
Classification of fish oil versus other (corn and olive oil) fed mice at the initiation stage (12 h)
| 1 feature | 2 features | 3 features | ε bolstered | Δ ε bolstered |
|---|---|---|---|---|
| Plcg1 | 0.1096 | |||
| Efnb1 | 0.1126 | |||
| Arg2 | 0.1402 | |||
| Rbbp9 | 0.1496 | |||
| Gstt2 | 0.18 | |||
| Gsr | 0.1916 | |||
| G6pdx | 0.2013 | |||
| Gpx4 | 0.2043 | |||
| Men1 | Ca3 | 0.046 | 0.1779 | |
| Plcg1 | Efnb1 | 0.0641 | 0.0455 | |
| Myc | Efnb1 | 0.069 | 0.0436 | |
| Notch1 | Efnb1 | 0.0707 | 0.0419 | |
| Bmpr2 | Efnb1 | 0.0735 | 0.0391 | |
| Bdkrb2 | Bmp4 | 0.0758 | 0.242 | |
| Bdkrb2 | Gja1 | 0.076 | 0.2237 | |
| Plcg1 | Vdr | 0.0774 | 0.0322 | |
| Efnb1 | Arg2 | 0.078 | 0.0346 | |
| Nppa | Plcg1 | Efnb1 | 0.0199 | 0.0442 |
| Cacnb4 | Men1 | Ca3 | 0.0266 | 0.0194 |
| Bcl2l2 | Men1 | Ca3 | 0.0291 | 0.0169 |
| Kras2 | Men1 | Ca3 | 0.0322 | 0.0138 |
| Sell | Men1 | Ca3 | 0.0323 | 0.0137 |
| Men1 | CA3 | Bcl2l2 | 0.0323 | 0.0137 |
| Alox5 | Men1 | Ca3 | 0.033 | 0.013 |
| Pla2g5 | Men1 | Ca3 | 0.0331 | 0.0129 |
| tnfrsf11b | Men1 | Ca3 | 0.0335 | 0.0125 |
| hoxa1 | Men1 | Ca3 | 0.0337 | 0.0123 |
The top 10 single, pair-wise, and triplet-wise gene LDA classifiers are shown. εbolstered denotes bolstered resubstitution error for the respective classifier; the classifiers are ranked according to that error measurement. Δεbolstered denotes the decrease in error for each feature set relative to its highest ranked subset of features
Fig. 3.

Linear discriminant analysis of dietary phenotype using a three-gene classification model. a Fish oil versus other (corn and olive oil) at the initiation (12-h) stage. Phospholipase C gamma 1 (Plcg1), ephrin B1 (Efnb1), and natriuretic peptide precursor A (Nppa) provided the best-performing three-gene feature set. The three-dimensional LDA hyperplane discriminates between fish oil (circles) and corn oil plus olive oil (triangles) fed rats (see Table 2 for additional details). Axes represent normalized intensity values of the corresponding genes. b Fish oil versus other (corn and olive oil) at the progression (10-week) stage. Bradykinin receptor B2 (Bdkrb2), carcinoembryonic antigen-related cell adhesion molecule 3 (Ceacam3), and bone morphogenetic protein 4 (Bmp4) together provided best three-gene classifier (see Table 3 for additional details)
With respect to the progression stage (10 weeks post-AOM injection) of colon cancer development, carbonic anhydrase 3 (CA3) was the top single gene classifier with an estimated error rate of 0.0929 (Table 3). CA3 regulates intracellular pH and may protect cells from oxidative stress [46]. Interestingly, bradykinin receptor B2 (Bdkrb2), carcinoembryonic antigen-related cell adhesion molecule 3 (Ceacam3), and bone morphogenetic protein 4 (Bmp4) together provided the best three-gene classifier with improvement in estimated error rate (0.0172) (Fig. 3b). Bdkrb2 has the potential to promote malignant transformation due in part to its role in regulating vascular permeability and cell proliferation [47, 48]. Recent evidence suggests that bone morphogenic proteins (BMPs) localize to distinct membrane domains and are important in both intestinal development and homeostasis [49]. It is also noteworthy that BMPs coordinately regulate intestinal stem cells and their progeny, in part by controlling stem cell renewal as well as lineage commitment and terminal differentiation [25]. We interpret the Ceacam3 result in the following way. Since the colonic epithelium was isolated by scraping, which removes both mucosal epithelial cells and lamina propria containing a complex mixture of cell types, it is not unexpected that granulocyte signatures were detected. Ceacam3 is an innate immune receptor targeted against human-specific pathogens, which is exclusively expressed on granulocytes, and innate immune recognition is implicated in colon cancer [50]. Since tumorigenesis bears the stamp of inflammation and tissue repair, there now appears to be a link between innate immunity homeostasis and colon tumor initiation and progression. Our data suggest that the dietary lipid source can influence this relationship.
Table 3.
Classification of fish oil versus other (corn and olive oil) fed mice at the progression stage (10 weeks)
| 1 feature | 2 feature | 3 feature | ε bolstered | Δ ε bolstered |
|---|---|---|---|---|
| Ca3 | 0.0923 | |||
| Grem1 | 0.1064 | |||
| Pik3r1 | 0.1391 | |||
| Cacnb4 | 0.1649 | |||
| ERK1 | 0.1695 | |||
| Ptger1 | 0.1734 | |||
| elk | 0.1787 | |||
| Bdkrb2 | 0.1852 | |||
| Pla2g2c | 0.1969 | |||
| Egf | 0.2013 | |||
| Bdkrb2 | Bmp4 | 0.0354 | 0.1498 | |
| Bdkrb2 | Gja1 | 0.0433 | 0.1419 | |
| Bdkrb2 | hoxa1 | 0.0446 | 0.1406 | |
| Bdkrb2 | Serpinh2 | 0.0557 | 0.1295 | |
| Bdkrb2 | Tgfb1 | 0.056 | 0.1292 | |
| Men1 | Ca3 | 0.0569 | 0.0354 | |
| elk | Bdkrb2 | 0.0577 | 0.1275 | |
| Bdkrb2 | Ceacam3 | 0.0629 | 0.1223 | |
| elk | Pla2g2c | 0.0633 | 0.1336 | |
| Col18a1 | Bdkrb2 | 0.0744 | 0.1108 | |
| Bdkrb2 | Ceacam3 | Bmp4 | 0.0172 | 0.0182 |
| elk | Bdkrb2 | Serpinh2 | 0.0181 | 0.0376 |
| elk | Bdkrb2 | Bmp4 | 0.0182 | 0.0172 |
| Cacnb4 | Bdkrb2 | Tgfb1 | 0.0208 | 0.0352 |
| Bdkrb2 | Ceacam3 | Serpinh2 | 0.0209 | 0.0348 |
| Cacnb4 | Bdkrb2 | Bmp4 | 0.0214 | 0.014 |
| elk | Bdkrb2 | Pkcb | 0.0217 | 0.036 |
| Bdkrb2 | Bmp4 | Tgfb1 | 0.0218 | 0.0136 |
| Itgb7 | Bdkrb2 | Bmp4 | 0.0231 | 0.0123 |
| Bdkrb2 | Bmp4 | Serpinh2 | 0.0231 | 0.0123 |
The top 10 single, pair-wise, and triplet-wise gene LDA classifiers are shown. εbolstered denotes bolstered resubstitution error for the respective classifier; the classifiers are ranked according to that error measurement. Δεbolstered denotes the decrease in error for each feature set relative to its highest ranked subset of features
Conclusions
In summary, we have previously demonstrated that the chemopreventive effect of fish oil is due to the direct action of n-3 PUFA and not to a reduction in the content of n-6 and n-9 fatty acids [22]. We have expanded on the effects of these fatty acid classes by demonstrating that there is a distinct gene expression signature associated with each dietary lipid class. In addition, it is evident that gene expression profiles are temporally modulated and grow increasingly divergent during early colonic tumor development. Interestingly, even though both olive oil (containing n-9 MUFA) and corn oil (containing n-6 PUFA) diets similarly promote cancer risk [22], these lipids have a distinct impact on transcriptional profiling. Finally, assessment of fish oil-induced changes to the mucosal transcriptome using linear discriminant analysis (three-gene combinations), suggests that n-3 PUFA may uniquely regulate stem cell signaling pathways.
Supplementary Material
Acknowledgments
We thank Jennifer Goldsby from the Center for Environmental & Rural Health Genomics and Bioinformatics Core for technical assistance. This study was supported by NIH grants CA59034 and CA129444.
Abbreviations
- AOM
Azoxymethane
- DE
Differentially expressed
- LDA
Linear discriminant analysis
- MUFA
Monounsaturated fatty acids
- PUFA
Polyunsaturated fatty acids
Footnotes
Electronic supplementary material The online version of this article (doi:10.1007/s10620-011-1652-8) contains supplementary material, which is available to authorized users.
Contributor Information
Priyanka Kachroo, Department of Veterinary Integrative Biosciences, Texas A&M University, College Station, TX 77843-4458, USA PKachroo@cvm.tamu.edu.
Ivan Ivanov, Department of Veterinary Physiology and Pharmacology, Texas A&M University, 422C VMR Bldg, College Station, TX 77843-4466, USA iivanov@cvm.tamu.edu.
Laurie A. Davidson, Program in Integrative Nutrition and Complex Diseases, Kleberg Center, Center for Environmental and Rural Health, Texas A&M University, College Station, TX 77843-2253, USA l-davidson@tamu.edu
Bhanu P. Chowdhary, Department of Veterinary Integrative Biosciences, Texas A&M University, College Station, TX 77843-4458, USAbchowdhary@cvm.tamu.edu
Joanne R. Lupton, Program in Integrative Nutrition and Complex Diseases, Kleberg Center, Center for Environmental and Rural Health, Texas A&M University, College Station, TX 77843-2253, USA jlupton@tamu.edu
Robert S. Chapkin, Program in Integrative Nutrition and Complex Diseases, Kleberg Center, Center for Environmental and Rural Health, Texas A&M University, College Station, TX 77843-2253, USA
References
- 1.Jemal A, Siegel R, Xu J, Ward E. Cancer statistics, 2010. CA Cancer J Clin. 2010 September/October;60 doi: 10.3322/caac.20073. [DOI] [PubMed] [Google Scholar]
- 2.Potter JD, Slattery ML, Bostick RM, Gapstur SM. Colon cancer: a review of the epidemiology. Epidemiol Rev. 1993;15:499–545. doi: 10.1093/oxfordjournals.epirev.a036132. [DOI] [PubMed] [Google Scholar]
- 3.Jia Q, Lupton JR, Smith R, et al. Reduced colitis-associated colon cancer in Fat-1 (n-3 fatty acid desaturase) transgenic mice. Cancer Res. 2008;68:3985–3991. doi: 10.1158/0008-5472.CAN-07-6251. [DOI] [PMC free article] [PubMed] [Google Scholar]
- 4.Reddy BS, Burill C, Rigotty J. Effect of diets high in omega-3 and omega-6 fatty acids on initiation and postinitiation stages of colon carcinogenesis. Cancer Res. 1991;51:487–491. [PubMed] [Google Scholar]
- 5.Turk HF, Kolar SS, Fan YY, Cozby CA, Lupton JR, Chapkin RS. Linoleic acid and butyrate synergize to increase Bcl-2 levels in colonocytes. Int J Cancer. 2010;128:63–71. doi: 10.1002/ijc.25323. [DOI] [PMC free article] [PubMed] [Google Scholar]
- 6.Anti M, Armelao F, Marra G, et al. Effects of different doses of fish oil on rectal cell proliferation in patients with sporadic colonic adenomas. Gastroenterology. 1994;107:1709–1718. doi: 10.1016/0016-5085(94)90811-7. [DOI] [PubMed] [Google Scholar]
- 7.Chang WL, Chapkin RS, Lupton JR. Fish oil blocks azoxyme-thane-induced rat colon tumorigenesis by increasing cell differentiation and apoptosis rather than decreasing cell proliferation. J Nutr. 1998;128:491–497. doi: 10.1093/jn/128.3.491. [DOI] [PubMed] [Google Scholar]
- 8.Cheng J, Ogawa K, Kuriki K, et al. Increased intake of n-3 polyunsaturated fatty acids elevates the level of apoptosis in the normal sigmoid colon of patients polypectomized for adenomas/tumors. Cancer Lett. 2003;193:17–24. doi: 10.1016/s0304383502007176. [DOI] [PubMed] [Google Scholar]
- 9.Bartoli R, Fernádez-Bañares F, Navarro E, et al. Effect of olive oil on early and late events of colon carcinogenesis in rats: modulation of arachidonic acid metabolism and local prosta-glandin E(2) synthesis. Gut. 2000;46:191–199. doi: 10.1136/gut.46.2.191. [DOI] [PMC free article] [PubMed] [Google Scholar]
- 10.Takeshita M, Ueda H, Shirabe K, Higuchi Y, Yoshida S. Lack of promotion of colon carcinogenesis by high-oleic safflower oil. Cancer. 1997;79:1487–1493. doi: 10.1002/(sici)1097-0142(19970415)79:8<1487::aid-cncr7>3.0.co;2-8. [DOI] [PubMed] [Google Scholar]
- 11.Tokudome S, Nagaya T, Okuyama H, et al. Japanese versus Mediterranean diets and cancer. Asian Pac J Cancer Prev. 2000;1:61–66. [PubMed] [Google Scholar]
- 12.Lee DY, Lupton JR, Aukema HM, Chapkin RS. Dietary fat and fiber alter rat colonic mucosal lipid mediators and cell proliferation. J Nutr. 1993;123:1808–1817. doi: 10.1093/jn/123.11.1808. [DOI] [PubMed] [Google Scholar]
- 13.Bancroft LK, Lupton JR, Davidson LA, et al. Dietary fish oil reduces oxidative DNA damage in rat colonocytes. Free Radic Biol Med. 2003;35:149–159. doi: 10.1016/s0891-5849(03)00240-5. [DOI] [PubMed] [Google Scholar]
- 14.Kolar SS, Barhoumi R, Callaway ES, et al. Synergy between docosahexaenoic acid and butyrate elicits p53-independent apoptosis via mitochondrial Ca2+ accumulation in human colon cancer cells and primary cultures of rat colonic crypts. Am J of Physiol Gastrointest Liver Physiol. 2007;293:G935–G943. doi: 10.1152/ajpgi.00312.2007. [DOI] [PMC free article] [PubMed] [Google Scholar]
- 15.Kolar SS, Barhoumi R, Lupton JR, Chapkin RS. Docosahexaenoic acid and butyrate synergistically induce colonocyte apoptosis by enhancing mitochondrial Ca2+ accumulation. Cancer Res. 2007;67:5561–5568. doi: 10.1158/0008-5472.CAN-06-4716. [DOI] [PubMed] [Google Scholar]
- 16.Davidson LA, Lupton JR, Jiang YH, Chang WC, Aukema HM, Chapkin RS. Dietary fat and fiber alter rat colonic protein kinase C isozyme expression. J Nutr. 1995;125:49–56. doi: 10.1093/jn/125.1.49. [DOI] [PubMed] [Google Scholar]
- 17.Davidson LA, Lupton JR, Jiang YH, Chapkin RS. Carcinogen and dietary lipid regulate ras expression and localization in rat colon without affecting farnesylation kinetics. Carcinogenesis. 1999;20:785–791. doi: 10.1093/carcin/20.5.785. [DOI] [PubMed] [Google Scholar]
- 18.Hong MY, Chapkin RS, Barhoumi R, et al. Fish oil increases mitochondrial phospholipid unsaturation, upregulating reactive oxygen species and apoptosis in rat colonocytes. Carcinogenesis. 2002;23:1919–1925. doi: 10.1093/carcin/23.11.1919. [DOI] [PubMed] [Google Scholar]
- 19.Hong MH, Chapkin RS, Davidson LA, et al. Fish oil enhances targeted apoptosis during colon tumor initiation in part by down regulating BCL-2. Nutr Cancer. 2003;46:44–51. doi: 10.1207/S15327914NC4601_06. [DOI] [PubMed] [Google Scholar]
- 20.Ng Y, Barhoumi R, Tjalkens RB, et al. The role of docosahexaenoic acid mediating mitochondrial membrane lipid oxidation and apoptosis in colonocytes. Carcinogenesis. 2005;26:1914–1921. doi: 10.1093/carcin/bgi163. [DOI] [PMC free article] [PubMed] [Google Scholar]
- 21.Pickering JS, Lupton JR, Chapkin RS. Dietary fat, fiber, and carcinogen alter fecal diacylglycerol composition and mass. Cancer Res. 1995;55:2293–2298. [PubMed] [Google Scholar]
- 22.Davidson LA, Nguyen DV, Hokanson RM, et al. Chemopreventive n-3 polyunsaturated fatty acids reprogram genetic signatures during colon cancer initiation and progression in the rat. Cancer Res. 2004;64:6797–6804. doi: 10.1158/0008-5472.CAN-04-1068. [DOI] [PMC free article] [PubMed] [Google Scholar]
- 23.Davidson LA, Nguyen DV, Hokanson RM, et al. Identification of actively translated mrna transcripts in a rat model of early stage colon carcinogenesis. Cancer Prev Res. 2009;2:984–994. doi: 10.1158/1940-6207.CAPR-09-0144. [DOI] [PMC free article] [PubMed] [Google Scholar]
- 24.Rigby RJ, Simmons JF, Greenhalgh CJ, Alexander WS, Lund PK. Suppressor of cytokine signaling 3 (SOCS3) limits damage-induced crypt hyper-proliferation and inflammation-associated tumorigenesis in the colon. Oncogene. 2007;26:4833–4841. doi: 10.1038/sj.onc.1210286. [DOI] [PubMed] [Google Scholar]
- 25.Scoville DH, Sato T, He XC, Li L. Current view: intestinal stem cells and signaling. Gastroenterology. 2008;134:849–864. doi: 10.1053/j.gastro.2008.01.079. [DOI] [PubMed] [Google Scholar]
- 26.Laurent E, McCoy JW, 3rd, Macina RA, et al. Nox1 is over-expressed in human colon cancers and correlates with activating mutations in K-Ras. Int J Cancer. 2008;123:100–107. doi: 10.1002/ijc.23423. [DOI] [PMC free article] [PubMed] [Google Scholar]
- 27.Jones S, Chen WD, Parmigiani G, et al. Comparative lesion sequencing provides insights into tumor evolution. Proc Natl Acad Sci USA. 2008;105:4283–4288. doi: 10.1073/pnas.0712345105. [DOI] [PMC free article] [PubMed] [Google Scholar]
- 28.Takahashi M, Wakabayashi K. Gene mutations and altered gene expression in azoxymethane-induced colon carcinogenesis in rodents. Cancer Sci. 2004;95:475–480. doi: 10.1111/j.1349-7006.2004.tb03235.x. [DOI] [PMC free article] [PubMed] [Google Scholar]
- 29.Hirose Y, Yoshimi N, Makita H, Hara A, Tanaka T, Mori H. Early alterations of apoptosis and cell proliferation in azoxymethane-initiated rat colonic epithelium. Jpn J Cancer Res. 1996;87:575–582. doi: 10.1111/j.1349-7006.1996.tb00262.x. [DOI] [PMC free article] [PubMed] [Google Scholar]
- 30.Wargovich MJ, Medline A, Bruce WR. Early histopathologic events to evolution of colon cancer in C57BL/6 and CF1 mice treated with 1, 2-dimethylhydrazine. J Natl Cancer Inst. 1983;71:125–131. [PubMed] [Google Scholar]
- 31.Otsuka M, Kato M, Yoshikawa T, et al. Differential expression of the L-plastin gene in human colorectal cancer progression and metastasis. Biochem Biophys Res Commun. 2001;289:876–881. doi: 10.1006/bbrc.2001.6047. [DOI] [PubMed] [Google Scholar]
- 32.Bedi A, Pasricha PJ, Akhtar AJ, et al. Inhibition of apoptosis during development of colorectal cancer. Cancer Res. 1995;55:1811–1816. [PubMed] [Google Scholar]
- 33.Cuezva JM, Krajewska M, de Heredia ML, et al. The bioenergetic signature of cancer. Cancer Res. 2002;62:6674–6681. [PubMed] [Google Scholar]
- 34.Mouat MF, Kolli K, Orlando R, Hargrove JL, Grider A. The effects of quercetin on SW480 human colon carcinoma cells: a proteomic study. Nutr J. 2005;4:11. doi: 10.1186/1475-2891-4-11. [DOI] [PMC free article] [PubMed] [Google Scholar]
- 35.Christofk HR, Vander Heiden MG, Harris MH, et al. The M2 splice isoform of pyruvate kinase is important for cancer metabolism and tumour growth. Nature. 2008;452:230–233. doi: 10.1038/nature06734. [DOI] [PubMed] [Google Scholar]
- 36.Gmeiner WH, Hellmann GM, Shen P. Tissue-dependent and - independent gene expression changes in metastatic colon cancer. Oncol Rep. 2008;19:245–251. [PubMed] [Google Scholar]
- 37.Potential clinical application of strategies to avert or overcome drug resistance. Available from: http://www.ncbi.nlm.nih.gov/bookshelf/br.fcgi?book=cmed6&part=A11408.
- 38.Giardiello FM, Casero RA, Jr, Hamilton SR, et al. Prostanoids, ornithine decarboxylase, and polyamines in primary chemoprevention of familial adenomatous polyposis. Gastroenterology. 2004;126:425–431. doi: 10.1053/j.gastro.2003.11.013. [DOI] [PMC free article] [PubMed] [Google Scholar]
- 39.Rao CV, Desai D, Simi B, Kulkarni N, Amin S, Reddy BS. Inhibitory effect of caffeic acid esters on azoxymethane-induced biochemical changes and aberrant crypt foci formation in rat colon. Cancer Res. 1993;53:4182–4188. [PubMed] [Google Scholar]
- 40.Zhao C, Ivanov I, Dougherty ER, et al. Noninvasive detection of candidate molecular biomarkers in subjects with a history of insulin resistance and colorectal adenomas. Cancer Prev Res. 2009;2:590–597. doi: 10.1158/1940-6207.CAPR-08-0233. [DOI] [PMC free article] [PubMed] [Google Scholar]
- 41.Zhao C, Bittner ML, Chapkin RS, Dougherty ER. Characterization of the effectiveness of reporting lists of small feature sets relative to the accuracy of the prior biological knowledge. Cancer Inform. 2010;9:49–60. doi: 10.4137/cin.s4020. [DOI] [PMC free article] [PubMed] [Google Scholar]
- 42.Nomoto K, Tomita N, Miyake M, Xhu DB, LoGerfo PR, Weinstein IB. Expression of phospholipases gamma 1, beta 1, and delta 1 in primary human colon carcinomas and colon carcinoma cell lines. Mol Carcinog. 1995;12:146–152. doi: 10.1002/mc.2940120306. [DOI] [PubMed] [Google Scholar]
- 43.Malecka-Panas E, Tureaud J, Majumdar AP. Enhanced ligand-induced activation of EGF-receptor and overall tyrosine kinase and phospholipase C in colonocytes isolated from azoxymethane-treated rats. Hepatogastroenterology. 1998;45:733–737. [PubMed] [Google Scholar]
- 44.Jiang YH, Lupton JR, Chang WC, Jolly CA, Aukema HM. Chapkin RS Dietary fat and fiber differentially alter intracellular second messengers during tumor development in rat colon. Carcinogenesis. 1996;17:1227–1233. doi: 10.1093/carcin/17.6.1227. [DOI] [PubMed] [Google Scholar]
- 45.Rao CV, Simi B, Wynn TT, Garr K, Reddy BS. Modulating effect of amount and types of dietary fat on colonic mucosal phospholipase A2, phosphatidylinositol-specific phospholipase C activities, and cyclooxygenase metabolite formation during different stages of colon tumor promotion in male F344 rats. Cancer Res. 1996;56:532–537. [PubMed] [Google Scholar]
- 46.Räisänen SR, Lehenkari P, Tasanen M, Rahkila P, Härkönen PL, Väänänen HK. Carbonic anhydrase III protects cells from hydrogen peroxide-induced apoptosis. FASEB J. 1999;13:513–522. doi: 10.1096/fasebj.13.3.513. [DOI] [PubMed] [Google Scholar]
- 47.Wu J, Akaike T, Hayashida K, et al. Identification of bradykinin receptors in clinical cancer specimens and murine tumor tissues. Int J Cancer. 2002;98:29–35. doi: 10.1002/ijc.10142. [DOI] [PubMed] [Google Scholar]
- 48.Zelawski W, Machnik G, Nowaczyk G, et al. Expression and localisation of kinin receptors in colorectal polyps. Int Immunopharmacol. 2006;6:997–1002. doi: 10.1016/j.intimp.2006.01.016. [DOI] [PubMed] [Google Scholar]
- 49.Hartung A, Bitton-Worms K, Rechtman MM, et al. Different routes of bone morphogenic protein (BMP) receptor endocytosis influence BMP signaling. Mol Cell Biol. 2006;26:7791–7805. doi: 10.1128/MCB.00022-06. [DOI] [PMC free article] [PubMed] [Google Scholar]
- 50.Rakoff-Nahoum S, Medzhitov R. Toll-like receptors and cancer. Nat Rev Cancer. 2009;9:57–63. doi: 10.1038/nrc2541. [DOI] [PubMed] [Google Scholar]
- 51.Ramakrishnan R, Dorris D, Lublinsky A, et al. An assessment of Motorola CodeLink microarray performance for gene expression profiling applications. Nucleic Acids Res. 2002;30:e30. doi: 10.1093/nar/30.7.e30. [DOI] [PMC free article] [PubMed] [Google Scholar]
- 52.Devroye L, Gyorfi L, Lugosi GA. Probabilistic Theory of Pattern Recognition. Springer-Verlag; New York: 1996. [Google Scholar]
- 53.Yousefi MR, Hua J, Sima C, Dougherty ER. Reporting bias when using real data sets to analyze classification performance. Bioinformatics. 2010;26:68–76. doi: 10.1093/bioinformatics/btp605. [DOI] [PubMed] [Google Scholar]
- 54.Chung HJ, Kim M, Park CH, Kim J, Kim JH. ArrayXPath: mapping and visualizing microarray gene-expression data with integrated biological pathway resources using scalable vector graphics. Nucleic Acids Res. 2004;32:W460–464. doi: 10.1093/nar/gkh476. [DOI] [PMC free article] [PubMed] [Google Scholar]
Associated Data
This section collects any data citations, data availability statements, or supplementary materials included in this article.