

Abstract
We used transgenic expression of capsid antigens to Theiler's murine encephalomyelitis virus (TMEV) to study the influence of VP1, VP2 or VP2121–130 to either protection or pathogenesis to chronic spinal cord demyelination, axonal loss and functional deficits during the acute and chronic phases of infection. We used both mice that are normally susceptible (FVB) and mice normally resistant (FVB.Db) to demyelination. Transgenic expression of VP2121–130 epitope in resistant FVB.Db mice caused spinal cord pathology and virus persistence because the VP2121–130 epitope is the dominant peptide recognized by Db, which is critical for virus clearance. In contrast, all three FVB TMEV transgenic mice showed more demyelination, inflammation and axonal loss as compared with wild‐type FVB mice, even though virus load was not increased. Motor function measured by rotarod showed weak correlation with total number of midthoracic axons, but a strong correlation with large‐caliber axons (>10 µm2). This study supports the hypothesis that expression of viral capsid proteins as self influences the extent of axonal pathology following Theiler's virus–induced demyelination. The findings provide insight into the role of axonal injury in the development of functional deficits that may have relevance to human demyelinating disease.
Keywords: axonal loss, capsid antigens, demyelination, Theiler's murine encephalomyelitis virus (TMEV)
INTRODUCTION
We have studied the Theiler's murine encephalomyelitis virus (TMEV) model of demyelination to understand the character of the immune response that contributes to myelin and axonal injury (9). We and other authors demonstrated that VP1 and VP2 capsid antigens of TMEV are critical for determining resistance vs. susceptibility to immune‐mediated demyelination. Resistant mice mount a protective immune response mediated in part by class I–restricted CD8+ T cells 1, 31, 32. Mice with H‐2Db haplotype are resistant and resolve the TMEV‐induced encephalitis because of a strong CD8+ T‐cell response that clears the virus and prevents virus persistence in the white matter of the spinal cord (23). In particular, peptide VP2121–130 is the immunodominant peptide recognized by the Db class I MHC antigen presenting molecule and critical for resistance against TMEV infection in animals of the BL (black) genetic background (11).
One unique aspect of TMEV‐induced disease is that the immune system is important for both resistance to virus infection, but also susceptibility to demyelination and subsequent development of neurologic deficits. Infection of the resistant strain results in acute encephalitis, but these mice do not develop clinical or pathologic signs of chronic demyelination in the spinal cord. However, immunosuppression of resistant strains of mice with sublethal gamma irradiation results in demyelination upon infection with TMEV (38). Moreover, depletion of T cells with anti‐CD4 or anti‐CD8 antibodies increases the frequency of paralysis and demyelination (38). Pathology is more extensive if all T cells are depleted with antibodies to CD3 (a pan T‐cell marker) or by combined treatment with antibodies to CD4 and CD8. In contrast, infected mice of a resistant strain that are depleted of natural killer (NK) cells in vivo develop diffuse encephalitis but no demyelination, indicating that NK cells protect from encephalitis, but other cells (most likely T cells) protect from demyelination (28). On the other hand, treatment of resistant mice with anti‐µ IgG, which depletes early B cells from birth, or infection of B cell–deficient mice that carry the xid mutation, or µ‐knockout mice, have no effect on the late demyelinating phase, even though some mice die early of encephalitis (37). Therefore, in resistant mice, both CD4+ and CD8+ T cells play an important role in resistance to TMEV‐induced demyelination, whereas NK cells and B cells play a role in resistance to encephalitis.
There is also evidence that immune cells contribute to demyelination. Even though small areas of demyelination are seen in nude mice 19, 42, indicating that TMEV can replicate and directly injure oligodendrocytes presumably without contribution of T cells, there is evidence that myelin destruction and neurologic disease are exacerbated by immune cells. For example, treatment with various immunosuppressive agents such as cyclophosphamide (18), anti‐lymphocyte serum (41), cyclosporine (33), monoclonal antibodies to T‐cell subsets 34, 48 or immune response gene products (IA) (35) results in less severe demyelinating disease. In addition, adoptive transfer of T cells into infected SCID mice results in widespread demyelination, proving that T cells contribute to pathogenesis (40).
To understand the contribution of immune response to capsid antigens on TMEV‐induced disease, we generated transgenic mice that express VP1, VP2 or VP2121–130 antigens under the control of the ubiquitin promoter. Mice were originally generated on the FVB background (H‐2Dq haplotype) that is susceptible to TMEV‐induced demyelination. Because of the difficulty in studying immune responses to virus in susceptible strains of mice, we crossed FVB transgenic mice to FVB.Db‐expressing mice, which are resistant to TMEV‐induced demyelination (1). By crossing the transgenic mice to the resistant FVB.Db strain, we were able to study the influence of transgenic expression of capsid proteins on tolerance to specific immune response (27). We previously showed that transgenic expression of both complete viral capsid protein VP2 and specific epitope VP2121–130 caused deletion of this response from the T‐cell repertoire in FVB.Db mice (27). This published work was done at early time points of the TMEV‐induced disease (27) and showed that genetic deletion of CD8+ T cells directed at VP2 and VP2121–130 resulted in abrogation of resistance with the subsequent development of virus persistence and chronic demyelination. In the present study, we performed a time course experiment and examined not only the early time points (21 and 45 dpi) but also the chronic time points (90, 180 and 270 dpi) in FVB.Db mice. We studied both FVB mice that are normally susceptible to TMEV infection and FVB.Db mice that are normally resistant to this disease. The main goal was to determine the influence of expression capsid antigens as self on the development of chronic axonal loss and permanent neurologic deficits in the susceptible FVB strain. This was important because of the critical role of axonal loss and it relationship to permanent neurologic deficits in multiple sclerosis (6).
MATERIALS AND METHODS
Mice
FVB/NJ (001800) mice were obtained from Jackson Laboratory (Bar Harbor, ME). FVB.Db mice were provided by Dr Larry Pease. A total of 1278 mice were used for this study. All animal protocols followed National Institutes of Health guidelines and were approved by the Mayo Foundation Institutional Care and Use Committee (IACUC).
Generation of TMEV transgenic mice
Transgenic mice were made as described previously (27). Transgenic mice were generated by cloning the coding sequence of each TMEV transgene into the eukaryotic expression vector pUB6, which contained an upstream human ubiquitin c promoter (Invitrogen, Carlsbad, CA). DNA was directionally cloned from the TMEV clone pDAFL3 using a BamHI site on the 5′ end of the cloned fragment and an EcoRV site on the 3′ end. The construct was cloned while maintaining the His Tag included in the vector, thereby allowing the identification of each transgene by this marker. The VP2121–130 construct was cut with BglII and NspI to release an expression fragment of length 1567 base pairs, which contained minimal vector sequence. This construct encoded a 33‐amino‐acid fragment that included the 10 amino acids comprising the immunodominant peptide plus five amino acids on the carboxyl and amino terminal ends to exclude the possibility that flanking amino acids may be necessary for loading the fragment onto class I molecules in the endoplasmic reticulum. In addition, the start codon in the context of an appropriate Kozak sequence were added on the 5′ end, which gave an additional methionine and aspartic acid residue on the amino terminus of the construct. Furthermore, an additional 11 amino acids were added on the carboxy terminus, which included a 5‐amino‐acid linker attached to the 6XHisTag. VP2 and VP1 constructs were cut with BglII and PvuII to yield fragments of 2352 and 2373 bp. The VP2 construct encoded a 279‐amino‐acid product, which included the 267 amino acids of VP2. The VP1 construct encoded a 286‐amino‐acid product, which included the 274 amino acids of VP1. All fragments were gel purified and sequenced before injection into embryos. Gel‐purified cDNA was injected into FVB embryos for implantation into pseudo‐pregnant females. All embryo injections and implantations were done at the Mayo Clinic Transgenic Core Facility under the direction of Dr Chella David. Tail samples from the offspring were used to obtain genomic DNA for determining transgene integration. Two lines of transgenic mice for each transgene were established from mice containing the highest expression as determined by semiquantitative polymerase chain reaction (PCR). DNA samples were screened using primers for the particular TMEV gene as well as the ubiquitin c promoter region. All mice used in every experiment were screened by PCR prior to their use in subsequent assays. TMEV transgenic mice were then crossed to FVB.Db transgenic mice to generate a line of TMEV‐resistant transgenic mice that express H‐2Db. All of these transgenic lines behaved similarly to the wild‐type controls, and no gross clinical or morphologic abnormalities were observed in any of the transgenic lines.
Characterization of TMEV transgenic mice
We characterized TMEV transgenic mice by (i) quantifying TMEV transgenic transcripts by reverse transcription PCR (RT‐PCR) and (ii) immunizing mice with purified VP1 and VP2 proteins.
RT‐PCR for quantification of TMEV transgenic transcripts
A 97‐base‐pair region common to all TMEV constructs in the TMEV transgenic mice was used to quantify TMEV transgene transcripts in the brain, spinal cord, thymus and spleen of TMEV transgenic lines using primers TMEV trans‐F and TMEV trans‐R (Table S1). The housekeeping gene GAPDH was quantified to control for differences in total mRNA amount and integrity using primers GAPDH‐F and GAPDH‐R (Table S1). After total RNA isolation, DNAse I amp grade (Invitrogen) digested any remaining genomic DNA according to the manufacturer's recommendations. RNA was reverse transcribed using M‐MLV reverse transcriptase (Invitrogen) and primed with random hexamers according to the manufacturer's recommendations. cDNA was amplified in using a Lightcycler instrument (Roche, Indianapolis, IN). The reactions were done in 20 µL capillaries containing 10 µL of 2x Quantifast SYBR Green master mix (Qiagen, Valencia, CA), 0.2 µM of each forward and reverse primer, 0.2 µL of cDNA and molecular‐grade water. Reaction conditions for TMEV transgene and GAPDH were as follows: denaturation at 95°C for 2 minutes, followed by 40 cycles of amplification; melting at 95°C for 10 s, annealing/extension at 60°C for 30 s, data acquisition at 82°C for 6 s. The reaction conditions for melting curve analysis were 95°C for 10 s, 60°C for 5 s and ramp to 95°C at 0.1°C/s with continuous data acquisition. PCR product curves were linear across serial 10‐fold dilutions, and the melting curve analysis indicated synthesis of a single homogenous product at the expected melting temperature for both the TMEV transgene and GAPDH. Data were expressed as amount of TMEV transcript in each tissue relative to background amplification obtained using a littermate non‐transgenic mouse. Relative quantities were calculated using the 2‐ΔΔCt method (Schmittgen, Nature Protocols, 2008). The littermate non‐transgenic mouse did not have any amplification of the TMEV transgene after 40 cycles, so we used a C t value of 40 for calculations.
Western blot analysis of transgenic protein expression
To further characterize transgenic mice, splenocytes were isolated from FVB wild type, FVB.VP1 and FVB.VP2 mice. Cells were lysed with Radioimmunoprecipitation assay (RIPA) buffer containing protease inhibitor mixture, lysates were centrifuged at 14 000 rpm for 5 minutes at 4°C and supernatants were collected for Western blot analysis. A total of 50 µg of protein was used for Western blot analysis. As a positive control, recombinant VP1 and VP2 proteins were used in serial dilutions from 10 µg to 40 ng.
Virus and infection
Demyelinating disease was induced in 6‐ to 8‐week‐old mice by intracerebral injection of TMEV. A 27‐gauge needle delivered 10 µL containing 2 × 10⁵ plaque‐forming units of Daniel's strain TMEV. This resulted in >98% incidence of infection with rare fatalities.
RNA isolation for viral transcripts
Total RNA was extracted from brain and spinal cord as described previously (13). Briefly, the tissues were frozen and stored in liquid nitrogen. Tissues samples were homogenized in Trizol (Invitrogen), and total RNA was isolated according to the manufacturer's recommendations. Total RNA concentrations were determined by spectrophotometer then equilibrated to 50 ng/µL and stored at −80°C.
RT‐PCR for analysis of viral RNA transcripts
A 269‐base‐pair region of the DA strain of TMEV that encodes the 3D polymerase was used to quantify viral transcripts in brain and spinal cord of infected mice using primers 3D‐F and 3D‐R (Table S1). We used that part of the TMEV sequence because it was not incorporated into any of the transgenic mouse lines and any amplified products would therefore represent replicating virus. The housekeeping gene GAPDH was quantified to control for differences in total mRNA amount and integrity using primers GAPDH‐F and GAPDH‐R (Table S1).
Total RNA was reverse transcribed and amplified in one step using a Lightcycler instrument (Roche). The reactions were done in 20 µL capillaries containing 10 µL of 2x Quantifast SYBR Green master mix (Qiagen), 0.2 µM of each forward and reverse primer, 20U of Superscript III reverse transcriptase (Invitrogen), 0.2 µg of total RNA and molecular‐grade water. Reaction conditions for 3D and GAPDH were as follows: reverse transcription at 55°C for 10 minutes, followed by denaturation at 95°C for 2 minutes, followed by 40 cycles of amplification; melting at 95°C for 10 s, annealing/extension at 60°C for 30 s, data acquisition at 82°C for 6 s. The reaction conditions for melting curve analysis were 95°C for 10 s, 60°C for 5 s and ramp to 95°C at 0.1°C/s with continuous data acquisition. PCR product curves were linear across serial 10‐fold dilutions, and the melting curve analysis indicated synthesis of a single homogenous product at the expected melting temperature. Data were expressed as total amount of viral transcripts in the brain or spinal cord relative to background amplification from uninfected mice. Relative quantities were calculated using the 2‐ΔΔC t method (43).
Brain and non‐CNS tissue pathology
Brain pathology was assessed at 21, 45, 90, 180 and 270 days post infection (dpi), using our previously described technique (26). Following perfusion with Trump's fixative, we made two coronal cuts in the intact brain at the time of removal from the skull (one section through the optic chiasm and a second section through the infundibulum). As a guide, we used the Atlas of the Mouse Brain and Spinal Cord corresponding to sections 220 and 350, page 6 (44). This resulted in three blocks that were then embedded in paraffin. This allowed for systematic analysis of the pathology of the cortex, corpus callosum, hippocampus, brain stem, striatum and cerebellum. Resulting slides were then stained with hematoxylin and eosin. Pathological scores were assigned without knowledge of experimental group to the different areas of the brain. Each area of the brain was graded on a four‐point scale as follows: 0, no pathology; 1, no tissue destruction but only minimal inflammation; 2, early tissue destruction (loss of architecture) and moderate inflammation; 3, definite tissue destruction (demyelination, parenchymal damage, cell death, neurophagia, neuronal vacuolation); and 4, necrosis (complete loss of all tissue elements with associated cellular debris). Meningeal inflammation was assessed and graded as follows: 0, no inflammation; 1, one cell layer of inflammation; 2, two cell layers of inflammation; 3, three cell layers of inflammation; 4, four or more cell layers of inflammation. The area with maximal tissue damage was used for assessment of each brain region. Because the transgene was ubiquitously expressed in all tissues, morphology was assessed in various CNS and non‐CNS tissues at 7 dpi, because at this time point, there was maximum inflammation in the brain. We collected CNS (positive control) as well as different non‐CNS tissues (liver, kidney, heart, spleen, lungs and muscle) and examined the tissues pathologically for inflammation and injury. A group of FVB and FVB transgenic animals were also sham infected with Phosphate‐buffered saline (PBS) to serve as negative controls. This tissue was embedded in paraffin and stained with hematoxylin and eosin.
Spinal cord morphometry
Mice were anesthetized with sodium pentobarbital and perfused intracardially with Trump's fixative (phosphate‐buffered 4% formaldehyde/ 1% glutaraldehyde, pH 7.4). Spinal cords were removed, cut into 1‐mm blocks and every third block post‐fixed and stained with osmium tetroxide and embedded in araldite plastic (Polysciences, Warrington, PA). Ten to 12 spinal cord sections were stained with 4% p‐phenylenediamine to visualize the myelin sheaths. Sections were analyzed for spinal cord pathology (inflammation and demyelination) using a previously described method (39). Each quadrant from every coronal section from each mouse was graded for the presence or absence of gray matter disease, meningeal inflammation, and demyelination. The score was expressed as the percentage of spinal cord quadrants examined with the pathological abnormality. A maximum score of 100 indicated a particular pathological abnormality in every quadrant of all spinal cord sections of a given mouse. All grading was performed on coded sections without knowledge of the experimental group.
Assessment of functional disease using an accelerated rotarod assay
The Rotamex rotarod (Columbus Instruments, Columbus, OH), which measures balance, coordination and motor control, was used to assess neurologic function. The rotarod consists of a suspended rod powered by a variable speed motor capable of running at a fixed speed or accelerating at a constant rate. Mice were trained and tested according to the protocol established previously (21). The apparatus consists of a motor‐driven rod suspended 28.5 cm over a grid and is capable of monitoring the performance of four mice at the same time through the use of lane dividers. Automation of the system is achieved through the use of a computer that records the velocity of the rod and the time at which a mouse falls and interrupts an infrared beam. Prior to injection with TMEV, each mouse received 3 days of training using constant‐speed protocol. This consisted of three 3‐minute trials over 3 days (12 rpm on day 1, 13 rpm on day 2 and 14 rpm on day 3). Mice were then tested using an accelerated assay (initial speed of 10 rpm accelerating at 10 rpm per minute until the mouse fell off). The maximum speed was 70 rpm at 6 minutes. Rotarod performance was measured at 21, 45, 90 and 180 days following virus infection. All subsequent trials consisted of one day of accelerated speed testing (three trials consisting of initial speed of 10 rpm and accelerating at 10 rpm per minute until the mouse fell off). The speed (rpm) at the time of fall was recorded for each mouse, and data were expressed as percent preservation of the intracranially sham PBS‐infected FVB control group function. Ratios to determine the percent preservation at 0, 21, 45, 90 and 180 days after infection were calculated by dividing the trial means of each mouse performance by the average trial means of the PBS‐infected FVB control group for each time point after infection.
Axon counts
A mid‐thoracic section (T6) was selected for axon counts because this is the most representative area of both ascending and descending tracks from the brain. An Olympus Provis AX70 microscope (Leeds Precision Instruments, Inc., Minneapolis, MN, USA) that was fitted with a DP70 digital camera and a 60× oil‐immersion objective was used to capture six sample areas of normal‐appearing white matter containing a relative absence of demyelination from each cross‐section, according to the sampling scheme as previously reported (8). Approximately 400 000 µm2 of white matter was sampled from each mouse. Absolute myelinated axon numbers were calculated as previously reported without knowledge of experimental groups (10).
Statistics
Data were analyzed using either the Student's t‐test for normally distributed data or the Mann‐Whitney rank sum test for data that were not normally distributed. For comparisons of more than one group, analysis of variance (ANOVA) was used for normally distributed data, in which the Holmes‐Sidak test was used for pair‐wise multiple comparisons, and Kruskal‐Wallis ANOVA on ranks for data that were not normally distributed, in which Dunn's test was used for pair‐wise multiple comparisons. The level for significance was set as P < 0.05 for all tests.
RESULTS
Characterization of transgenic mice
To characterize the expression of each transgene, we used real‐time quantitative PCR to quantify RNA transcripts using primers that amplified a common region in all three transgenic mice. Total RNA was isolated from brain, spinal cord, thymus and spleen. We detected high levels of transgene transcripts in all mice except for transgenic VP1 line 1 where transcript levels were approximately 1000‐fold less than for the other transgenic line (Figure 1A). In VP2 mice, both lines expressed high levels of transgenic transcripts, although VP2 line 1 yielded 10‐fold less then VP2 line 2. We also expressed the ratio of transgenic transcripts to transcripts of an abundantly expressed gene, GAPDH. All transgenic mice except VP1 line 1 expressed 1000‐ to 10 000‐fold fewer transcripts than GAPDH transcripts (Figure 1B). RNA levels of the transgenes VP1 (line 2), VP2 (lines 1 and 2) and VP2121–130 (line 1) were expressed in all tissues studied including brain, spinal cord, thymus and spleen. However, despite our effort, transgene VP1 or VP2 proteins were not detected using Fluorescence‐activated cell sorting (FACS), immunocytochemistry or Western blotting in CNS or non‐CNS tissues. Serial dilutions of purified VP1 and VP2 proteins (40 ng to 10 µg) demonstrated that the sensitivity of the Western blot and InVision His tag in gel stain (Invitrogen LC6030) was 600 ng for both VP1 and VP2. We also did not detect transgenic protein in other TMEV transgenic mice generated in our laboratory under a different promoter 13, 27. In addition, this has also been the case when others have attempted to detect protein expression when transgenic mice have been made 47, 49. We showed previously that the amount of peptides necessary to drive T‐cell responses to the virus is in the femtomolar range (3). This is well below the sensitivity of any technique to detect protein but is sufficient to drive CTL T‐cell responses. Despite absence of demonstrable transgenic proteins, specific T cells from these mice were deleted from the repertoire, demonstrated by the reduction of T cells to VP2121–130 peptide in H‐2Db mice detected by FACS‐tetramer staining (27). Previous experiments have already characterized the immune consequence of transgenic expression of viral capsid proteins of CD4 T‐cell, CD8 T‐cell and B‐cell responses in the resistant FVB.Db mice (27). This was possible because resistant FVB.Db mice make a strong immune response to Theiler's virus proteins, and therefore, it was possible to show that transgenic expression of virus capsid antigens (VP1 or VP2) resulted in a significant decrease of the specific CTL immune responses (17). However, as shown previously 15, 16, susceptible mice to TMEV infection such as FVB make very weak cellular immune responses to TMEV antigens. We made attempts to characterize this weak immune response by immunizing peripherally with purified capsid proteins or by infecting with virus. We even stimulated in vitro with the appropriate antigen to try to amplify immune response in the spleens. In spite of these attempts (four independent experiments), we were not able to visualize anti‐viral cellular immunity against these capsid proteins and therefore could not specifically characterize the immune consequences of transgenic expression of capsid antigens on cellular immunity in susceptible FVB mice, even though this was possible in FVB.Db mice (27).
Figure 1.
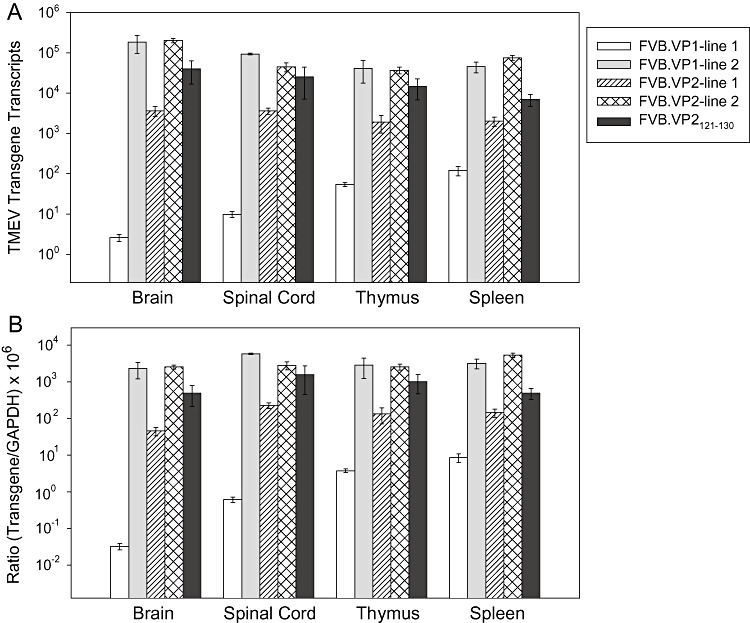
Levels of transgene transcripts in FVB mice. Total RNA was isolated from the brain, spinal cord, thymus and spleen. TMEV transcripts were quantified by real‐time RT‐PCR using SYBR Green. Primers specific to a portion of the transgene on the 3′‐end, which were common to all transgenic mice were used for amplification. A. Relative transgenic transcripts in transgenic mice. B. Ratio of TMEV transcripts to GAPDH transcripts in various tissues from TMEV transgenic mice. Data were normalized to GAPDH transcripts and were relative to background levels in non‐transgenic FVB mice.
Expression of TMEV transgenes elevated viral load in FVB.Db.VP2121–130 transgenic mice, whereas they did not alter the viral load in the chronic phase in FVB transgenic mice
We infected wild‐type FVB and FVB.Db as well as VP1, VP2 and VP2121–130 transgenic mice with the Daniel's strain of TMEV. At 7, 21, 45, 90 and 180 dpi, total RNA was extracted from the brain and spinal cord to quantitate viral transcripts by real‐time quantitative PCR (Figure 2, Table S2). At 7 dpi, brains of FVB.Db wild type and transgenic mice contained more than 4 logs of viral transcripts (Figure 2A). At this early time point, viral transcripts in wild‐type FVB.Db and FVB.Db.VP2121–130 mice were significantly higher than in FVB.Db.VP1 and FVB.Db.VP2 mice (ANOVA, P = 0.02). At 21 dpi, viral transcripts in brains of wild‐type FVB.Db mice decreased to 2.4 logs, whereas in the three FVB.Db transgenic strains, transcripts were higher by about 1 log (ANOVA, P < 0.001). Interestingly, by 45, 90 and 180 dpi, viral transcripts were further decreased in wild‐type FVB.Db, FVB.Db.VP1 and FVB.Db.VP2 mice, whereas they remained high in FVB.Db.VP2121–130 mice. Viral transcripts in the spinal cords of FVB.Db wild‐type and transgenic mice showed a similar pattern as in the brain (Figure 2C). Early in the disease, viral transcripts were equivalent, and by 180 dpi, they were lower in FVB.Db and FVB.Db.VP1 mice, whereas they remained higher in FVB.Db.VP2 and FVB.Db.VP2121–130 mice. We concluded that expression of the VP2 and VP2121–130 transgenes in FVB.Db mice had a pronounced effect on levels of viral transcripts and therefore led to ineffective viral clearance from both spinal cord and brain.
Figure 2.
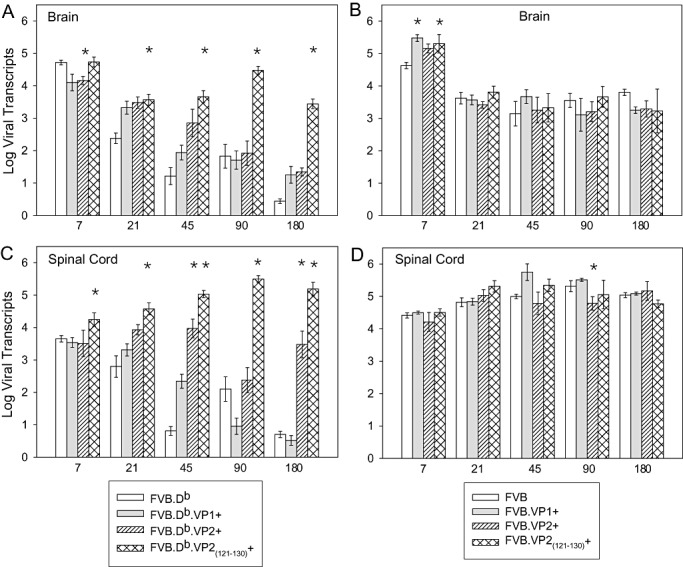
Levels of TMEV transcripts in the brain and spinal cord of FVB.Db and FVB mice. Log viral transcripts were quantified by real‐time RT‐PCR by using SYBR green. Primers specific for 3D polymerase were used. Cycle threshold values in uninfected FVB.Db and FVB mice were subtracted from the threshold values of corresponding infected wild‐type or transgenic mice to exclude any nonspecific amplification products. A. Viral transcripts in the brain of wild‐type FVB.Db vs. transgenic mice were different throughout the course of the disease; at 7 dpi (ANOVA, P = 0.01), and 21 through 270 dpi (P < 0.001). B. Viral transcripts in the brain of wild‐type FVB vs. transgenic mice were not different throughout the disease, except at 7 dpi (ANOVA, P = 0.042). C. Viral transcripts in the spinal cord of wild‐type FVB.Db vs. transgenic mice were different throughout the course of the disease; at 7 dpi (ANOVA, P = 0.036), and 21 through 270 dpi (ANOVA, P < 0.001). D. Viral transcripts in the spinal cord of wild‐type FVB vs. transgenic mice were equivalent throughout the disease except at 90 dpi (ANOVA, P = 0.01). Data shown as mean ± SEM of three to eight mice per group. Stars denote statistically significant difference from the control. (See supplementary tables for actual numbers).
In FVB mice, at 7 dpi, the three transgenic strains contained more than 5 logs of viral transcripts in the brains, which was more when compared statistically to a wild type (ANOVA, P = 0.042) (Figure 2B). However, at the later time points, there was no effect of transgenic expression on viral transcripts. At 21 dpi, viral transcripts in brains of all FVB wild‐type and transgenic mice were lowered to about 3.5 logs and remained equivalent throughout the 180 dpi. Expression of transgenes in FVB mice did not affect viral transcripts in the spinal cords. In FVB wild‐type and the transgenic mice, viral transcripts in the spinal cord were equivalent throughout the course of disease (Figure 2D), demonstrating that irrespective of transgene, the FVB mice were equally susceptible to chronic virus RNA replication
VP1, VP2 and VP2121–130 transgenes did not alter brain pathology in FVB.Db and FVB mice
To determine whether transgenic expression of VP1 or VP2 had an impact on the severity of brain pathology, we assessed the pathology in brains from all transgene (FVB.Db and FVB) positive mice and wild‐type controls. Although some minor differences were found, pathological analysis of the brains of all FVB.Db and FVB transgenic and wild‐type mice revealed no major differences in the severity and distribution of brain lesions (Table S3). In the early disease (21 dpi), average brain score was significantly higher in FVB.Db.VP2121–130 mice (ANOVA, P = 0.002) (Figure 3A) as compared with wild‐type FVB.Db mice. Early brain disease was worse in this strain possibly because of the deletion of T cells specific for the VP2121–130 epitope, which are required for viral clearance. When individual scores per regions were analyzed, we observed that this transgenic strain had higher scores in the hippocampus and corpus callosum (Figure S1D). At 180 dpi, two FVB.Db mice had unusually higher brain scores in the striatum, which consequently led to overall statistical significance (ANOVA, P = 0.024).
Figure 3.
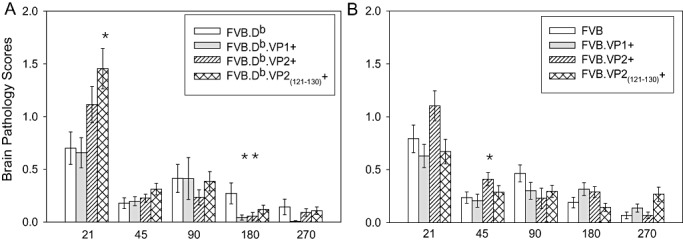
Time course of brain pathology scores in FVB.Db and FVB wild‐type and transgenic mice following TMEV infection. Seven areas of the brain (cerebellum, brain stem, cortex, hippocampus, striatum, corpus callosum and meninges) were graded based on a four‐point scale as described in the methods. Scores from all areas were averaged and plotted as shown. Bars show the mean ± SEM of each group. A. Brain pathology scores in FVB.Db mice compared with transgenic mice showed differences at 7 dpi (ANOVA, P < 0.001) and 180 dpi (ANOVA, P = 0.024). At other time points, pathology was equivalent. (See supplementary tables for actual numbers). B. Brain pathology scores in FVB mice compared with transgenic mice were equivalent throughout most of the disease. Statistical difference was reached only at 45 dpi (ANOVA, P = 0.021). Stars denote statistically significant difference from the control.
Only at 45 dpi FVB.VP2 mice showed significantly higher scores because one mouse showed more lesions in the cortex and corpus callosum (ANOVA, P = 0.042) (Figure 3B and Figure S1G). Otherwise, TMEV‐induced lesions were the same in all brain areas regardless of transgene. This indicated that in both the early and the chronic stages of disease, expression of virus transgenes did not alter the gross extent of brain pathology.
Transgenic expression of virus capsid proteins did not cause pathological changes in non‐CNS tissues following virus infection
As expected, all TMEV‐infected FVB and FVB transgenic mice showed inflammation in several brain regions including the brainstem, hippocampus, striatum and cortex. However, no brain inflammation was observed in sham (PBS)–infected mice. In addition, several non‐CNS tissues (liver, kidney, heart, spleen, lungs and muscle) were pathologically examined for inflammation. No inflammation was observed in these tissues either 7 days following TMEV infection or after sham (PBS) infection (Figure S2). Therefore, even though virus mRNA could be detected in the non‐CNS tissues, no inflammation was present in these tissues following virus infection.
Transgenic expression of VP2121–130 epitope in FVB.Db mice resulted in increased inflammation and demyelination in the spinal cord, whereas expression of all three virus capsid coding regions (VP1, VP2 or VP2121–130) induced increased demyelination in FVB mice
Genetic analysis of FVB.VP1 and FVB.VP2 mice revealed two founder lines within each of these transgenic strains. For each strain, we compared the demyelination and inflammation scores at all time points and found no biological or statistically significant differences between the two founders for each transgenic strain (Figure S3). The only statistical difference was when comparing the two VP1 lines for the early inflammation scores (t‐test, P = 0.033 at 21 dpi and P = 0.012 at 45 dpi). Having shown that at almost all time points, these two important pathological markers were not altered, the two founder lines were combined for analysis. We demonstrated previously that expression of VP2 or VP2121–130 transgenes in resistant FVB.Db strain resulted in loss of resistance to demyelination at 45 dpi (27). In the current study, we extended the analysis of spinal cord inflammation and demyelination to both the early and the chronic stages of disease.
Meningeal inflammation
In FVB.Db transgenic mice, meningeal inflammation was present at low levels throughout the course of disease in all strains, except in FVB.Db.VP2121–130 mice. In this strain, inflammation was significantly higher from 21 through 180 dpi (Figure 4A, Table S4). This was expected because VP2121–130 is the dominant peptide recognized by CD8+ T cells of the Db haplotype. Deletion of these T cells abrogated efficient viral clearance and therefore led to increased inflammation. In FVB transgenic mice, meningeal inflammation in the spinal cord was similar at all time points, except at 180 dpi (Figure 4B). At this time point, all three FVB transgenic strains showed increased inflammation compared with wild‐type FVB (ANOVA, P = 0.044). A similar pattern was observed at 90 dpi; however, at this time point, the data did not reach statistical significance (P = 0.074).
Figure 4.
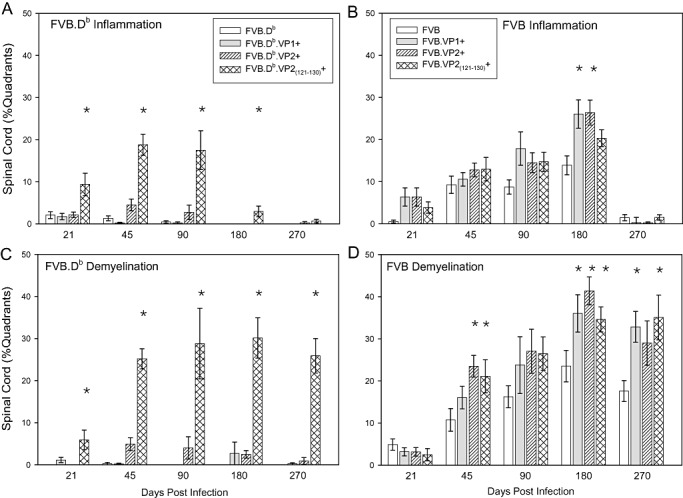
Percent of spinal cord quadrants containing spinal cord white matter inflammation and demyelination in FVB and FVB.Db wild‐type or transgenic mice. Data expressed as a percentage of quadrants with the pathological abnormality as a function of all spinal cord quadrants examined. A. Spinal cord white matter inflammation in FVB.Db transgenic mice was significantly increased in FVB.Db.VP2121–130 mice from 21 through 180 dpi as compared with wild‐type FVB.Db mice. B. Spinal cord white matter inflammation in FVB transgenic mice as compared with wild‐type FVB mice was equivalent throughout most of the disease. Difference reached statistical significance at 180 dpi (ANOVA, P = 0.044). C. Percent of demyelinated spinal cord quadrants in FVB.Db transgenic mice was significantly increased in FVB.Db.VP2121–130 mice throughout the course of disease as compared with wild‐type FVB.Db mice (ANOVA, P < 0.001) (See supplementary tables for actual numbers). D. Percent of demyelinated spinal cord quadrants in FVB transgenic mice as compared with wild‐type FVB mice was similar only in the early disease (21 dpi), whereas at 45 dpi and later time points, there was a trend towards increased demyelination in all three transgenic mice compared with wild‐type strain. Stars denote statistically significant difference from the control.
Demyelination
As expected, FVB.Db mice showed almost no demyelination; only one mouse at 45 dpi showed minimal focal demyelination. This was consistent with our previous finding that genetic insertion of H‐2Db made the susceptible mouse (FVB) resistant to demyelination (36). FVB.Db.VP1 and FVB.Db.VP2 mice showed minimal demyelination at all time points throughout the course of the disease. Interestingly, FVB.Db.VP2121–130 mice showed profoundly increased demyelination at all time points (Figure 4C). In FVB.Db.VP2121–130 mice, not only was the percentage of demyelinated spinal cord quadrants higher but also the frequency of mice with demyelination (Tables S5 and S6).
Demyelination was similar in the FVB wild type and the three transgenic strains in the early stages of the disease (ANOVA, P = 0.545). Starting at 45 dpi, differences in the amounts of demyelination emerged. Demyelination was significantly increased in FVB.VP1, FVB.VP2 and FVB.VP2121–130 mice at 45, 180 and 270 dpi (ANOVA, P = 0.014, P = 0.015 and P = 0.005, respectively) (Figure 4D and Table S5). At 90 dpi, the pattern of increased demyelination in all transgenic strains remained but did not reach significance (P = 0.241). Taken together, analysis of spinal cord inflammation and demyelination demonstrated that following TMEV infection: (i) in FVB.Db transgenic mice, only expression of VP2121–130 transgene led to more demyelination and inflammation; (ii) in FVB transgenic mice, expression of all three transgenes led to more demyelination at 45, 180 and 270 dpi, whereas the inflammation was different only at 180 dpi.
Rotarod functional assay
To test the effect of TMEV transgenes on motor function, infected FVB.Db and FVB wild type as well as transgenic mice were assayed by rotarod at 21, 45, 90 and 180 dpi (Figure 5). Infected mice were compared with age‐matched uninfected FVB.Db (n = 39) or FVB (n = 38) mice. Motor activity of infected wild‐type and all transgenic FVB.Db mice, at any time point, was not different from the activity of uninfected controls (Figure 5A), even though from 90 dpi, a trend toward decreased function was observed in FVB.Db.VP2121–130 mice, which approached significance at 180 dpi (ANOVA, P = 0.07).
Figure 5.
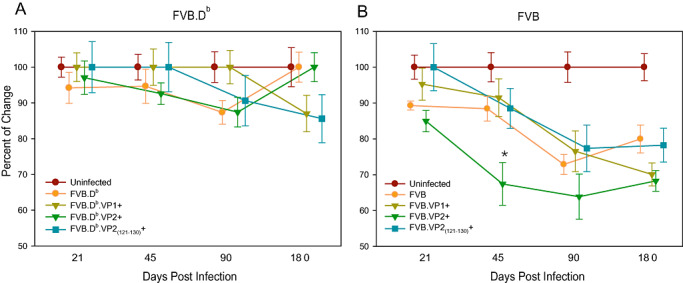
Assessment of motor function following TMEV infection using the accelerated rotarod assay. All infected mice as well as their sham‐infected controls were placed on an accelerating rotarod, and the speed at which the mice fell was recorded. The baseline performance (prior to TMEV infection) for each mouse was labeled as 100%. Data shown are the percent by which the mice fell at each time compared with age‐matched uninfected FVB.Db or FVB controls. A. Analysis of rotarod performances between uninfected and infected FVB.Db wild‐type or transgenic mice did not reveal statistically significant differences at any time point over the disease course. Only FVB.Db.VP2121–130 mice showed a trend toward decreased motor activity, which approached significance at 180 dpi (ANOVA, P = 0.07). B. In contrast, in infected FVB wild‐type and transgenic mice compared with uninfected age‐matched controls, differences in motor activity emerged at 45 dpi. At this time point, only FVB.VP2 mice showed significantly decreased function (ANOVA, P < 0.001) as compared with both uninfected and infected FVB mice. At 90 and 180 dpi, all infected FVB wild‐type and transgenic mice had similar motor function, which was significantly decreased relative to uninfected controls (ANOVA, P < 0.001). Stars denote statistically significant difference from the control.
At 45 dpi, only FVB.VP2 mice showed significantly decreased function (67 ± 6%, P < 0.001) as compared with both uninfected and infected FVB mice. At 90 and 180 dpi, all infected FVB transgenic mice had equivalent motor function that was significantly decreased relative to uninfected controls (ANOVA, P < 0.001) (Figure 5B). We concluded that (i) in FVB.Db mice expression of VP1 and VP2 transgenes did not alter motor function, whereas expression of the VP2121–130 epitope led to a decreased motor activity; and (ii) in FVB mice, expression of the transgenes did not alter motor activity as compared with wild‐type mice.
TMEV transgenes altered the distribution of mid‐thoracic axons in FVB.Db.VP2121–130 transgenic mice, and the number of axons in FVB transgenic mice
Axon counts were performed in all chronically infected animals at 270 dpi. We reported previously that absolute number of axons in chronically infected FVB vs. uninfected was not different (8). In this study, we confirmed this finding and compared number of midthoracic axons in chronically infected wild‐type vs. transgene expressing FVB.Db as well as FVB mice. In all mice analyzed in this study, as well as in the previously published manuscript (22), axonal loss as detected by counting axons was demonstrated to occur following demyelination consistent with the hypothesis that demyelination predisposed to axonal loss. In addition, no axonal loss was observed in transgenic mouse strains that did not demonstrate demyelination, thus consistent with this hypothesis.
Total number of axons in infected FVB.Db wild‐type mice vs. transgenic mice was not different (P = 0.637) (Figure 6A). However, FVB.Db.VP2121–130 mice, which had significantly higher amounts of inflammation and demyelination in the spinal cord, showed altered axon distributions (Figure 6B). Small (1–4 µm2), medium (4–10 µm2) and large (>10 µm2) caliber axons were equivalent in FVB.Db, FVB.Db.VP1 and FVB.Db.VP2 mice; however, in FVB.Db.VP2121–130 mice, medium‐caliber axons were significantly increased (ANOVA, P = 0.013), whereas large‐caliber axons were significantly decreased (ANOVA, P = 0.033). The loss of large‐caliber axons in FVB.Db.VP2121–130 mice was also appreciated by light microscopy from representative areas selected from spinal cord anterior columns (Figure 7A–D).
Figure 6.
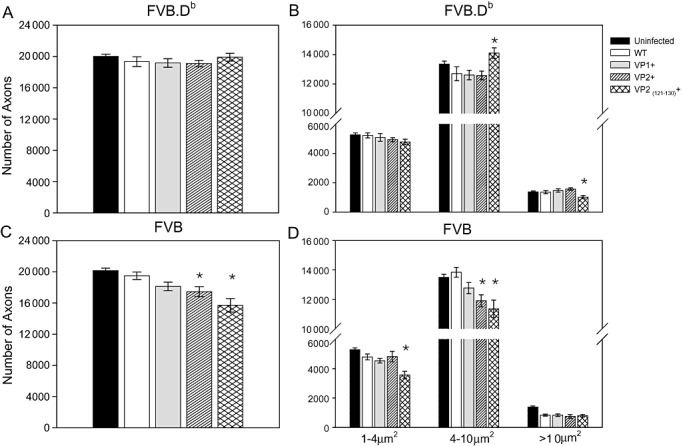
Axon counts at 270 dpi in FVB.Db and FVB transgenic mice. Axons were counted in six areas of a midthoracic spinal cord section, as described in the methods. Absolute number of axons is shown in FVB.Db (A) and in FVB (C) transgenic mice (mean ± SEM). Expression of TMEV transgenes did not affect the absolute number of axons in FVB.Db mice (ANOVA, P = 0.637), whereas it did in FVB mice (ANOVA, P < 0.001). Axons from uninfected controls and all transgenic groups were morphologically analyzed by dividing them into three groups as a function of diameter of axon caliber (1–4 µm2, small; 4–10 µm2, medium; >10 µm2, large). B. In uninfected and infected FVB.Db wild‐type and transgenic mice, small‐caliber axons were not different (P = 0.458). However, although FVB.Db.VP2121–130 mice did not show changes in absolute number of axons, the distribution of medium‐ and large‐caliber axons was disrupted. Compared with FVB.Db, FVB.Db.VP1 and FVB.Db.VP2, this strain had more medium‐caliber axons (ANOVA, P = 0.006) but fewer large‐caliber axons (ANOVA, P < 0.001). Fewer large‐caliber axons in FVB.Db.VP2121–130 mice may explain the observed trend of functional deficits in this strain. D. Distribution of axons in FVB transgenic mice revealed that large‐caliber axons were equivalent in all infected mice but were reduced compared with uninfected controls (ANOVA, P < 0.001). Small‐caliber axons were reduced only in the infected FVB.VP2121–130 strain compared with wild‐type FVB, FVB.VP1 and FVB.VP2 mice (P < 0.001). Medium‐caliber axons were reduced in both FVB.VP2 and FVB.VP2121–130 strains (P = 0.02 and P < 0.001, respectively). Stars denote statistically significant difference from the control.
Figure 7.
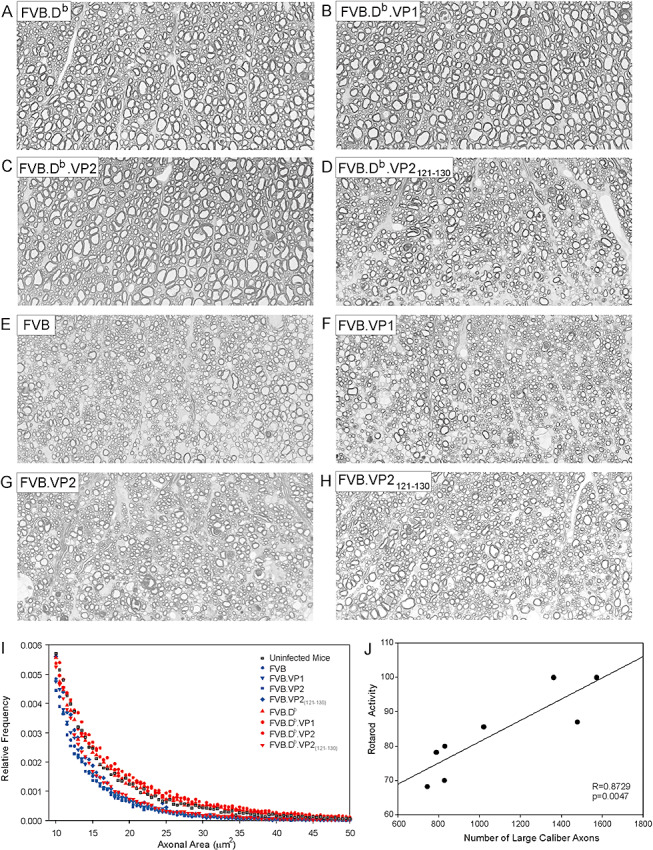
Axon distributions and correlation with motor activity. Anterior columns of midthoracic spinal cord sections show preservation of large‐caliber axons (>10µm2) in FVB.Db (A), FVB.Db.VP1 (B) and FVB.Db.VP2 (C) mice as compared with the relative loss of these axons in FVB.Db.VP2121–130 mice (D). In infected FVB wild‐type mice as well as all three FVB transgenic strains (E–H) loss of large‐caliber axons is similar. All pictures were taken from a similar region of the spinal cord anterior columns with a 60× objective using identical camera settings. I. Relative frequency distribution of large‐caliber axons (>10 µm2) across all strains. The lines represent the relative frequency of large‐caliber axons using 0.5‐µm2 intervals as bins. Note the tail of axon distribution in infected FVB.Db.VP2121–130 mice which was distinct from infected FVB.Db, FVB.Db.VP1 or FVB.Db.VP2 mice and uninfected controls. J. When the average rotarod activities of all FVB and FVB.Db wild‐type and transgenic mice were plotted against average number of large‐caliber axons (>10 µm2), a strong positive correlation was observed (R = 0.8729, P = 0.0047).
Compared with wild‐type FVB mice, FVB.VP2 and FVB.VP2121–130 transgenic strains had significantly fewer axons (P = 0.045 and P < 0.001, respectively), whereas in FVB.VP1 mice, the decrease in number of axons approached significance (P = 0.097) (Figure 6C). Interestingly, axon dropout in these transgenic mice was in agreement with the increased amount of demyelination in the same mice (Figure 4D). Because the most severe axonal loss occurred in FVB.VP2121–130 transgenic mice, we counted axons at two earlier time points (90 and 180 dpi). Although the demyelination was similar at these chronic time points, we observed a gradually increasing axonal loss: at 90 dpi, average number of midthoracic axons was 18 067, and at 180 dpi, it was 17 524. This is consistent with the hypothesis that axonal loss was secondary to demyelination and not the alternate hypothesis that axon loss antedates demyelination (46). When individual demyelination scores were plotted against total number of axons for each mouse, a statistically significant but weak correlation was found (R = 0.279, P = 0.03). Analysis of axon distribution revealed that small‐ and medium‐caliber axons were lost in FVB transgenic mice as compared with FVB wild‐type mice, whereas large‐caliber axons were equivalent (6, 7). When plotted as a function of their relative frequency, the distribution of large‐caliber axons in FVB.Db.VP2121–130 mice was distinct from other FVB.Db transgenic mice (Figure 7I). In addition, we plotted the average rotarod activity of all chronically infected FVB.Db and FVB wild‐type and transgenic mice against average number of (i) total and (ii) large‐caliber axons (>10 µm2). We observed a weak and statistically not significant correlation with total number of axons (R = 0.524, P = 0.183), whereas a strong positive correlation was observed with large‐caliber axons (R = 0.873, P = 0.005) (Figure 7J). This result is consistent with the hypothesis that large‐caliber axons are primarily responsible for motor function as measured by the rotarod assay.
DISCUSSION
We previously showed that expression of the VP2 protein or the critical CD8+ T cell–specific peptide VP2121–130 as “self” led to deletion of this response from the T‐cell repertoire of mice with Db haplotype and induced susceptibility to demyelination in the normally resistant strain (27). In the present study, we tested the hypothesis that the pathological and functional features in the chronic stages of TMEV‐induced spinal cord disease are aggravated in (i) FVB.Db transgenic mice with the resistant H‐2Db haplotype and in (ii) FVB transgenic mice with the susceptible H‐2Dq haplotype.
One major finding in this study was that the expression of transgenes in normally susceptible FVB mice did not alter the amounts of viral transcripts in either brain or spinal cord. However, among FVB.Db transgenic mice, only FVB.Db.VP2121–130 and to a lesser extent FVB.Db.VP2 mice had higher levels of viral transcripts in both brain and spinal cord at all time points after infection compared with wild‐type FVB.Db mice. This is in agreement with the fact that genetic deletion of TMEV‐specific T‐cell response prevents virus clearance and consequently breaks resistance in strains of the Db haplotype. In contrast, in normally susceptible FVB mice, which constitutively have viral persistence following TMEV infection, transgenic expression VP1 or VP2 had no effect on virus load. Therefore, the changes in spinal cord pathology (demyelination and axon drop out) observed in FVB.VP1, FVB.VP2 and FVB.VP2121–130 mice can not be explained by an increase in virus transcripts.
Another important finding was that acute and chronic brain pathology was not influenced by the virus capsid transgene expression in either FVB or FVB.Db strains. Furthermore, with the exception of few outlier mice at several time points, the overall pattern of brain pathology was also similar across all strains (Figure S1A–H). Therefore, the changes in axon counts in the spinal cord cannot be explained by an alteration in neuronal brain pathology. In contrast, analysis of spinal cord pathology revealed that levels of demyelination were increased in all FVB transgenic mice compared with wild‐type mice. In FVB.Db transgenic mice, only the strain that expressed the VP2121–130 peptide had a highly significant increase in both spinal cord inflammation and demyelination. This suggests that the mechanisms of brain injury vs. spinal cord injury are fundamentally different. Brain pathology appears not to be influenced by transgenic expression of VP1 or VP2. This is consistent with the hypothesis that brain injury in the model is more the direct consequence of virus infection rather than the result of the immune response to the virus. In contrast, spinal cord demyelination was influenced by transgenic expression of VP1 or VP2, consistent with the hypothesis that spinal cord disease in this model is in part mediated by the immune response directed against virus.
An important aspect in this study was to exclude the possibility that random insertion of VP1 or VP2 transgenes influenced TMEV replication because of disruption of an endogenous gene at or around the insertion site. Fortunately, for both FVB.VP1 and FVB.VP2 mice, we had two founder lines available to study spinal cord pathology throughout the course of disease. When demyelination and inflammation were compared at all time points, no major differences were found between the two founder lines for each transgenic strain, even though one line from the FVB.VP1 strain showed more than a 1000‐fold less transgene transcripts.
Motor function tested repeatedly by a rotarod assay did not reveal major differences among infected FVB wild type as compared with the three transgenic mouse strains. Beginning at 45 dpi through 180 dpi, there was a drop in motor function in all infected FVB wild‐type and transgenic mice as compared with uninfected controls. Even though there was some variability in the number of seconds the mice stayed on the rotarod, there was no statistically significant difference when comparing the transgenic groups with the infected FVB wild‐type mice. Conversely, uninfected and infected FVB.Db wild‐type and transgenic mice over the course of the disease showed similar motor function. Only from 90 dpi a trend towards decrease in motor function was observed in FVB.Db.VP2121–130 mice, which approached significance at 180 dpi (ANOVA, P = 0.07).
We were most interested in the axon counts performed in all chronically infected mouse strains because axon loss has been associated with poor outcome in human MS (6). Axon counts in FVB.Db.VP2121–130 mice revealed an interesting finding. Although absolute number of axons was not altered, FVB.Db.VP2121–130 mice had less large‐caliber axons and more medium‐caliber axons. We propose that a redistribution/shrinkage of large‐ into medium‐caliber axons occurred because of axonal stress caused by more spinal cord demyelination in this strain. We reported previously that loss of large‐caliber axons correlated with motor deficits measured by rotarod (10). Although statistical analysis of motor activity in FVB.Db transgenic mice did not show differences at any time point, there was a trend toward decreased motor function in FVB.Db.VP2121–130 mice, which can be explained by loss or redistribution of large‐caliber axons.
We previously showed that absolute number of midthoracic axons in chronically infected wild‐type FVB mice is minimally decreased and statistically not different from uninfected age‐matched controls (8). In this study, at 270 dpi, all three FVB transgenic mice showed fewer midthoracic axons, which is in agreement with more demyelination in the same mice. This finding supports the hypothesis that axonal injury in this model follows closely with the extent of demyelination. We propose that the demyelination predisposes bare axons to subsequent injury by cytokines 20, 24, 25, inflammatory cells 12, 46 or nitric oxide 2, 29, 45, thus creating a scenario for possible irreversible deficits. Moreover, as shown in Figure 7I, all FVB transgenic mice had equivalent number of large‐caliber axons and therefore similar motor deficits. In addition, we showed a strong positive correlation between motor activity and average number of large‐caliber axons (Figure 7J). This finding is in agreement with data previously published in two articles, each using different mouse strains 10, 22.
We were unable to measure cellular immunity in FVB mice against the viral capsid antigens using standard in vitro assays: Cytotoxic T lymphocyte (CTL), Enzyme‐linked immunosorbent spot (ELISPOT), proliferation and intracellular cytokine staining by flow cytometry. However, humoral immunity was observed specific for these capsid antigens by Western blotting. We appreciate that there are MHC‐dependent immune responses that are protective because depletion of CD8+ T cells in H‐2Dq mice results in worse acute viral encephalitis (unpublished data). Moreover, in the present study, higher viral transcripts were observed in the acute (7 dpi) phase of infection in FVB transgenic mice (Figure 2B). In unpublished genetic studies, backcross animals segregating for a K, D double knockout haplotype and the H‐2Dq haplotype demonstrated that animals expressing H‐2Dq were more resistant to TMEV infection. These results are consistent with the hypothesis that cellular immunity restricted by H‐2Dq class I molecules confer resistance to virus infection.
By challenging resistant FVB.Db mice expressing VP1, VP2 and VP2121–130 transgenes, with a TMEV virus, we showed that only expression of the VP2121–130 epitope led to significant spinal cord pathology and moderate motor dysfunction. However, by infecting susceptible FVB mice expressing VP1 or VP2 transgenes, we aggravated spinal cord pathology (inflammation, demyelination and distribution of axon counts). Despite our inability to identify differences in T‐cell responses in vitro in transgenic vs. non‐transgenic mice in the susceptible FVB background, we demonstrated that transgenic expression of VP2 and VP2121–130 in the mice altered the chronic spinal cord pathology. There is strong evidence that CD8+ T cells contribute to axonal injury 7, 30. Most CTLs in this model early in the TMEV‐induced disease course are directed against virus capsids. However, we do not have definitive data in the chronic phase of disease when we see axonal injury that the CD8+ T cells are directed against virus. The chronic spinal cord pathology and axonal injury may have occurred as a result of virus‐induced autoimmunity (14), or bystander damage by macrophages or T cells still present in the repertoire 4, 5. The finding in this paper supports the hypothesis that even in the susceptible H‐2q haplotype, transgenic expression of VP1 or VP2 may influence protection against demyelination and subsequent axonal loss.
Supporting information
Figure S1. Individual brain pathology scores in wild‐type and transgenic FVB.Db (A?D) or FVB (E?H) mice. Brain pathology was quantified by using a four‐point grading system. Overall pattern of individual brain pathological scores across all strains showed no major differences. Only at three time points statistically significant differences were observed because of higher scores in individual mice rather than depicting more severe pathology in the whole group: (A) at 180 dpi, two FVB.Db mice had necrotic lesions in the striatum; (D) at 21 dpi, several FVB.Db.VP2121?130 mice had higher scores in the hippocampus and corpus callosum; and (G) at 45 dpi, one FVB.VP2 mouse showed more lesions in the cortex and corpus callosum.
Figure S2. Transgenic expression of virus capsid proteins did not cause pathological changes in non‐CNS tissues following intracerebral virus infection. FVB.VP1, FVB.VP2 and FVB.VP2121?130 mice were infected with TMEV or "sham" infected with PBS and sacrificed 7 days later. CNS as well as different non‐CNS tissues (liver, kidney, heart, spleen, lungs and muscle) were collected and examined pathologically for inflammation and injury. Inflammation and moderate tissue destruction were found in several brain regions, mostly in the striatum (A) and hippocampus (B). However, no inflammation was observed in non‐CNS organs: kidney (C), spleen (D), lung (E), liver (F), muscle (G) and heart (H). This figure shows panel of histologic sections from TMEV‐infected FVB.VP2 mice. Similar findings were observed when infecting FVB.VP1 mice or FVB.VP2121?130 mice. Tissue was embedded in paraffin, stained with hematoxylin and eosin and photographed at 20× magnification.
Figure S3. Spinal cord demyelination and inflammation is not different in each of two founder lines in FVB.VP1 and FVB.VP2 transgenic strains. FVB.VP1 and FVB.VP2 mice were genetically analyzed, and two founder lines were studied within each of these transgenic strains. For each strain, two lines were compared for demyelination (A and C) and inflammation (B and D) at multiple time points. Overall, no major differences were found except in the early disease inflammation scores (21 and 45 dpi) between the two VP1 lines. Stars denote statistically significant difference from the control.
Table S1. Primer sequences.
Table S2. Viral Transcripts in Brain and Spinal Cord.
Table S3. Brain Pathology.
Table S4. Spinal Cord Pathology?Meningeal Inflammation.
Table S5. Spinal Cord Pathology?Percent of Demyelinated Quadrants.
Table S6. Spinal Cord Pathology?Frequency of Demyelination.
Supporting info item
Supporting info item
Supporting info item
Supporting info item
Supporting info item
ACKNOWLEDGMENTS
This work was supported by grants from the NIH (NSRO132129 and NSRO124180), the National Multiple Sclerosis Society (RG3172 and CA1011A8) and the Multiple Sclerosis Research Foundation of Canada (CMS‐05). We thank Miloš Denić for assistance in axon counts quantitation. We also acknowledge support from the Applebaum Foundation.
REFERENCES
- 1. Azoulay A, Brahic M, Bureau JF (1994) FVB mice transgenic for the H‐2Db gene become resistant to persistent infection by Theiler's virus. J Virol 68:4049–4052. [DOI] [PMC free article] [PubMed] [Google Scholar]
- 2. Bolanos JP, Almeida A, Stewart V, Peuchen S, Land JM, Clark JB, Heales SJ (1997) Nitric oxide‐mediated mitochondrial damage in the brain: mechanisms and implications for neurodegenerative diseases. J Neurochem 68:2227–2240. [DOI] [PubMed] [Google Scholar]
- 3. Borson ND, Paul C, Lin X, Nevala WK, Strausbauch MA, Rodriguez M, Wettstein PJ (1997) Brain‐infiltrating cytolytic T lymphocytes specific for Theiler's virus recognize H2Db molecules complexed with a viral VP2 peptide lacking a consensus anchor residue. J Virol 71:5244–5250. [DOI] [PMC free article] [PubMed] [Google Scholar]
- 4. Clatch RJ, Lipton HL, Miller SD (1986) Characterization of Theiler's murine encephalomyelitis virus (TMEV)‐specific delayed‐type hypersensitivity responses in TMEV‐induced demyelinating disease: correlation with clinical signs. J Immunol 136:920–927. [PubMed] [Google Scholar]
- 5. Clatch RJ, Melvold RW, Miller SD, Lipton HL (1985) Theiler's murine encephalomyelitis virus (TMEV)‐induced demyelinating disease in mice is influenced by the H‐2D region: correlation with TEMV‐specific delayed‐type hypersensitivity. J Immunol 135:1408–1414. [PubMed] [Google Scholar]
- 6. De Stefano N, Matthews PM, Fu L, Narayanan S, Stanley J, Francis GS et al (1998) Axonal damage correlates with disability in patients with relapsing‐remitting multiple sclerosis. Results of a longitudinal magnetic resonance spectroscopy study. Brain 121:1469–1477. [DOI] [PubMed] [Google Scholar]
- 7. Deb C, Lafrance‐Corey RG, Schmalstieg WF, Sauer BM, Wang H, German CL et al (2010) CD8+ T cells cause disability and axon loss in a mouse model of multiple sclerosis. PloS ONE 5:e12478. [DOI] [PMC free article] [PubMed] [Google Scholar]
- 8. Denic A, Bieber A, Warrington A, Mishra PK, Macura S, Rodriguez M (2009) Brainstem 1H nuclear magnetic resonance (NMR) spectroscopy: marker of demyelination and repair in spinal cord. Ann Neurol 66:559–564. [DOI] [PMC free article] [PubMed] [Google Scholar]
- 9. Drescher KM, Pease LR, Rodriguez M (1997) Antiviral immune responses modulate the nature of central nervous system (CNS) disease in a murine model of multiple sclerosis. Immunol Rev 159:177–193. [DOI] [PubMed] [Google Scholar]
- 10. Howe CL, Adelson JD, Rodriguez M (2007) Absence of perforin expression confers axonal protection despite demyelination. Neurobiol Dis 25:354–359. [DOI] [PMC free article] [PubMed] [Google Scholar]
- 11. Johnson AJ, Njenga MK, Hansen MJ, Kuhns ST, Chen L, Rodriguez M, Pease LR (1999) Prevalent class I‐restricted T‐cell response to the Theiler's virus epitope Db:VP2121‐130 in the absence of endogenous CD4 help, tumor necrosis factor alpha, gamma interferon, perforin, or costimulation through CD28. J Virol 73:3702–3708. [DOI] [PMC free article] [PubMed] [Google Scholar]
- 12. Johnson AJ, Upshaw J, Pavelko KD, Rodriguez M, Pease LR (2001) Preservation of motor function by inhibition of CD8+ virus peptide‐specific T cells in Theiler's virus infection. FASEB J 15:2760–2762. [DOI] [PubMed] [Google Scholar]
- 13. Kerkvliet J, Zoecklein L, Papke L, Denic A, Bieber AJ, Pease LR et al (2009) Transgenic expression of the 3D polymerase inhibits Theiler's virus infection and demyelination. J Virol 83:12279–12289. [DOI] [PMC free article] [PubMed] [Google Scholar]
- 14. Lampert PW (1978) Autoimmune and virus‐induced demyelinating diseases. A review. Am J Pathol 91:176–208. [PMC free article] [PubMed] [Google Scholar]
- 15. Lin X, Njenga MK, Johnson AJ, Pavelko KD, David CS, Pease LR, Rodriguez M (2002) Transgenic expression of Theiler's murine encephalomyelitis virus genes in H‐2(b) mice inhibits resistance to virus‐induced demyelination. J Virol 76:7799–7811. [DOI] [PMC free article] [PubMed] [Google Scholar]
- 16. Lin X, Pease LR, Murray PD, Rodriguez M (1998) Theiler's virus infection of genetically susceptible mice induces central nervous system‐infiltrating CTLs with no apparent viral or major myelin antigenic specificity. J Immunol 160:5661–5668. [PubMed] [Google Scholar]
- 17. Lin X, Pease LR, Rodriguez M (1997) Differential generation of class I H‐2D‐ versus H‐2K‐restricted cytotoxicity against a demyelinating virus following central nervous system infection. Eur J Immunol 27:963–970. [DOI] [PubMed] [Google Scholar]
- 18. Lipton HL, Dal Canto MC (1976) Theiler's virus‐induced demyelination: prevention by immunosuppression. Science 192:62–64. [DOI] [PubMed] [Google Scholar]
- 19. Love S (1987) Distribution of Theiler's virus in the CNS of athymic nude mice: effect of varying the route of inoculation. J Neurol Sci 81:55–66. [DOI] [PubMed] [Google Scholar]
- 20. Matusevicius D, Navikas V, Soderstrom M, Xiao BG, Haglund M, Fredrikson S, Link H (1996) Multiple sclerosis: the proinflammatory cytokines lymphotoxin‐alpha and tumour necrosis factor‐alpha are upregulated in cerebrospinal fluid mononuclear cells. J Neuroimmunol 66:115–123. [DOI] [PubMed] [Google Scholar]
- 21. McGavern DB, Murray PD, Rivera‐Quinones C, Schmelzer JD, Low PA, Rodriguez M (2000) Axonal loss results in spinal cord atrophy, electrophysiological abnormalities and neurological deficits following demyelination in a chronic inflammatory model of multiple sclerosis. Brain 123 (Pt 3):519–531. [DOI] [PMC free article] [PubMed] [Google Scholar]
- 22. McGavern DB, Zoecklein L, Drescher KM, Rodriguez M (1999) Quantitative assessment of neurologic deficits in a chronic progressive murine model of CNS demyelination. Exp Neurol 158:171–181. [DOI] [PMC free article] [PubMed] [Google Scholar]
- 23. Mendez‐Fernandez YV, Johnson AJ, Rodriguez M, Pease LR (2003) Clearance of Theiler's virus infection depends on the ability to generate a CD8+ T cell response against a single immunodominant viral peptide. Eur J Immunol 33:2501–2510. [DOI] [PubMed] [Google Scholar]
- 24. Navikas V, He B, Link J, Haglund M, Soderstrom M, Fredrikson S et al (1996) Augmented expression of tumour necrosis factor‐alpha and lymphotoxin in mononuclear cells in multiple sclerosis and optic neuritis. Brain 119 (Pt 1):213–223. [DOI] [PubMed] [Google Scholar]
- 25. Navikas V, Matusevicius D, Soderstrom M, Fredrikson S, Kivisakk P, Ljungdahl A et al (1996) Increased interleukin‐6 mRNA expression in blood and cerebrospinal fluid mononuclear cells in multiple sclerosis. J Neuroimmunol 64:63–69. [DOI] [PubMed] [Google Scholar]
- 26. Pavelko KD, Howe CL, Drescher KM, Gamez JD, Johnson AJ, Wei T et al (2003) Interleukin‐6 protects anterior horn neurons from lethal virus‐induced injury. J Neurosci 23:481–492. [DOI] [PMC free article] [PubMed] [Google Scholar]
- 27. Pavelko KD, Pease LR, David CS, Rodriguez M (2007) Genetic deletion of a single immunodominant T‐cell response confers susceptibility to virus‐induced demyelination. Brain Pathol 17:184–196. [DOI] [PMC free article] [PubMed] [Google Scholar]
- 28. Paya CV, Patick AK, Leibson PJ, Rodriguez M (1989) Role of natural killer cells as immune effectors in encephalitis and demyelination induced by Theiler's virus. J Immunol 143:95–102. [PubMed] [Google Scholar]
- 29. Redford EJ, Kapoor R, Smith KJ (1997) Nitric oxide donors reversibly block axonal conduction: demyelinated axons are especially susceptible. Brain 120 (Pt 12):2149–2157. [DOI] [PubMed] [Google Scholar]
- 30. Rivera‐Quinones C, McGavern D, Schmelzer JD, Hunter SF, Low PA, Rodriguez M (1998) Absence of neurological deficits following extensive demyelination in a class I‐deficient murine model of multiple sclerosis. Nat Med 4:187–193. [DOI] [PMC free article] [PubMed] [Google Scholar]
- 31. Rodriguez M, David CS (1985) Demyelination induced by Theiler's virus: influence of the H‐2 haplotype. J Immunol 135:2145–2148. [PubMed] [Google Scholar]
- 32. Rodriguez M, David CS (1995) H‐2 Dd transgene suppresses Theiler's virus‐induced demyelination in susceptible strains of mice. J Neurovirol 1:111–117. [DOI] [PubMed] [Google Scholar]
- 33. Rodriguez M, Dunkel AJ, Thiemann RL, Leibowitz J, Zijlstra M, Jaenisch R (1993) Abrogation of resistance to Theiler's virus‐induced demyelination in H‐2b mice deficient in beta 2‐microglobulin. J Immunol 151:266–276. [PubMed] [Google Scholar]
- 34. Rodriguez M, Kenny JJ, Thiemann RL, Woloschak GE (1990) Theiler's virus‐induced demyelination in mice immunosuppressed with anti‐IgM and in mice expressing the xid gene. Microb Pathog 8:23–35. [DOI] [PubMed] [Google Scholar]
- 35. Rodriguez M, Lafuse WP, Leibowitz J, David CS (1986) Partial suppression of Theiler's virus‐induced demyelination in vivo by administration of monoclonal antibodies to immune‐response gene products (Ia antigens). Neurology 36:964–970. [DOI] [PubMed] [Google Scholar]
- 36. Rodriguez M, Leibowitz J, David CS (1986) Susceptibility to Theiler's virus‐induced demyelination. Mapping of the gene within the H‐2D region. J Exp Med 163:620–631. [DOI] [PMC free article] [PubMed] [Google Scholar]
- 37. Rodriguez M, Patick AK, Pease LR (1990) Abrogation of resistance to Theiler's virus‐induced demyelination in C57BL mice by total body irradiation. J Neuroimmunol 26:189–199. [DOI] [PubMed] [Google Scholar]
- 38. Rodriguez M, Pavelko KD, Njenga MK, Logan WC, Wettstein PJ (1996) The balance between persistent virus infection and immune cells determines demyelination. J Immunol 157:5699–5709. [PubMed] [Google Scholar]
- 39. Rodriguez M, Quddus J (1986) Effect of cyclosporin A, silica quartz dust, and protease inhibitors on virus‐induced demyelination. J Neuroimmunol 13:159–174. [DOI] [PubMed] [Google Scholar]
- 40. Rodriguez M, Sriram S (1988) Successful therapy of Theiler's virus‐induced demyelination (DA strain) with monoclonal anti‐Lyt‐2 antibody. J Immunol 140:2950–2955. [PubMed] [Google Scholar]
- 41. Roos RP, Firestone S, Wollmann R, Variakojis D, Arnason BG (1982) The effect of short‐term and chronic immunosuppression on Theiler's virus demyelination. J Neuroimmunol 2:223–234. [DOI] [PubMed] [Google Scholar]
- 42. Roos RP, Wollmann R (1984) DA strain of Theiler's murine encephalomyelitis virus induces demyelination in nude mice. Ann Neurol 15:494–499. [DOI] [PubMed] [Google Scholar]
- 43. Schmittgen TD, Livak KJ (2008) Analyzing real‐time PCR data by the comparative C(T) method. Nat Protoc 3:1101–1108. [DOI] [PubMed] [Google Scholar]
- 44. Sidman RL, Angevine JB, Pierce ET (1971) Atlas of the Mouse Brain and Spinal Cord. Harvard University Press: Cambridge. [Google Scholar]
- 45. Smith KJ, Kapoor R, Hall SM, Davies M (2001) Electrically active axons degenerate when exposed to nitric oxide. Ann Neurol 49:470–476. [PubMed] [Google Scholar]
- 46. Tsunoda I, Tanaka T, Saijoh Y, Fujinami RS (2007) Targeting inflammatory demyelinating lesions to sites of Wallerian degeneration. Am J Pathol 171:1563–1575. [DOI] [PMC free article] [PubMed] [Google Scholar]
- 47. von Herrath MG, Dockter J, Nerenberg M, Gairin JE, Oldstone MB (1994) Thymic selection and adaptability of cytotoxic T lymphocyte responses in transgenic mice expressing a viral protein in the thymus. J Exp Med 180:1901–1910. [DOI] [PMC free article] [PubMed] [Google Scholar]
- 48. Welsh CJ, Tonks P, Nash AA, Blakemore WF (1987) The effect of L3T4 T cell depletion on the pathogenesis of Theiler's murine encephalomyelitis virus infection in CBA mice. J Gen Virol 68:1659–1667. [DOI] [PubMed] [Google Scholar]
- 49. Xu H, Wawrousek EF, Redmond TM, Nickerson JM, Wiggert B, Chan CC, Caspi RR (2000) Transgenic expression of an immunologically privileged retinal antigen extraocularly enhances self tolerance and abrogates susceptibility to autoimmune uveitis. Eur J Immunol 30:272–278. [DOI] [PubMed] [Google Scholar]
Associated Data
This section collects any data citations, data availability statements, or supplementary materials included in this article.
Supplementary Materials
Figure S1. Individual brain pathology scores in wild‐type and transgenic FVB.Db (A?D) or FVB (E?H) mice. Brain pathology was quantified by using a four‐point grading system. Overall pattern of individual brain pathological scores across all strains showed no major differences. Only at three time points statistically significant differences were observed because of higher scores in individual mice rather than depicting more severe pathology in the whole group: (A) at 180 dpi, two FVB.Db mice had necrotic lesions in the striatum; (D) at 21 dpi, several FVB.Db.VP2121?130 mice had higher scores in the hippocampus and corpus callosum; and (G) at 45 dpi, one FVB.VP2 mouse showed more lesions in the cortex and corpus callosum.
Figure S2. Transgenic expression of virus capsid proteins did not cause pathological changes in non‐CNS tissues following intracerebral virus infection. FVB.VP1, FVB.VP2 and FVB.VP2121?130 mice were infected with TMEV or "sham" infected with PBS and sacrificed 7 days later. CNS as well as different non‐CNS tissues (liver, kidney, heart, spleen, lungs and muscle) were collected and examined pathologically for inflammation and injury. Inflammation and moderate tissue destruction were found in several brain regions, mostly in the striatum (A) and hippocampus (B). However, no inflammation was observed in non‐CNS organs: kidney (C), spleen (D), lung (E), liver (F), muscle (G) and heart (H). This figure shows panel of histologic sections from TMEV‐infected FVB.VP2 mice. Similar findings were observed when infecting FVB.VP1 mice or FVB.VP2121?130 mice. Tissue was embedded in paraffin, stained with hematoxylin and eosin and photographed at 20× magnification.
Figure S3. Spinal cord demyelination and inflammation is not different in each of two founder lines in FVB.VP1 and FVB.VP2 transgenic strains. FVB.VP1 and FVB.VP2 mice were genetically analyzed, and two founder lines were studied within each of these transgenic strains. For each strain, two lines were compared for demyelination (A and C) and inflammation (B and D) at multiple time points. Overall, no major differences were found except in the early disease inflammation scores (21 and 45 dpi) between the two VP1 lines. Stars denote statistically significant difference from the control.
Table S1. Primer sequences.
Table S2. Viral Transcripts in Brain and Spinal Cord.
Table S3. Brain Pathology.
Table S4. Spinal Cord Pathology?Meningeal Inflammation.
Table S5. Spinal Cord Pathology?Percent of Demyelinated Quadrants.
Table S6. Spinal Cord Pathology?Frequency of Demyelination.
Supporting info item
Supporting info item
Supporting info item
Supporting info item
Supporting info item