

Abstract
Few studies have investigated the association between genetic variation and obesity traits in Indian populations or the role of environmental factors as modifiers of these relationships. In the context of rapid urbanisation, resulting in significant lifestyle changes, understanding the aetiology of obesity is important. We investigated associations of FTO and MC4R variants with obesity traits in 3390 sibling pairs from four Indian cities, most of whom were discordant for current dwelling (rural or urban). The FTO variant rs9939609 predicted increased weight (0.09 Z-scores, 95% CI: 0.03, 0.15) and BMI (0.08 Z-scores, 95% CI: 0.02, 0.14). The MC4R variant rs17782313 was weakly associated with weight and hip circumference (P < .05). There was some indication that the association between FTO and weight was stronger in urban than that in rural dwellers (P for interaction = .03), but no evidence for effect modification by diet or physical activity. Further studies are needed to investigate ways in which urban environment may modify genetic risk of obesity.
1. Introduction
A large number of common genetic variants have been found to be associated with obesity phenotypes in Europeans [1–3]. Variants in the FTO (fat mass and obesity-associated) gene have demonstrated the strongest associations with obesity in Europeans [1, 4, 5]. However, results from a recent study in Indians from Pune (western India) suggest that FTO may be less strongly associated with obesity in South Asians [6]. Recently, association of genetic variants near the melanocortin 4 receptor (MC4R) gene with obesity traits has been reported in several European populations [2, 7, 8]. These associations have been replicated in a UK Indian population and a Sikh population in north India [9, 10]. In both studies, risk allele frequencies were higher than in Europeans.
The pathways by which these genetic variants contribute to obesity are not yet understood but there is some evidence that the effects of variants in FTO are modified by energy imbalance [11–14]. Several studies have shown that increases in body mass index (BMI) per risk allele are lower in people who engage in high levels of physical activity compared to less active people [11, 12, 15]. FTO has also been shown to be associated with dietary fat intake and overall energy consumption [13, 16–18]. However, the modifying effects of these environmental factors have not been consistently replicated [19–21]. This may reflect true population differences, study sample size, or interstudy heterogeneity of measurement of these lifestyle factors. In addition, within population variation of these environmental factors may not be large enough to detect effect modification.
India is currently experiencing rapid urbanisation, which is leading to the adoption of significant lifestyle changes [22]; in 2001, almost a third of the population lived in urban areas, but it is estimated that by 2025, half the population will be urban dwellers [23]. We have shown previously that rural to urban migration is associated with dietary changes such as increased fat intake and reductions in levels of physical activity [24]. These factors are likely to contribute to the markedly higher levels of obesity and diabetes seen in urban compared to rural populations [25]. Prevalence of obesity (BMI > 25 kg/m2) has been reported to be between 25 and 42% in urban areas compared to 10–22% in rural areas [24, 26–28]. Rural/urban living may, therefore, be a sufficiently strong exposure to demonstrate large interaction effects with genetic factors.
The Indian Migration Study was set up to investigate the impact of rural to urban migration on obesity and diabetes [29]. Using data on 3390 sibling pairs, we aimed to replicate associations of key variants in FTO (rs9939609) and near MC4R (rs12970134 and rs17782313) with a range of obesity phenotypes and investigate whether urban or rural environment alters the strength of these associations in this Indian population. We hypothesised that, if there is evidence of modification by environment, genetic effects would be stronger in urban than in rural dwellers.
2. Material and Methods
2.1. Study Population
The Indian Migration Study was nested within a cardiovascular risk factor surveillance system, which monitors risk factors in industry populations across several large cities in India [30]. Full details of the study recruitment have been described previously [29]. Genetic data was available for 6942 individuals recruited from four cities in India (Lucknow, Nagpur, Hyderabad, and Bangalore), of which 6780 were sibling pairs and 162 were unrelated individuals (147 from cousins (one half of cousin pairs) and friends, and 15 from single members of a sibling pair). The majority of sibling pairs (N = 1997 pairs) consisted of a rural to urban migrant factory worker and a sibling who had remained in a rural area. There were also 1152 urban-urban sibling pairs and 241 rural-rural sibling pairs. Ethical approval was obtained from the All India Institute of Medical Sciences Ethics Committee, reference number A-60/4/8/2004. Fieldwork commenced in March 2005 and ended in December 2007.
2.2. Measurements
2.2.1. Anthropometry
All participants were invited to attend for an examination at the factory they were recruited from [31]. Weight was measured in light indoor clothing (with shoes removed) using a digital weighing scale with 100 g accuracy (Model PS16, Beurer, Germany) and standing height using a portable plastic stadiometer (Leicester height measure, Chasmors Ltd, London) [24]. Waist and hip circumferences were measured twice using a non-stretch metallic tape with a blank lead-in (Chasmors metallic tape, Chasmors Ltd, London). Waist circumference was measured at the narrowest part of the abdomen between the ribs and the iliac crest and hip circumference at the widest part of the hips. Percentage body fat was calculated using standard formulae [32] from triceps and subscapular skinfold measures, which were taken three times using Holtain calipers.
2.2.2. Dwelling
Urban/rural status was defined according to current place of residence, since little difference was observed between rural-urban migrants and whole life urban dwellers in terms of their lifestyle and cardiovascular risk factors. The rural-urban migrants had lived, on average, for two decades in an urban area, with 85% having migrated at least 10 years prior to the study [24].
2.2.3. Lifestyle Factors
Both diet and physical activity were assessed by interview-administered questionnaires. Full details have been published previously [24]. Dietary fat intake (g/day) was calculated from a food frequency questionnaire, which asked participants about consumption (daily, weekly, monthly, or yearly) of 184 different food items. Metabolic equivalent tasks (MET) scores were calculated from participants' accounts of their activities in the previous month. Activity data were summarised as MET hours per day, with 1 MET being the equivalent to the energy expended whilst sitting quietly. Time spent doing moderate to vigorous physical activity (MVPA) (defined as: moderate 3–6 MET; vigorous > 6 MET) in a 24-hour period, and the average daily MET scores for each individual from moderate to vigorous activities were calculated. Both dietary and physical activity measures showed acceptable validity.
2.2.4. Genotyping
Blood samples were collected from all the individuals using EDTA vacutainers, and plasma samples were stored at −80°C for further use. All packed cell samples were transported on dry ice to Centre for Cellular and Molecular Biology, Hyderabad, India. Genomic DNA was isolated from all samples using salt precipitation method and DNA samples were plated in 96 deep well storage plates at a uniform concentration of 10 ng/λ. Each plate included 8 repeat samples (~10%) as a quality control measure. We used Sequenom-based Mass ARRAY assay technology to genotype three obesity-related single-nucleotide polymorphisms (SNPs), one in FTO (rs9939609) and two near MC4R (rs12970134 and rs17782313) as part of a common multiplex pool of 28 SNPs, collated from 20 genes associated with diabetes-related intermediate traits. The genotyping success rate was >95%, and results of duplicate samples had >97% concordance indicating high genotyping accuracy.
2.3. Statistical Analyses
Genotype frequencies were calculated in unrelated subjects (a single randomly chosen member from each family) (N = 3552) and tested for departure from Hardy-Weinberg proportions using the exact test implemented in PLINK (version 0.99p; (http://pngu.mgh.harvard.edu/~purcell/plink/)) [33].
Association analysis was carried out using the orthogonal family-based model of Fulker et al. [34]. This is a linear regression model in which the genetic effect is decomposed into between- and within-family effects, with inference performed on the within-family effect. This family based method is robust to population stratification, an important consideration since the data were collected from individuals of at least two broad ethnic groups in four cities across India, where high levels of population substructure exist [35].
Within this framework, multilevel models were fitted to the data in which sibling pair was modelled as a random effect and city of recruitment as the fixed effect. Analysis was restricted to full sib pairs (N = 3390 pairs), and additive models were assumed; for each SNP the major allele was the reference, and an effect estimate was calculated per copy of the minor allele. Associations between SNPs and age, sex adjusted Z scores of the quantitative phenotypes BMI, WHR, percent body fat, weight, waist circumference, and hip circumference were tested using a Wald test. We also tested separately for interaction between the within families genetic effect and sex and location (rural/urban) as effect modifiers in the models. We previously found differences between the sexes for lipids, glucose, and blood pressure [24]. In addition, we investigated whether there was evidence of interaction by dietary fat intake or physical activity measures (total MET, time spent on MVPA (min/day), MET from MVPA) (all in tertiles) by including these as interaction terms in separate models. Mixed effects logistic regression was performed to investigate the association of these SNPs with obesity, which was defined as BMI > 25 kg/m2 (in line with previously used cutoffs for obesity in Indians) [24].
We fitted all models in STATA (version 11.1) as the QTDT software [36], widely used for the Fulker model, does not implement effect modification. To verify our implementation, we compared the STATA results to QTDT for the analysis of main effects only and to MX [37] for the analysis of main effects and interactions (for full methods, see Supplementary Material available online at doi: 10.1155/2011/307542) and obtained similar results throughout. As another check, we repeated all analyses using the UNPHASED software [38] and obtained similar results, although in a number of cases UNPHASED had numerical difficulties in maximizing its likelihood.
3. Results
Genetic data was available for a total of 6942 individuals from all four cities. In the whole sample of unrelated individuals (N = 3552), there was no evidence for deviation from Hardy Weinberg equilibrium (HWE) for any of the SNPs (P all > .3) (Supplementary Table S1). Minor allele frequencies (MAFs) for rs9939609 (A allele), rs12970134 (A allele), and rs17782313 (C allele) were 0.33, 0.36, and 0.34, respectively, in this study. MAFs in each of the four cities are shown in Supplementary Tables S2–S5. There was no strong evidence that genotype frequency differed by city for either of the MC4R SNPs (rs12970134 and rs17782313) (P > .09) but evidence of genotype frequency difference was seen for the rs9939609 variant (P = .001). In the sample stratified by the four cities there was evidence of a deviation from HWE for rs9939609 in the Bangalore sample (P = .0001).
Data from 3390 sibling pairs were included in the main analyses. The characteristics of the study population stratified by sex and urban/rural location are shown in Table 1. We observed strong evidence for differences in obesity traits and lifestyle characteristics between individuals in rural and urban settings. Further analyses stratified by BMI (≤25 kg/m2, >25 kg/m2) are presented in Supplementary Table S6; these show strong associations between BMI and lifestyle characteristics and cardiovascular and metabolic outcomes.
Table 1.
Characteristics of the study population.
| All1 | Males1 | Females1 | |||||
|---|---|---|---|---|---|---|---|
| Urban | Rural | P2 | Urban | Rural | P2 | ||
| N | 6780 | 2276 | 1649 | 2025 | 830 | ||
| Sex (% Female) | 42 | ||||||
| Urbanisation (% urban) | 63 | ||||||
| Age (years) | 40.7 (0.13) | 42.9 (0.20) | 39.5 (0.28) | <.001 | 39.5 (0.20) | 40.2 (0.40) | .12 |
| Height (cm) | 160.3 (0.11) | 165.8 (0.14) | 165.6 (0.15) | .52 | 153.1 (0.13) | 152.4 (0.20) | .001 |
| Weight (kg) | 61.1 (0.15) | 66.7 (0.24) | 59.5 (0.28) | <.001 | 59.6 (0.27) | 52.5 (0.39) | <.001 |
| BMI (kg/m2) | 23.8 (0.05) | 24.3 (0.08) | 21.7 (0.09) | <.001 | 25.4 (0.11) | 22.6 (0.16) | <.001 |
| Waist circumference (cm) | 82.3 (0.14) | 87.9 (0.23) | 80.5 (0.28) | <.001 | 80.2 (0.24) | 75.2 (0.38) | <.001 |
| Hip circumference (cm) | 94.3 (0.11) | 94.7 (0.16) | 90.0 (0.19) | <.001 | 98.0 (0.24) | 92.8 (0.35) | <.001 |
| WHR | 0.87 (0.001) | 0.93 (0.001) | 0.89 (0.002) | <.001 | 0.82 (0.001) | 0.81 (0.002) | .001 |
| Percentage Body fat (%) | 26.8 (0.10) | 25.9 (0.14) | 20.8 (0.18) | <.001 | 31.9 (0.17) | 29.1 (0.26) | <.001 |
| % Diabetic | 6.8 | 9.8 | 3.6 | <.001 | 7.1 | 4.3 | .005 |
| Dietary Fat intake (g/day) | 83.1 (0.43) | 96.0 (0.80) | 79.9 (0.92) | <.001 | 79.6 (0.67) | 62.7 (1.01) | <.001 |
| Daily average MET score | 38.8 (0.06) | 38.4 (0.08) | 41.2 (0.14) | <.001 | 37.5 (0.08) | 38.4 (0.17) | <.001 |
BMI: bodymass index; WHR: waist-hip ratio; MET: metabolic equivalent tasks.
1Data presented as mean (standard error) or percentage (binary variables).
2 P value for difference between rural and urban samples from linear and logistic regression (for diabetes) with robust standard errors to account for sibling pairs.
3.1. Association of FTO and MC4R Variants with Obesity-Related Traits
We found evidence that the rs9939609 SNP was associated with BMI and weight (Table 2). BMI increased on average by 0.08 Z-scores (95% CI 0.02, 0.14) and weight by 0.09 Z-scores (95% CI 0.03, 0.15) per copy of the “A” allele. There was no strong evidence of association of this SNP with other obesity phenotypes such as waist circumference or WHR. When these analyses were repeated excluding the Bangalore sample, effect sizes were largely unaltered.
Table 2.
Associations of SNPs in FTO and MC4R genes with age, sex adjusted Z scores of obesity traits.
| rs9939609 | rs17782313 | |||||||
|---|---|---|---|---|---|---|---|---|
| N | Coeffa | 95% CI | P | N | Coeffa | 95% CI | P | |
| BMI | 6170 | 0.08 | (0.02, 0.14) | .009 | 6240 | 0.04 | (−0.01, 0.10) | .14 |
| WHR | 6160 | 0.01 | (−0.05, 0.07) | .77 | 6230 | −0.01 | (−0.07, 0.05) | .75 |
| Waist circumference | 6160 | 0.04 | (−0.02, 0.11) | .16 | 6230 | 0.04 | (−0.02, 0.10) | .22 |
| Weight | 6170 | 0.09 | (0.03, 0.15) | .003 | 6240 | 0.06 | (0.001, 0.12) | .045 |
| Hip circumference | 6168 | 0.05 | (−0.01, 0.11) | .08 | 6238 | 0.06 | (0.01, 0.12) | .03 |
| Body fat | 5968 | 0.02 | (−0.04, 0.08) | .57 | 6028 | 0.05 | (−0.01, 0.11) | .08 |
BMI, body mass index; WHR, waist-hip ratio
aCoefficents represent SD change per minor allele.
Since the two MC4R related SNPs are in strong linkage disequilibrium (r2 = 0.895 in the Gujarati Indian in Houston (GIH) population in HapMap 3) (http://hapmap.ncbi.nlm.nih.gov/), only the results for rs17782313 are presented. The results for rs12970134 are presented in Supplementary Tables and are similar, although associations with obesity traits are slightly weaker than for rs17782313 (Supplementary Table S7). Each additional copy of the “C” allele at the rs17782313 SNP was associated with a 0.06 Z-score (95% CI 0.001, 0.12) increase in weight and a 0.06 Z-score (95% CI 0.01, 0.12) increase in hip circumference. There was no strong statistical evidence for associations with other obesity-related traits, but effect sizes were in the expected direction (apart from WHR). Associations of the FTO and MC4R SNPs with obesity (BMI > 25 kg/m2) are shown in Supplementary Table S8. There was no evidence that the FTO SNP was associated with obesity (OR 1.08, 95% CI (0.91, 1.28), P = .39) but some weak evidence that the MC4R SNP was associated with increased odds of obesity (1.19, 95% CI (1.00, 1.40), P = .05).
3.2. Interaction Analyses between FTO and MC4R Variants and Demographic Characteristics
When we tested for interaction by sex, there was some weak evidence that genetic effects of FTO on weight were stronger in females than in males (Effect difference for females compared to males: 0.12 Z-scores, 95% CI: −0.01, 0.26) (P = .07) (Supplementary Table S9). The same pattern was seen for the other obesity traits (apart from WHR) with FTO but with no strong statistical support. No evidence for interaction with sex was seen with rs17782313.
The results of interaction analyses, looking at rural/urban dwelling as a potential effect modifier of genetic associations, are shown in Figure 1 and Table 3. The association of FTO with weight appeared to be stronger in urban dwellers compared to rural habitants, with urban living associated with an increase of 0.15 Z scores (95% CI 0.01, 0.29) per minor allele of rs9939609 more than rural dwelling. There was no strong evidence for any interactions between rural/urban dwelling and obesity-related traits with SNPs near MC4R (Table 3 and Supplementary Table S10).
Figure 1.
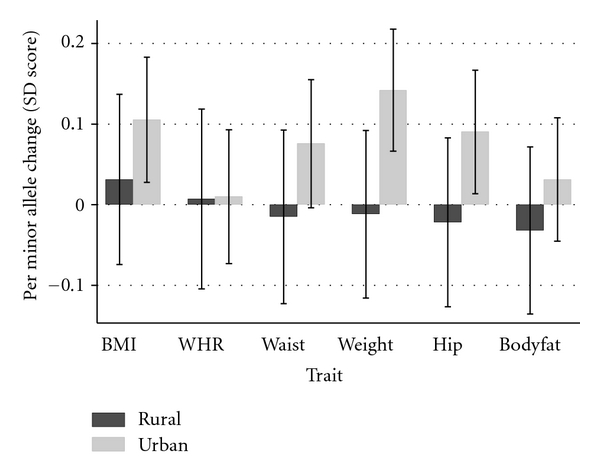
Associations between FTO and obesity traits by rural/urban location. BMI: body mass index; WHR: waist-hip ratio.
Table 3.
Interactions between FTO and MC4R SNPs and rural/urban dwelling in associations with obesity traits.
| rs9939609 | rs17782313 | |||||
|---|---|---|---|---|---|---|
| Coeffa | 95% CI | P | Coeffa | 95% CI | P | |
| BMI | 0.07 | (−0.07, 0.21) | .30 | −0.003 | (−0.14, 0.13) | .96 |
| WHR | 0.003 | (−0.14, 0.15) | .97 | −0.03 | (−0.17, 0.11) | .67 |
| Waist circumference | 0.09 | (−0.05, 0.23) | .21 | −0.03 | (−0.17, 0.11) | .65 |
| Weight | 0.15 | (0.01, 0.29) | .03 | 0.02 | (−0.12, 0.16) | .77 |
| Hip circumference | 0.11 | (−0.03, 0.25) | .12 | −0.006 | (−0.14, 0.13) | .93 |
| Body fat | 0.06 | (−0.08, 0.20) | .37 | −0.05 | (−0.19, 0.09) | .47 |
BMI: body mass index; WHR: waist-hip ratio.
aCoefficients represent differences in age, sex adjusted SD scores per minor allele in urban compared to rural dwellers.
Neither physical activity measures (total MET, time spent on MVPA and total MET from MVPA) nor dietary fat intake had any influence on the association of the FTO variant with BMI and weight (Supplementary Table S11).
4. Discussion
Our study has replicated associations of the FTO SNP rs9939609 with BMI and weight and the MC4R SNP rs17782313 with weight and hip circumference, but did not find statistical evidence for associations with other obesity-related traits. This study is the first to investigate gene environment interactions for FTO and obesity traits in an Indian population. We found some evidence that the strength of the association between FTO and weight was stronger in urban dwellers compared to rural dwellers suggesting that the effect of FTO on weight may be modified by environmental differences between rural and urban living in India.
In this population, the minor allele of rs9939609 was associated with increases in both BMI and weight (effect sizes 0.08 and 0.09 Z-scores, resp.) but not with regional measures of adiposity (waist circumference, hip circumference, and WHR) or with percentage body fat derived from skinfolds. In a population from Pune, western India [6], the reported association of BMI with the same FTO variant was 0.06 Z scores (95% CI: 0.01–0.10) which sits in the context of known associations in European populations (0.1 Z scores (95% CI: 0.09, 0.12) from the meta-analysis of Frayling et al.) [1]. Based on the observation that controlling for BMI did not completely abolish the association of rs9939609 with type 2 diabetes, Yajnik et al. argued that association of FTO variants may be weaker in Indians than in Europeans [6]. Meta-analyses of genetic studies in Indian populations would be of value to assess whether differences in strength of associations with FTO compared to Europeans exist.
The association of rs9939609 was limited to weight and BMI, suggesting that the FTO gene may be related more to overall body mass than to regional patterns of adiposity in Indians. The lack of association with WHR has been reported previously for Indians [6, 39]. In Europeans, the associations of most measures of adiposity with FTO have been found to be of similar magnitudes [1]. However, in one study of Europeans, the association of waist circumference with FTO was found to attenuate following adjustment for BMI which is consistent with an association with general rather than regional fat mass [40]. Genetic variants specifically associated with regional adiposity measures (waist circumference and WHR) in Europeans have been published recently [3, 41, 42], and it may be that these variants (or others yet to be discovered) have a greater influence on regional adiposity in Indians than FTO or MC4R. An alternative explanation for the differences in associations between measures may be the precision with which adiposity has been measured. BMI and weight are both relatively easy to measure and are probably measured with less error than circumference or skinfold measures. However, these results still need to be interpreted carefully since BMI does not reflect the actual fat mass percent in Indians [43].
Only associations with weight and hip circumference were successfully replicated with the MC4R-related SNP rs17782313, although effect sizes for other traits (apart from WHR) were in the expected direction. Allele frequencies were similar to those reported previously in Indian populations [9, 10]. These earlier studies, however, did find strong evidence for associations with the MC4R SNP rs12970134 (which is in strong LD with rs17782313) and BMI, weight, WHR, and waist circumference. Although BMI as a continuous trait did not reach significance, there was some evidence of an association with obesity (BMI > 25 kg/m2). The effect estimate from the quantitative trait analysis in this study (0.04 Z-score units) was of a similar magnitude to that found in a large meta-analysis of Europeans (0.05 Z-score units) [2] so the lack of evidence for association in this study may reflect lack of power in our study rather than a true null effect.
Our finding that the effect of FTO on weight was stronger in urban compared to rural dwellers is consistent with our prior hypothesis that genetic effects would be stronger in the urban environment, where the prevalence of environmental risk factors for obesity is much higher. Some caution must be taken when interpreting the interaction results, since multiple statistical tests have been performed; similar patterns were seen for BMI, waist, and hip circumferences, although there was no statistical evidence for differences with these traits. The sibling pair design of the Indian Migration Study allows the impact of migration on health outcomes to be studied rather than whole life environmental differences between urban and rural living since the sibling pairs have shared early life environment. Although we included all types of sibling pairs (both discordant and concordant for current dwelling), most rural dwellers had a rural to urban migrant sibling in the study, which suggests that the effect modification of FTO in this study is related to environmental factors postmigration that is in adulthood.
Urban dwellers in the Indian Migration Study (urban nonmigrants and rural to urban migrants) had lower daily average MET (metabolic equivalent tasks) scores and higher levels of dietary fat intake than rural dwellers, factors which have both been shown to be associated with larger effects of FTO on obesity traits [11, 12, 15, 16, 44]. We investigated diet and physical activity separately as potential effect modifiers of FTO to see if a possible gene environment interaction by rural/urban dwelling might be attributable to either of these specific lifestyle characteristics, but were unable to find evidence of effect modification with these factors. It is unlikely that the study was sufficiently powered to detect interactions with these variables, which are likely to have been measured with lower precision.
5. Conclusions
Genetic variants of obesity which have been found to be important in Europeans do play a role in determining obesity phenotypes in Indian populations, although our data suggests that associations of FTO with regional adiposity may be weaker in Indians. The urban environment, which is already known to be an important contributing factor to the obesity epidemic [25], may also modify genetic susceptibility to obesity through interaction with FTO. Variants near MC4R had relatively minor influence on these obesity-related phenotypes. Further dissection of the specific aspects of migration which increase risk of obesity and subsequent cardiovascular disease is needed to target interventions.
Supplementary Material
Supplementary Table S1: Genotype frequencies in sample of unrelated individuals from the whole study
Supplementary Table S2: Genotype frequencies in sample of unrelated individuals from Lucknow
Supplementary Table S3: Genotype frequencies in sample of unrelated individuals from Nagpur
Supplementary Table S4: Genotype frequencies in sample of unrelated individuals from Hyderabad
Supplementary Table S5: Genotype frequencies in sample of unrelated individuals from Bangalore
Supplementary Table S6: Demographic and cardiovascular and metabolic outcomes in the study population stratified by obesity
Supplementary Table S7: Associations of rs12970134 with age, sex adjusted Z-scores of obesity traits
Supplementary Table S8: Age, sex adjusted associations of SNPs in FTO and MC4R genes with obesity
Supplementary Table S9: Interactions between obesity SNPs and sex in associations with obesity traits
Supplementary Table S10: Interactions between rs12970134 and rural/urban dwelling in associations with obesity phenotypes
Supplementary Table S11: Interactions of FTO with tertiles of physical activity in associations with BMI and weight
Supplementary Table S12: MX analyses: Association between obesity SNPs and traits
Supplementary Table S13: MX analyses: Interactions between rural/urban location and genetic variants in their associations with obesity traits
The Indian Migration Study Group Comprises
New Delhi: K. Srinath Reddy, Dorairaj Prabhakaran, Tulsi Patel, Lakshmy Ramakrishnan, Ruby Gupta, and Tanica Lyngdoh; Lucknow: R. C. Ahuja, R. K. Saran; Nagpur: Prashant Joshi, and N. M. Thakre; Hyderabad: K. V. R. Sarma, S. Mohan Das, R. K Jain, S. S. Potnis, and S. Bhogadi; Bangalore: Anura V. Kurpad, Mario Vaz, A. V. Barathi, and Murali Mohan; Pune: Chittaranjan Yajnik; Bristol: George Davey Smith and Yoav Ben-Shlomo; London School of Hygiene & Tropical Medicine: Shah Ebrahim and Sanjay Kinra.
Acknowledgments
The authors are grateful to field staff conducting the migration study and to the participants. The Indian Migration Study was funded by the Wellcome Trust (Grant no. GR070797MF). The genetic work was funded by a Project Grant from the Wellcome Trust (083541/Z/07/Z). Amy Taylor is funded by a Wellcome Trust 4-year Ph.D. Studentship (Grant no. WT083431MA). The funder had no role in study design, data collection, analysis, interpretation, writing the report, or the decision to submit the article for publication. The researchers are all independent from the funding source. Dr. Timpson is funded by and Prof. Davey Smith works within the MRC Centre for Causal Analyses in Translational Epidemiology, which is capacity funded by Grant no. G0600705.
References
- 1.Frayling TM, Timpson NJ, Weedon MN, et al. A common variant in the FTO gene is associated with body mass index and predisposes to childhood and adult obesity. Science. 2007;316(5826):889–894. doi: 10.1126/science.1141634. [DOI] [PMC free article] [PubMed] [Google Scholar]
- 2.Loos RJF, Lindgren CM, Li S, et al. Common variants near MC4R are associated with fat mass, weight and risk of obesity. Nature Genetics. 2008;40(6):768–775. doi: 10.1038/ng.140. [DOI] [PMC free article] [PubMed] [Google Scholar]
- 3.Lindgren CM, Heid IM, Randall JC, et al. Genome-wide association scan meta-analysis identifies three loci influencing adiposity and fat distribution. PLoS Genetics. 2009;5(6) doi: 10.1371/journal.pgen.1000508. Article ID e1000508. [DOI] [PMC free article] [PubMed] [Google Scholar]
- 4.Cornes BK, Lind PA, Medland SE, Montgomery GW, Nyholt DR, Martin NG. Replication of the association of common rs9939609 variant of FTO with increased BMI in an Australian adult twin population but no evidence for gene by environment (G x E) interaction. International Journal of Obesity. 2009;33(1):75–79. doi: 10.1038/ijo.2008.223. [DOI] [PubMed] [Google Scholar]
- 5.Hakanen M, Raitakari OT, Lehtimäki T, et al. FTO genotype is associated with body mass index after the age of seven years but not with energy intake or leisure-time physical activity. Journal of Clinical Endocrinology and Metabolism. 2009;94(4):1281–1287. doi: 10.1210/jc.2008-1199. [DOI] [PubMed] [Google Scholar]
- 6.Yajnik CS, Janipalli CS, Bhaskar S, et al. FTO gene variants are strongly associated with type 2 diabetes in South Asian Indians. Diabetologia. 2009;52(2):247–252. doi: 10.1007/s00125-008-1186-6. [DOI] [PMC free article] [PubMed] [Google Scholar]
- 7.Tenesa A, Campbell H, Theodoratou E, et al. Common genetic variants at the MC4R locus are associated with obesity, but not with dietary energy intake or colorectal cancer in the Scottish population. International Journal of Obesity. 2009;33(2):284–288. doi: 10.1038/ijo.2008.257. [DOI] [PubMed] [Google Scholar]
- 8.Zobel DP, Andreasen CH, Grarup N, et al. Variants near MC4R are associated with obesity and influence obesity-related quantitative traits in a population of middle-aged people: studies of 14,940 danes. Diabetes. 2009;58(3):757–764. doi: 10.2337/db08-0620. [DOI] [PMC free article] [PubMed] [Google Scholar]
- 9.Chambers JC, Elliott P, Zabaneh D, et al. Common genetic variation near MC4R is associated with waist circumference and insulin resistance. Nature Genetics. 2008;40(6):716–718. doi: 10.1038/ng.156. [DOI] [PubMed] [Google Scholar]
- 10.Been LF, Nath SK, Ralhan SK, et al. Replication of association between a common variant near melanocortin-4 receptor gene and obesity-related traits in Asian sikhs. Obesity. 2010;18(2):425–429. doi: 10.1038/oby.2009.254. [DOI] [PubMed] [Google Scholar]
- 11.Andreasen CH, Stender-Petersen KL, Mogensen MS, et al. Low physical activity accentuates the effect of the FTO rs9939609 polymorphism on body fat accumulation. Diabetes. 2008;57(1):95–101. doi: 10.2337/db07-0910. [DOI] [PubMed] [Google Scholar]
- 12.Rampersaud E, Mitchell BD, Pollin TI, et al. Physical activity and the association of common FTO gene variants with body mass index and obesity. Archives of Internal Medicine. 2008;168(16):1791–1797. doi: 10.1001/archinte.168.16.1791. [DOI] [PMC free article] [PubMed] [Google Scholar]
- 13.Cecil JE, Tavendale R, Watt P, Hetherington MM, Palmer CNA. An obesity-associated FTO gene variant and increased energy intake in children. The New England Journal of Medicine. 2008;359(24):2558–2566. doi: 10.1056/NEJMoa0803839. [DOI] [PubMed] [Google Scholar]
- 14.Fischer J, Koch L, Emmerling C, et al. Inactivation of the Fto gene protects from obesity. Nature. 2009;458(7240):894–898. doi: 10.1038/nature07848. [DOI] [PubMed] [Google Scholar]
- 15.Vimaleswaran KS, Li S, Zhao JH, et al. Physical activity attenuates the body mass index-increasing influence of genetic variation in the FTO gene. American Journal of Clinical Nutrition. 2009;90(2):425–428. doi: 10.3945/ajcn.2009.27652. [DOI] [PubMed] [Google Scholar]
- 16.Timpson NJ, Emmett PM, Frayling TM, et al. The fat mass- and obesity-associated locus and dietary intake in children. American Journal of Clinical Nutrition. 2008;88(4):971–978. doi: 10.1093/ajcn/88.4.971. [DOI] [PMC free article] [PubMed] [Google Scholar]
- 17.Church C, Moir L, McMurray F, et al. Overexpression of Fto leads to increased food intake and results in obesity. Nature Genetics. 2010;42(12):1086–1092. doi: 10.1038/ng.713. [DOI] [PMC free article] [PubMed] [Google Scholar]
- 18.Tanofsky-Kraff M, Han JC, Anandalingam K, et al. The FTO gene rs9939609 obesity-risk allele and loss of control over eating. American Journal of Clinical Nutrition. 2009;90(6):1483–1488. doi: 10.3945/ajcn.2009.28439. [DOI] [PMC free article] [PubMed] [Google Scholar]
- 19.Liu G, Zhu H, Lagou V, et al. FTO variant rs9939609 is associated with body mass index and waist circumference, but not with energy intake or physical activity in European- and African-American youth. BMC Medical Genetics. 2010;11(1, article 57) doi: 10.1186/1471-2350-11-57. [DOI] [PMC free article] [PubMed] [Google Scholar]
- 20.Lappalainen TJ, Tolppanen A-M, Kolehmainen M, et al. The common variant in the FTO gene did not modify the effect of lifestyle changes on body weight: the finnish diabetes prevention study. Obesity. 2009;17(4):832–836. doi: 10.1038/oby.2008.618. [DOI] [PubMed] [Google Scholar]
- 21.Hakanen M, Raitakari OT, Lehtimäki T, et al. FTO genotype is associated with body mass index after the age of seven years but not with energy intake or leisure-time physical activity. Journal of Clinical Endocrinology and Metabolism. 2009;94(4):1281–1287. doi: 10.1210/jc.2008-1199. [DOI] [PubMed] [Google Scholar]
- 22.Reddy KS, Shah B, Varghese C, Ramadoss A. Responding to the threat of chronic diseases in India. Lancet. 2005;366(9498):1744–1749. doi: 10.1016/S0140-6736(05)67343-6. [DOI] [PubMed] [Google Scholar]
- 23.Yadav K, Krishnan A. Changing patterns of diet, physical activity and obesity among urban, rural and slum populations in North India. Obesity Reviews. 2008;9(5):400–408. doi: 10.1111/j.1467-789X.2008.00505.x. [DOI] [PubMed] [Google Scholar]
- 24.Ebrahim S, Kinra S, Bowen L, et al. The effect of rural-to-urban migration on obesity and diabetes in india: a cross-sectional study. PLoS Medicine. 2010;7(4) doi: 10.1371/journal.pmed.1000268. Article ID e1000268. [DOI] [PMC free article] [PubMed] [Google Scholar]
- 25.Misra A, Khurana L. The metabolic syndrome in South Asians: epidemiology, determinants, and prevention. Metabolic Syndrome and Related Disorders. 2009;7(6):497–514. doi: 10.1089/met.2009.0024. [DOI] [PubMed] [Google Scholar]
- 26.Deepa M, Farooq S, Datta M, Deepa R, Mohan V. Prevalence of metabolic syndrome using WHO, ATPIII and IDF definitions in Asian Indians: the Chennai Urban Rural Epidemiology Study (CURES-34) Diabetes/Metabolism Research and Reviews. 2007;23(2):127–134. doi: 10.1002/dmrr.658. [DOI] [PubMed] [Google Scholar]
- 27.Gupta R, Deedwania PC, Gupta A, Rastogi S, Panwar RB, Kothari K. Prevalence of metabolic syndrome in an Indian urban population. International Journal of Cardiology. 2004;97(2):257–261. doi: 10.1016/j.ijcard.2003.11.003. [DOI] [PubMed] [Google Scholar]
- 28.Chow C, Cardona M, Raju PK, et al. Cardiovascular disease and risk factors among 345 adults in rural India-the Andhra Pradesh Rural Health Initiative. International Journal of Cardiology. 2007;116(2):180–185. doi: 10.1016/j.ijcard.2006.03.043. [DOI] [PubMed] [Google Scholar]
- 29.Lyngdoh T, Kinra S, Shlomo YB, et al. Sib-recruitment for studying migration and its impact on obesity and diabetes. Emerging Themes in Epidemiology. 2006;3, article 2 doi: 10.1186/1742-7622-3-2. [DOI] [PMC free article] [PubMed] [Google Scholar]
- 30.Reddy KS, Prabhakaran D, Chaturvedi V, et al. Methods for establishing a surveillance system for cardiovascular diseases in Indian industrial populations. Bulletin of the World Health Organization. 2006;84(6):461–469. doi: 10.2471/blt.05.027037. [DOI] [PMC free article] [PubMed] [Google Scholar]
- 31.Kinra S, Bowen LJ, Lyngdoh T, et al. Sociodemographic patterning of non-communicable disease risk factors in rural India: a cross sectional study. BMJ. 2010;341 doi: 10.1136/bmj.c4974. Article ID c4974. [DOI] [PMC free article] [PubMed] [Google Scholar]
- 32.Durnin JVGA, Womersley J. Body fat assessed from total body density and its estimation from skinfold thickness: measurements on 481 men and women aged from 16 to 72 years. British Journal of Nutrition. 1974;32(1):79–97. doi: 10.1079/bjn19740060. [DOI] [PubMed] [Google Scholar]
- 33.Purcell S, Neale B, Todd-Brown K, et al. PLINK: a tool set for whole-genome association and population-based linkage analyses. American Journal of Human Genetics. 2007;81(3):559–575. doi: 10.1086/519795. [DOI] [PMC free article] [PubMed] [Google Scholar]
- 34.Fulker DW, Cherny SS, Sham PC, Hewitt JK. Combined linkage and association sib-pair analysis for quantitative traits. American Journal of Human Genetics. 1999;64(1):259–267. doi: 10.1086/302193. [DOI] [PMC free article] [PubMed] [Google Scholar]
- 35.Reich D, Thangaraj K, Patterson N, Price AL, Singh L. Reconstructing Indian population history. Nature. 2009;461(7263):489–494. doi: 10.1038/nature08365. [DOI] [PMC free article] [PubMed] [Google Scholar]
- 36.Abecasis GR, Cardon LR, Cookson WOC. A general test of association for quantitative traits in nuclear families. American Journal of Human Genetics. 2000;66(1):279–292. doi: 10.1086/302698. [DOI] [PMC free article] [PubMed] [Google Scholar]
- 37.Neale M. Statistical Modeling with Mx. Richmond, Va, USA: Department of Human Genetics, MCV; 1997. [Google Scholar]
- 38.Dudbridge F. Likelihood-based association analysis for nuclear families and unrelated subjects with missing genotype data. Human Heredity. 2008;66(2):87–98. doi: 10.1159/000119108. [DOI] [PMC free article] [PubMed] [Google Scholar]
- 39.Zabaneh D, Balding DJ. A genome-wide association study of the metabolic syndrome in Indian Asian men. PLoS ONE. 2010;5(8) doi: 10.1371/journal.pone.0011961. Article ID e11961. [DOI] [PMC free article] [PubMed] [Google Scholar]
- 40.Kring SII, Holst C, Zimmermann E, et al. FTO gene associated fatness in relation to body fat distribution and metabolic traits throughout a broad range of fatness. PLoS ONE. 2008;3(8) doi: 10.1371/journal.pone.0002958. Article ID e2958. [DOI] [PMC free article] [PubMed] [Google Scholar]
- 41.Heard-Costa NL, Carola Zillikens M, Monda KL, et al. NRXN3Is a novel locus for waist circumference: a genome-wide association study from the CHARGE consortium. PLoS Genetics. 2009;5(6) doi: 10.1371/journal.pgen.1000539. Article ID e1000539. [DOI] [PMC free article] [PubMed] [Google Scholar]
- 42.Heid IM, Jackson AU, Randall JC, et al. Meta-analysis identifies 13 new loci associated with waist-hip ratio and reveals sexual dimorphism in the genetic basis of fat distribution. Nature Genetics. 2010;42(11):949–960. doi: 10.1038/ng.685. [DOI] [PMC free article] [PubMed] [Google Scholar]
- 43.Deurenberg-Yap M, Chew SK, Deurenberg P. Elevated body fat percentage and cardiovascular risks at low body mass index levels among Singaporean Chinese, Malays and Indians. Obesity Reviews. 2002;3(3):209–215. doi: 10.1046/j.1467-789x.2002.00069.x. [DOI] [PubMed] [Google Scholar]
- 44.Cauchi S, Stutzmann F, Cavalcanti-Proença C, et al. Combined effects of MC4R and FTO common genetic variants on obesity in European general populations. Journal of Molecular Medicine. 2009;87(5):537–546. doi: 10.1007/s00109-009-0451-6. [DOI] [PubMed] [Google Scholar]
Associated Data
This section collects any data citations, data availability statements, or supplementary materials included in this article.
Supplementary Materials
Supplementary Table S1: Genotype frequencies in sample of unrelated individuals from the whole study
Supplementary Table S2: Genotype frequencies in sample of unrelated individuals from Lucknow
Supplementary Table S3: Genotype frequencies in sample of unrelated individuals from Nagpur
Supplementary Table S4: Genotype frequencies in sample of unrelated individuals from Hyderabad
Supplementary Table S5: Genotype frequencies in sample of unrelated individuals from Bangalore
Supplementary Table S6: Demographic and cardiovascular and metabolic outcomes in the study population stratified by obesity
Supplementary Table S7: Associations of rs12970134 with age, sex adjusted Z-scores of obesity traits
Supplementary Table S8: Age, sex adjusted associations of SNPs in FTO and MC4R genes with obesity
Supplementary Table S9: Interactions between obesity SNPs and sex in associations with obesity traits
Supplementary Table S10: Interactions between rs12970134 and rural/urban dwelling in associations with obesity phenotypes
Supplementary Table S11: Interactions of FTO with tertiles of physical activity in associations with BMI and weight
Supplementary Table S12: MX analyses: Association between obesity SNPs and traits
Supplementary Table S13: MX analyses: Interactions between rural/urban location and genetic variants in their associations with obesity traits