

Abstract
Transcranial magnetic stimulation (TMS) has well-established applications in basic neuroscience and promising applications in neurological and psychiatric disorders. However the underlying mechanisms of TMS-induced alterations in brain function are not well understood. As a result, treatment design parameters are determined ad hoc and not informed by any coherent theory or model. Once the mechanisms underlying TMS’s modulatory effects on brain systems are better understood and modeled, TMS’s potential as a therapeutic and/or investigative tool will be more readily explored and exploited. An animal model is better suited to study different TMS variables, therefore we developed a baboon model to facilitate testing of some of the current theoretical models of TMS interactions with brain regions. We have demonstrated the feasibility of this approach by successfully imaging cerebral blood flow (CBF) changes with H215O positron emission tomography imaging during high-frequency, suprathreshold repetitive TMS in the primary motor cortex of five healthy, adult baboons.
Keywords: TMS, fMRI, PET, animal models, motor cortex
INTRODUCTION
Over the past three decades, researchers and clinicians have used transcranial magnetic stimulation (TMS) for the diagnosis, characterization and treatment of several neurological effects and psychiatric disorders; including recent U.S. Food and Drug Administration approval for TMS use in depression and preoperative motor mapping. At present, human treatment trials lack a strong theoretical basis for selecting optimal ranges for a myriad of treatment parameters, including localizing target area, intensity, rate, pulse pattern, number of pulses, interstimulus interval, and number of sessions. While these TMS treatment parameters could be exhaustively explored in humans, this would be inordinately costly and time consuming. A viable animal model—once developed—would allow the systematic exploration of TMS treatment parameters in a rapid, cost-effective manner.
In addition, although several theoretical models of the mechanism(s) of TMS have been proposed—including activations of horizontal fibers (Day et al., 1989), direct axonal excitation (Roth & Basser, 1990; Amassian et al., 1992; Nagarajan et al., 1993) and cortical columns (Fox et al., 2004)—none have been experimentally tested in vivo. Therefore, an animal model may provide a suitable medium for investigation of TMS’ mechanism(s) of action.
Old-world nonhuman primates (NHPs), from an evolutionary aspect, are very closely related to humans. After a survey of all available NHPs, we identified the baboon to be suitable because of its large brain size (relative to macaques) and the animal’s simple cortical gyrification patterns—see Figure 1. The baboon’s large brain size makes them more suitable for magnetic resonance imaging (MRI) and positron emission tomography (PET) studies, increasing its potential as a possible model for functional imaging studies of ischemia and neurological disorders—e.g. stroke (Fukuda & del Zoppo 2003) and epilepsy (Szabó et al., 2008; Szabó et al., 2011). The baboon’s larger brain size also permits the use of standard (human) TMS coils since the induced electric fields (E-fields) will be focally distributed in a larger brain volume than in smaller NHPs—i.e. macaques (Ohnishi et al., 2004; Hayashi et al., 2004).
Figure 1.
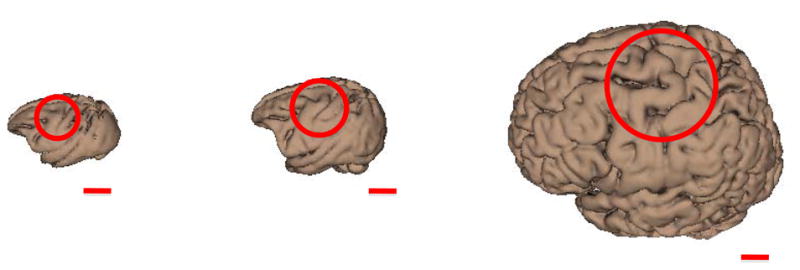
Comparison of macaque (left; Black et al., 2001b), baboon (middle; Black et al., 2001a), and human (right; Kochunov et al., 2002) brain size and gyrification. Circles indicate regions associated with the primary motor cortex of the hand. The red lines represent lengths of 2 cm.
Once developed, a baboon TMS model may be used: 1) to further test and refine aiming theories (e.g. horizontal fiber theory vs. cortical column cosine (C3) theory), 2) to test effects of stimulation parameters including rate, intensity, pulse pattern, etc. (in both local and remote brain regions), 3) to study connectivity differences between disease groups (e.g., epileptic vs non-epileptic), 4) to study treatment effects of stimulation over time (both locally and remotely), and 5) to study pharmacological manipulations on (2)–(4).
Once TMS treatment parameters are optimized in the animal model we may then translate this information to human treatment trials, thereby accelerating the clinical translation of TMS research. Towards this goal, we developed 1) structural and functional MRI (fMRI) protocols, 2) image-guided TMS delivery techniques, and 3) H215O PET protocols in a lightly anesthetized baboon. We have demonstrated the feasibility of this approach by applying image-guided, high frequency, suprathreshold, repetitive TMS (rTMS) to the baboon’s primary motor cortex during H215O PET imaging. We have previously presented parts of this research in abstract form (Salinas et al., 2010a).
METHODS
Animal Preparation
Five normal, adult baboons (Papio hamadryas anubis; 4 females) with body weight of 16.4 ± 2.4 kg (mean ± SEM) were studied in accordance with the policies of the Institutional Animal Care and Use Committee of the University of Texas Health Science Center at San Antonio. Before imaging, each animal was screened for neurological disorders (i.e. epilepsy) using electroencephalographic (EEG) techniques described by Szabó et al., 2005. The anesthetized animal preparation for optimized physiological stability and functional imaging responses has been described previously in Wey et al., 2010 and Wey et al., 2011. Briefly, for each imaging procedure (MRI and PET), each animal received an injection of intramuscular ketamine (5 mg/kg) to facilitate oral intubation and catheterization of a venous delivery line; intramuscular atropine (0.3 mg) was administered to reduce oropharyngeal secretions. During each imaging session, we maintained sedation with continuous i.v. administration of ketamine (5–6 mg/kg/hr) and vecuronium (0.25 mg/kg/hr)—a paralytic that acts at the neuromuscular junction. Upon conclusion of the imaging session, we administered atropine (0.6–1.2 mg, i.v.) and neostigmine (0.5–2.0 mg, i.v.) to reverse muscle paralysis. During the entire procedure, the animals’ respiration, heart rate and oxygenation were monitored.
TMS Image-guidance: Magnetic Resonance Imaging
All TMS delivery was image-guided, utilizing high-resolution structural and functional magnetic resonance images (fMRIs) using techniques described in Wey et al., 2010, 2011. All MRIs were performed on a Siemens TIM-Trio 3T clinical scanner using a body radiofrequency (RF) transmission coil with a 12-channel head RF receiver coil (Siemens, Erlangen, Germany). We obtained high-resolution anatomical images using an MP-RAGE sequence (TR/TE/ip angle = 2300 ms/3.66 ms/13°) with slice-select inversion recovery pulses (TI = 751 ms), FOV = 128 mm × 128 mm × 80 mm, and 0.5 mm isotropic spatial resolution. We used the anatomical MRIs for co-registration between imaging modalities (MRI and PET) in order to analyze of each animal’s H215O PET images in a standard baboon brain template (Black et al., 2001a).
Blood-oxygen-level dependent (BOLD) fMRI was acquired using gradient-echo, echo-planar imaging (EPI; TR/TE = 2.5 s/30 ms), FOV = 150 mm × 150 mm × 48 mm, and spatial resolutions of 1.5 mm × 1.5 mm × 4 mm. Somatosensory stimulation was applied to the animal’s right hand via a custom-made pneumatic-driven vibrotactile stimulator (Wey et al., 2010); vibrotactile stimulations were applied—at a stimulation frequency of 5 Hz—using an 50 second on/off block design. We processed the fMRI data using the FEAT toolbox (Woolrich et al., 2009) in the FMRIB’s Software Library (FSL; Smith et al., 2004). The resulting fMRIs were utilized to determine the location of each baboon’s primary sensory cortex representation of the right hand (S1hand). The S1hand and primary motor cortex representation of the hand (M1hand) representations lie directly across the central sulcus from one another (Penfield & Boldrey 1937). Therefore we determined each animal’s M1hand location (i.e. target location) to be the site in the precentral gyrus which is adjacent to that animal’s S1hand fMRI activation.
Repetitive Transcranial Magnetic Stimulation
We used a MagPro Cool-B65 figure-of-eight rTMS coil connected to a MagPro R30 Magnetic Stimulation Unit (MagVenture A/S, Farum, Denmark) for each rTMS procedure. The TMS coil’s site of maximal electric field induction (i.e. “hot spot”) was determined using methods developed by Salinas et al., 2007 and Salinas et al., 2009. These articles describe techniques using an E-field probe to measure the E-field vectors induced by each TMS pulse in the volume below the coil.
Using each animal’s fMRI map of the S1hand and the corresponding target locations for M1hand, we determined the scalp location closest to the M1hand site. We then measured the distances from this scalp location to specific anatomical landmarks (nasion, inion, earholes). Finally, the location of the maximum induced E-field was then used to stereotactically position the TMS coil over each animal’s left primary motor cortex (M1hand) while lying supine in the PET scanner—see Figure 2. Once positioned, the TMS coil—i.e. E-field and current direction—was oriented perpendicular to the animal’s central sulcus (with the E-field directed antero-medially, towards the animal’s snout—henceforth referred to as “B-snout”); this approach is consistent with the C3 aiming theory proposed by Fox et al., 2004. We applied single pulses of TMS to each baboon’s left M1hand to visually establish each animal’s resting motor threshold (RMT) at the first dorsal interosseous (FDI) muscle of the contralateral hand; the RMT was defined as the minimum intensity of stimulation capable of producing FDI muscle contractions in at least 5 out of 10 trials. Once each baboon’s RMT was found, a one-time bolus injection of vecuronium was given to eliminate movement throughout the PET session. Each baboon underwent one stimulation condition at 5 Hz rTMS, which has been reported to demonstrate increased cortical excitability (Wu et al., 2000; Siebner et al., 2001). The rTMS was applied at 120% RMT continuously for 90 seconds (i.e. 450 pulses). During each scan, the rTMS began 30 seconds before the injection of 15O-labeled water and continued until 40 seconds after the bolus arrival in the brain. The combination of rTMS frequency, stimulus duration, and TMS intensity fell within published rTMS safety guidelines (Wassermann, 1998). One sham condition—with TMS coil offset 10 cm from the vertex (Figure 2)—was employed to represent the baseline scan.
Figure 2.

(Left) rTMS applied to M1hand. rTMS was delivered to the targeted cortex (120% RMT) at 5 Hz. (Right) Sham rTMS applied 10 cm from the vertex at 5Hz.
Electroencephalography
We performed EEG recordings throughout the rTMS/PET sessions to monitor the level of sedation and any possible onset of seizure activity brought on by rTMS. After the baboons were sedated, we positioned eight cephalic electrodes—at FP1, FP2, T3, C4, O1, O2, ground, and reference sites (e.g. 10–20 EEG system)—using EEG electrode paste and secured them with collodion-soaked gauze strips. The electrodes were positioned at sites distant (greater than 4 cm) from the TMS coil’s main axis of focality (Figure 2); this decreased the possibility of the electrodes experiencing Joule heating during rTMS—which could burn the scalp (Roth et al., 1992). The electrodes were connected to a portable, laptop-based EEG acquisition machine (Nihon-Kohden, Tokyo, Japan) which enabled real-time monitoring of the and the EEG waveforms; the results of each EEG recording were also reviewed after each rTMS/PET imaging session by a board-certified neurologist (C.Á.S.).
Positron Emission Tomography
PET data were acquired with a CTI EXACT HR+ scanner (Knoxville, TN). Sixty-three contiguous slices (2.5 mm thick) in a transaxial eld of view of 15.5 cm were acquired. Images were corrected by measured attenuation using 68Ge/68Ga transmission scans and reconstructed at an in-plane resolution of 7-mm full width at half maximum (FWHM) and an axial resolution of 6.5-mm FWHM. Water labeled with oxygen-15 (H215O, half-life of 122 s) was administered intravenously—740 MBq H215O dose/scan—and cerebral blood ow (CBF) was measured using a bolus technique (Fox et al., 2006). We applied each condition (5Hz rTMS and sham) once during each PET session. We immobilized each baboon in the PET scanner using a custom-made, padded animal restraint (Figure 2).
Data Analysis
We performed image preprocessing using previously validated methods and in-house software (Fox et al., 2004). PET images were reconstructed into 60 slices (2 mm thick) with an image matrix size of 60 × 128 × 128, using a 5 mm Hann filter resulting in images with a spatial resolution of approximately 7 mm (full-width at half-maximum (FWHM)). PET images were corrected for head motion using the MCFLIRT tool (Jenkinson et al., 2002) in the FMRIB’s Software Library (FSL; Smith et al., 2004); the PET and MRI images were spatially transformed to a standardized baboon brain space (Black et al., 2001a) and co-registered using the Convex Hull algorithm (Lancaster et al., 1999). Regional tissue uptake of 15O-water was value normalized to a whole-brain (global) mean of 1000 counts. Further data analyses were performed using Multiple Image Processing Station (MIPS) and Multi-Image Analysis GUI (MANGO) software packages created at the Research Imaging Institute, UTHSCSA.
The images were analyzed using voxelwise statistical parametric images (SPIs). Group z-score images (SPI{z}) were obtained by contrasting each animal’s task state (5 Hz rTMS) with a control state (sham TMS) using the pooled standard deviation. The objective of the analysis was to determine the locations of M1 response induced by 5Hz rTMS and its connected regions. Only Z scores corresponding to p ≤ 0.01 (non-corrected) are reported here.
RESULTS
We monitored sedation level and seizure activity (via EEG) during each animal’s rTMS/PET session and found no instances of ictal, interictal or abnormal brain activity. After each imaging session, we recovered and monitored each animal for a period of one hour. During this period, each animal exhibited normal behavior—including regular food intake and activity level. No animals demonstrated any evidence of adverse effects of rTMS during (or after) their respective imaging sessions.
Targeting Efficacy
Robust fMRI responses were obtained in the S1hand area of 4/5 anesthetized baboons (Figure 3). The location of each S1hand area was used to determine the target location of the TMS coil (M1hand). TMS coil orientation was manually adjusted to a B-snout orientation. The M1hand area of the one animal that did not demonstrate a significant S1hand activation was determined using the animal’s structural MRI (Figure 3). Slight corrections to the predetermined TMS coil position and orientation (less than ±2 mm and ±5°, respectively) were needed to elicit motor responses of the FDI muscle in all of the animals. We successfully established each animal’s RMT and (prior to implementation of the paralytic) consistently observed FDI muscle contractions in 5/5 animals with single-pulse TMS.
Figure 3.

(Top) fMRIs of the baboon during vibrotactile stimulation of the right hand. Each animal’s somatosensory activations were used to target the M1hand region; the target locations are depicted as red circles. (Bottom) TMS-induced brain activations measured using H215O PET. Local CBF responses in the M1hand region were observed in 4/5 animals; the grouped functional data (right) represents the animals with M1hand CBF responses.
The suprathreshold TMS-induced CBF response observed at the site of stimulation (Figure 3) was on the sulcal bank of the precentral gyrus, immediately facing the S1 region used for image-guided targeting in 4/5 animals; animal “M4” did not demonstrate a CBF response in the M1hand area. The mean cortical thickness measurement—taken from the convexity of the gyral surface—was 2.38 ± 0.27 mm (Table 1), whereas the M1hand response’s center-of-mass location (4.78 ± 1.08 mm) was deeper than the gray matter layer of the gyral crown—indicating a sulcal TMS-induced brain response.
Table 1.
Cortical thickness and TMS-induced M1 brain activation depth measurements for the data shown in Figure 3.
| Animal | Cortical Thickness (mm) | Distance of Center of Mass to Gyral Surface (mm) |
|---|---|---|
| M1 | 2.83 | 4.24 |
| M2 | 2.24 | 4.24 |
| M3 | 2.24 | 4.24 |
| M4 | 2.24 | - |
| M5 | 2.24 | 6.40 |
|
| ||
| Average | 2.38 | 4.78 |
Local and Remote CBF Responses
M1 stimulation produced robust, highly discrete remote responses—both excitatory (increased CBF) and inhibitory (decreased CBF)—in a large number of regions connected to M1 (n = 4; Figure 4). We observed strong brain activity in the ipsilateral and homologous contralateral M1 stimulation sites during 5Hz rTMS (compared to a baseline sham condition)—indicating successful TMS delivery to the targeted M1. In addition, we also found several cortico-cortical and sub-cortical connections between the motor and limbic areas. The supplementary motor area (SMA) and cingulate motor areas exhibited decreases in brain activity during suprathreshold 5Hz rTMS when compared to the sham condition (Table 2). We also observed bilateral activations in the striatum and a contralateral deactivation in the thalamus.
Figure 4.

Regional CBF effects of H215O PET during concurrent 5Hz rTMS 9 (n = 4). The functional images are overlaid onto a baboon MRI template (Black et al., 2001a). The anterior commissure is located at (0 mm, 0 mm, 0 mm).
Table 2.
Regions of brain activity during 5 Hz rTMS compared to 5 Hz sham baseline condition (n = 4).
| Region of Interest | Area† | Coordinates‡ (mm)
|
Volume (mm3) | Z-score | p-value (non-corrected) | |||
|---|---|---|---|---|---|---|---|---|
| x | y | z | ||||||
| Ipsilateral | § Dorsal Precentral | 4 | −13 | −6 | 29 | 992 | 3.8196 | 0.00007 |
| Supplementary Motor Area | F3 | −4 | 0 | 25 | 984 | −3.5887 | 0.00017 | |
| Ventral Precentral | 4C | −31 | 5 | 3 | 440 | −2.7076 | 0.00341 | |
| Dorsolateral Prefrontal | 8Bd | −7 | 18 | 20 | 1000 | 3.8016 | 0.00007 | |
| Posterior Cingulate | 23c | −2 | −17 | 23 | 936 | −3.319 | 0.00045 | |
| Medial Prefrontal | 10m | 0 | 19 | 0 | 944 | 3.4959 | 0.00024 | |
| Orbitofrontal | 12 | −14 | 15 | 11 | 760 | 3.0464 | 0.00116 | |
| Orbitofrontal | 47/12 | −21 | 16 | −1 | 456 | 2.9385 | 0.00166 | |
| Postcentral | 3a/b | −21 | −12 | 30 | 560 | −3.6247 | 0.00014 | |
| Superior Parietal Lobule | 5 | −13 | −14 | 20 | 880 | −3.6427 | 0.00013 | |
| Parietal Operculum | SII | −23 | 6 | 9 | 448 | 2.3631 | 0.00911 | |
| Insula | Ig | −18 | −9 | 4 | 848 | −3.1212 | 0.00091 | |
| Occipital | V1 | −24 | −37 | 19 | 320 | 2.7227 | 0.00326 | |
| Occipital | V2 | −25 | −29 | 13 | 488 | −2.6357 | 0.00422 | |
| Putamen | - | −6 | 5 | 10 | 296 | −2.4559 | 0.00706 | |
| Caudate | - | −3 | 10 | 5 | 912 | 3.7297 | 0.0001 | |
|
| ||||||||
| Contralateral | Dorsal Precentral | 4 | 11 | −13 | 25 | 848 | −3.0493 | 0.00115 |
| Dorsolateral Prefrontal | 8Bd | 12 | 24 | 17 | 776 | 3.0104 | 0.00131 | |
| Prearcuate | 45 | 18 | 8 | 6 | 592 | −2.7076 | 0.00341 | |
| Orbitofrontal | 11L/12m | 13 | 16 | 11 | 496 | 2.3811 | 0.00868 | |
| Orbitofrontal | 47/12 | 14 | 23 | 6 | 176 | 2.5429 | 0.00553 | |
| Anterior Cingulate | 24a | 6 | 18 | 7 | 480 | −2.6897 | 0.0036 | |
| Anterior Cingulate | 24c | 6 | 6 | 18 | 720 | −3.4808 | 0.00025 | |
| Postcentral | 3a/b | 13 | −8 | 18 | 432 | 2.6328 | 0.00426 | |
| Superior Parietal Lobule | 5 | 6 | −22 | 31 | 1000 | −3.4988 | 0.00023 | |
| Occipital | V1 | 3 | −43 | 19 | 896 | 2.5969 | 0.00473 | |
| Occipital | V2 | 9 | −28 | 4 | 968 | 3.2981 | 0.00049 | |
| Superior Temporal | FST | 16 | −15 | 9 | 992 | 3.46 | 0.00027 | |
| Putamen | - | 10 | 8 | 3 | 688 | 2.8666 | 0.00209 | |
| Thalamus | - | 6 | −17 | 11 | 872 | −3.4988 | 0.00023 | |
Labels correspond to the homologous areas listed in the rhesus (Saleem & Logothetis 2007)
Coordinates are relative to the anterior commissure (0 mm, 0 mm, 0 mm)
Targeted primary motor cortex
We observed ipsilateral activations of the anterior cingulate and the lateral orbitofrontal cortex (OFC), whereas CBF in the contralateral lateral OFC decreased. Additionally, we found bilateral activations of the posterior cingulate and the medial OFC, demonstrating connections between the two areas. We have summarized these results in Table 2.
DISCUSSION
Structural and fMRI image-guidance was used to deliver TMS to the each baboon’s M1hand region. H215O PET measurements of cerebral blood flow were used to record both local and remote responses. In 4/5 animals, image-guidance accurately targeted M1hand, producing readily apparent contractions of the FDI; one animal did not exhibit functional responses to either vibrotactile or TMS-induced activity in the M1hand region. In the four animals with PET responses, all TMS-induced brain activations occurred along the sulcal bank of the precentral gyrus—which is consistent with the C3 aiming theory. In addition, these four subjects demonstrated remote connectivity, which was highly consistent with descriptions of M1 connectivity derived from invasive and postmortem methods.
Targeting Efficacy
Image-guided aiming of rTMS delivery was highly successful, achieving S1 brain activations in 4/5 baboons. The S1hand maps were used to locate and target the M1 hand region for image-guided TMS delivery; these M1hand locations demonstrate very good correspondence with previous work delineating the baboon’s motor cortex (Brown & Sherrington 1911). TMS-induced M1 brain activations were observed in 4/5 baboons—confirmed both by muscular contraction and local CBF responses at M1. The one non-responder—animal “M4”—did exhibit FDI muscle contractions, prior to PET image acquisition, but did not demonstrate any local CBF responses at M1; this phenomenon has also been reported in human TMS studies (Fox et al., 2004). The simplest explanation for this non-response is that this animal’s 5Hz rTMS and sham conditions did not provide enough statistical power for a significant CBF response at M1 (each condition was only run once). However, because 4/5 of the baboons demonstrated local CBF responses at M1 we believe that our baboon rTMS model is robust and can be effective at producing a CBF response (even with a low number of scans).
TMS aiming/delivery is most versatile when applied using an image-guided, robotically positioned system (Lancaster et al., 2004). Image guidance allows practitioners optimum flexibility in target regions, whereas robotically positioned TMS delivery allows users precision and consistency. In this study, we implemented an image-guided approach, however we could not utilize robotically delivered TMS due to field-of-use constraints on our laboratories irTMS system. Once these limitations are over come, we will implement a fully robotic image-guided TMS delivery system for future baboon TMS studies.
Local CBF Responses
The sulcal location of the M1 response is supportive of the C3 model. However, in this implementation, orientation was manually adjusted to optimize the EMG response. While the B-snout orientation was approximately normal to the central sulcus, this will need explicit testing in future studies. The response magnitudes observed both locally and remotely at 5 Hz (120%RMT) were quite robust, indicating that this preparation has ample statistical power to systematically explore a wide range of stimulation parameters, including rate, intensity and pulse pattern. Ongoing studies (Salinas et al., 2010a; Salinas et al., 2011) are investigating the influence of these parameters on TMS-induced CBF and motor responses.
Remote CBF Responses
The connectivity patterns observed were highly consistent with those reported from a range of invasive methods. In old-world non-human primates (ex. Macaca mulatta), the connections of M1 have been studied thoroughly, showing anatomical connections with premotor, SMA, and the cingulate cortices (Geyer et al., 2000; Dum & Strick, 2002; Dum & Strick, 2005). Additionally, several human imaging studies found strong functional connections between M1 and the premotor areas, parietal cortices, thalamus, and striatum (Guye et al., 2003; Laird et al., 2008). A decrease in brain activity at the homologous contralateral M1 site demonstrates the transcallosal inhibitory effects of TMS (Wassermann et al., 1991; Fox et al., 1997; Bestmann et al., 2003).
Connectivity between the SMA, cingulate motor area, premotor cortices and M1 has been well documented in primate studies (Matelli et al., 1984; Tanji, 1994; Paus, 2001; Rizzolatti & Lupino, 2001; Nachev et al., 2008). Decreases in CBF to these connected motor regions may be due to cortico-cortical inhibition (Kujirai et al., 1993; Chen et al., 1998; Tokuno & Nambu 2000; Terao & Ugawa 2002). Other activations in the subcortical areas (thalamus and striatum) are consistent with previous TMS imaging studies (Laird et al., 2008), whereas activations in the striate and extra-striate cortices are consistent with the primate’s anatomical connections with the parietal and frontal areas (Yeterian & Pandya, 2010).
Many previous studies have found anatomical connections between the motor and cingulate motor area in the macaque monkey (Pandya et al., 1981; Fink et al., 1997; Cavada et al., 2000; Margulies et al., 2009). These studies found that the cingulate cortex had numerous connections to: the lateral OFC, medial OFC, dorsolateral prefrontal cortex, the insular cortex, and area 7 of the parietal lobe. The lateral OFC has many anatomical connections to the anterior cingulate (Pandya et al., 1981), whereas the medial OFC connects to the posterior cingulate cortex (Cavada et al., 2000; Margulies et al., 2009).
Advantages of the Baboon Model
We have demonstrated—in an anesthetized animal—that suprathreshold rTMS to M1 affects both local and remote brain regions with established M1 connectivity. This phenomenon has been well documented in human TMS neuroimaging studies (Fox et al., 1997; Bestmann et al., 2003; Speer et al., 2003; Laird et al., 2008; Siebner et al., 2009). Remote, connected regions are altered by changes in synaptic transmissions—due to induced excitability changes at the site of stimulation. However, different TMS parameters—such as intensity, frequency, etc.—may produce different effects on connected areas. For example, Fox et al., 1997 found that suprathreshold TMS, at a frequency of 1 Hz resulted in increases in CBF in the ipsilateral M1 and decreases in the contralateral M1. Whereas Paus et al., 1997, on the other hand, observed that suprathreshold TMS, at a frequency of 10 Hz resulted in decreases in CBF in the ipsilateral M1 and increases in the contralateral M1. Although many methodological differences existed between the two studies, their conflicting results merit further investigation into the importance of each TMS parameter and its potential impact on brain connectivity studies. We believe that a baboon TMS model would be a suitable vehicle in which to determine these TMS parameters, which may influence the response—activation or deactivation—at the site of stimulation (as well as in connected regions). Such studies in humans would be inordinately costly and would require multiple sessions—which would deliver unacceptable exposure of radiation to its participants. A baboon TMS/PET model would be more suitable for chronic TMS studies because of this radiation burden. In addition, a wider range of experimental rTMS parameters (frequency, intensity, train duration, etc.) may be explored in a baboon TMS/PET model than in human studies.
Another advantage of the baboon TMS model is the ability to use a muscle relaxant (vecuronium) while investigating TMS-induced brain activations. In humans, upon stimulating M1 (especially at suprathreshold TMS intensities), cortico-cortical fibers between M1 and S1 and/or afferent feedback would facilitate the corresponding brain activity in S1. In the baboon, the use of a muscle relaxant—to diminish motion during the H215O PET imaging session—eliminated any afferent feedback to the S1hand area due to TMS-induced muscle contractions. Therefore, in this baboon rTMS implementation, any S1 brain activity can be attributed to 1) cortico-cortical contributions from M1 during 5Hz rTMS or 2) direct stimulation of the S1 by the TMS coil. Although it is possible that the TMS coil’s suprathreshold (i.e. larger) E-field may have encompassed the S1hand area, because the S1 response represents a decrease in CBF (whereas the M1 activity is excitatory) we do not believe that this is the case. A more likely scenario is that the S1 brain activity represents cortico-cortical connections between M1 and S1; this in itself is another advantage of the baboon TMS model since we can safely and repeatedly explore the (noninvasive) use of a muscle relaxant as a temporary/reversible method of deafferentiation.
Afferent feedback may also contribute to the state-dependence of M1 during rTMS protocols, possibly confounding the results. To counteract this phenomena, previous studies employed subthreshold rTMS intensities (Siebner et al., 2001; Bestmann et al., 2003). Although the use of subthreshold intensities does decrease afferent feedback (i.e. possible state-dependent effects), it cannot reliably activate brain areas distant from the site of stimulation. Using a muscle relaxant, we can apply suprathreshold rTMS intensities—activating both local and remote sites—without introducing any afferent feedback effects.
Additional benefits of a baboon TMS model arise when assessing TMS targeting and E-field modeling, specifically in modeling the TMS coil orientation preferences in eliciting neuronal activations (Brasil-Neto et al., 1992; Mills et al., 1992). For example, when stimulating the M1hand area we can measure/quantify the amount of muscle activity produced by each TMS pulse using electromyographic (EMG) techniques, continually adjusting the TMS coil’s position and orientation to maximize the desired EMG response (ex. motor evoked potentials). However, if we wanted to stimulate a cognitive area such as dorsolateral prefrontal cortex, how would we know—a priori—which TMS coil orientations (and possibly positions) would be successful at eliciting the desired cognitive effect? Also, without a tested aiming model how could we be sure that each participant’s target location received the same TMS dose as others in the study, or had the same TMS dose delivered to them throughout the study? The baboon’s flat (almost planar) sulcal walls provide an excellent (in vivo) geometric scenario to test and/or modify the fundamental theories of how TMS coil orientation may affect brain activity. Once simple mathematical constructs have been developed, they may then be refined to account for more complex (i.e. human) brain geometries; theoretically, an aiming model (based on the local cortical geometry) which is validated in the motor cortex would also be appropriate in non-motor cortical areas of the brain—since all of the cortex has the same general columnar structure. Thus, by testing/refining current TMS aiming theories in the baboon’s simplified cortical landscape, we may (eventually) be able to accurately—and quantitatively—apply TMS to cortical areas in which responses cannot be easily measured.
The baboon model may also be used to investigate therapeutic (or psychiatric) TMS protocols. For example, we can investigate the influence of specific rTMS parameters—rate, intensity, inter-train intervals, etc.—using acute TMS studies. Once the optimum TMS parameters have been found for a targeted brain area, we can apply these TMS parameters in a chronic TMS study—where the effects of chronic TMS may be assessed by imaging and/or behavioral measures. Therefore, by successfully targeting a brain area we may optimize TMS delivery to that site—without assuming that each brain area has similar excitatory (i.e. high-frequency) or inhibitory (i.e. low-frequency) TMS parameters. In this study, we used vibrotactile stimuli to target the somatosensory area. Similar approaches may be used target visual and auditory cortices—using either photic or phonic stimuli. However, targeting prefrontal brain areas—in an anesthetized baboon—may not be as obvious. Although an anesthetized baboon model may not be used to perform a task (e.g. working memory), to identify higher-order, non-primary brain areas there are several feasible strategies which can be proposed. In the present study we demonstrated activity in the dorsolateral prefrontal and orbitofrontal cortices during stimulation of M1. Therefore, sequential TMS/PET studies may be performed to identify and target higher-order, non-primary areas. A second, conceptually similar approach would utilize region-seeded and/or independent component analyses of resting-state fMRI data, i.e. resting-state networks (RSNs); RSNs can be readily identified in anesthetized non-human primates. Human and NHP RSNs appear quite similar (Vincent et al., 2007) suggesting that functional locations (cytoarchitectonic regions) can be targeted by their RSN connectivity patterns. A third approach would be to use diffusion-tensor imaging tractography (DTI) to identify higher-order regions based on their connectivity patterns. A fourth approach would be to use established sulcal/cytoarchitecture associations to target higher-order areas. Any one (or combination) of these approaches may be successful strategies for investigating the efficacy of therapeutic TMS protocols in the prefrontal cortex—using image-guided TMS delivery.
Clinical Applications of a Baboon TMS model
Ohnishi et al., 2004 and Hayashi et al., 2004 demonstrated the effectiveness of using a NHP model of TMS (in macaques) to perform long-term, functional imaging studies. However, due to its smaller brain size, macaques require special animal TMS coils for focal brain stimulation (Nonaka et al., 2003). The baboon’s (relatively) large brain size allows use of standard human TMS coils in which the induced E-fields have been thoroughly investigated and modeled by many research groups (Thielscher & Kammer 2004; Salinas et al., 2007; Salinas et al., 2009). Larger brain volumes also facilitate high spatial resolution functional imaging—i.e. fMRI and PET—thereby increasing the baboon’s potential as a possible model for basic TMS research and the therapeutic effects of rTMS.
Recently, interest in rTMS as an adjuvant therapeutic tool has increased. Ameli et al., 2009 and Nowak et al., 2009 demonstrated the effectiveness of using rTMS to aid in rehabilitation after a stroke. These studies found that applying rTMS after the onset of stroke temporarily increased the use of the affected hand, implying that repeated treatments of rTMS may aid in the rehabilitation of motor function after an ischemic event. However, due to differences in lesion uniformity, spread and onset between stroke patients, researchers may not readily quantify the rTMS’ effectiveness as a therapeutic tool. A baboon model of TMS, because of its large brain size, may provide a viable alternative to investigate the effectiveness of rTMS in stroke rehabilitation.
Several researchers have investigated the therapeutic effects of rTMS in epilepsy in humans (see Tassinari et al., 2003 for a review). Since low-frequency rTMS (≤ 1 Hz) was reported to decrease motor excitability (Chen et al., 1997; Terao & Ugawa 2002), researchers have applied low-frequency rTMS to patients with epilepsy but have had mixed results regarding its efficacy in suppressing cortical excitability. Large controlled studies should be performed in order to determine whether low-frequency rTMS actually represents an effective treatment for epilepsy. Since the baboon is an excellent natural model of epilepsy (Szabó et al., 2005), implementation of a baboon rTMS epilepsy model may also realized—possibly providing a vehicle for long term rTMS investigations in epilepsy.
While suprathreshold TMS can educe brain activity in both local and remote (i.e. connected) brain regions, the baboon TMS model may also be used to investigate any connectivity differences which may exist in neurological diseases and disorders (ex. stroke and epilepsy). For example, by comparing functional imaging maps (during various TMS protocols) of both epileptic and normal baboons we may determine which regions are functionally connected to our site of stimulation, then explore how these regional connections may vary between groups using statistical techniques such as structural equation modeling (Laird et al., 2008). Ongoing studies using TMS and intermittent light stimulation (ILS) have shown promise when assessing connectivity differences between epileptic and non-epileptic baboons (Salinas et al., 2010a, Salinas et al., 2010b, Salinas et al., 2010c,). Thus, a baboon TMS model may elaborate not only on which regions may be functionally incongruent in specific neurological disorders, but also may aid in the determination of how these regions interact within the network (via path analysis).
Limitations of the Baboon Model
Although we have successfully implemented a baboon TMS/neuroimaging protocol, there are some limitations to our study. The use of i.v. ketamine anesthesia may influence the magnitude and distribution of cortical and subcortical CBF changes (Szabó et al. 2008). Långsjö et al., 2003 found that ketamine induces a global, concentration-dependent increase in CBF with the largest increases in the anterior cingulate, thalamus, putamen, and frontal cortex. At anesthetic ketamine dosage levels (100 mg/kg), Cavazzuti et al. 1987 reported increases in CBF. However, at lower ketamine doses (i.e. 5mg/kg) Ákeson et al., 1993 reported decreases in CBF. Therefore, we believe that the CBF differences between 5Hz rTMS vs. sham reported here are valid and not due to anesthesia effects for the following reasons: 1) the levels of ketamine were maintained throughout each H215O PET session (5–6 mg/kg/hr) and 2) our brain activity maps correspond to known anatomic and functionally connected regions.
Future Directions
Development of a baboon model of TMS will greatly facilitate the capacity of investigation into the basic mechanisms underlying TMS-induced brain activations. Important TMS parameters—such as the effects of intensity, frequency, intertrain interval, duration, etc.—will be studied using the baboon TMS model; future studies will utilize image-guidance (allowing optimal flexibility in picking regions) and robotic positioning (allowing precision and reproducibility) for TMS delivery. The safety of rTMS may also be (re)explored in the baboon—especially at high frequencies and suprathreshold TMS intensities. We plan to investigate the effect of each of these parameters not only on the targeted site of stimulation but also on any connected regions (via functional imaging). We also hope to extend this work to explore the possible functional connectivity differences between normal baboons and those with neurological disorders (i.e. epilepsy). Eventually, we hope to use this information to test and possibly refine some of the current theories regarding the mechanisms of action in TMS.
CONCLUSIONS
We demonstrated the feasibility of performing high frequency, suprathreshold rTMS in a baboon model during concurrent H215O PET. To the best of our knowledge, this is the first study successfully performing rTMS in a large NHP (baboon) model during concurrent H215O PET imaging. The baboon’s large head size, simple cortical gyrification patterns, and availability for repeated studies support its use for investigation of the mechanisms and important parameters underlying TMS-induced brain activations.
Supplementary Material
Acknowledgments
F.S. Salinas is supported by a Ruth L. Kirschstein National Research Service Award from the National Institute of Neurological Disorders and Stroke (NIH/NINDS F32 NS066694); T.Q. Duong is supported in part by the American Heart Association Established Investigator Award 0940104N, NIH/NINDS R01 NS45879 and the Clinical Translational Science Award’s imaging supplement (parent grant UL1RR025767). Additional funding for this research came from the National Institute of Neurological Disorders and Stroke (NIH/NINDS R21 NS062254, P.T. Fox; NIH/NINDS R21 NS065431, C.Á. Szabó).
Footnotes
Publisher's Disclaimer: This is a PDF file of an unedited manuscript that has been accepted for publication. As a service to our customers we are providing this early version of the manuscript. The manuscript will undergo copyediting, typesetting, and review of the resulting proof before it is published in its final citable form. Please note that during the production process errors may be discovered which could affect the content, and all legal disclaimers that apply to the journal pertain.
References
- Ákeson J, Björkman S, Messeter K, Rosen I, Helfer M. Cerebral pharmacodynamics of anaesthetic and subanaesthetic doses of ketamine in the normoventilated pig. Acta anaesthesiologica Scandinavica. 1993;37:211–218. doi: 10.1111/j.1399-6576.1993.tb03703.x. [DOI] [PubMed] [Google Scholar]
- Amassian VE, Eberle L, Maccabee PJ, Cracco RQ. Modeling magnetic coil excitation of human cerebral cortex with a peripheral nerve immersed in a brain-shaped volume conductor: the significance of fiber bending in excitation. Electroencephalography and clinical neurophysiology. 1992;85:291–301. doi: 10.1016/0168-5597(92)90105-k. [DOI] [PubMed] [Google Scholar]
- Ameli M, Grefkes C, Kemper F, Riegg FP, Rehme AK, Karbe H, Fink GR, Nowak DA. Differential effects of high-frequency repetitive transcranial magnetic stimulation over ipsilesional primary motor cortex in cortical and subcortical middle cerebral artery stroke. Annals of neurology. 2009;66:298–309. doi: 10.1002/ana.21725. [DOI] [PubMed] [Google Scholar]
- Bestmann S, Baudewig J, Siebner HR, Rothwell JC, Frahm J. Subthreshold high-frequency TMS of human primary motor cortex modulates interconnected frontal motor areas as detected by interleaved fMRI-TMS. NeuroImage. 2003;20:1685–1696. doi: 10.1016/j.neuroimage.2003.07.028. [DOI] [PubMed] [Google Scholar]
- Black KJ, Snyder AZ, Koller JM, Gado MH, Perlmutter JS. Template images for nonhuman primate neuroimaging: 1. Baboon NeuroImage. 2001a;14:736–743. doi: 10.1006/nimg.2001.0752. [DOI] [PubMed] [Google Scholar]
- Black KJ, Koller JM, Snyder AZ, Perlmutter JS. Template images for nonhuman primate neuroimaging: 2. Macaque NeuroImage. 2001b;14:744–748. doi: 10.1006/nimg.2001.0871. [DOI] [PubMed] [Google Scholar]
- Brasil-Neto JP, Cohen LG, Panizza M, Nilsson J, Roth BJ, Hallett M. Optimal focal transcranial magnetic activation of the human motor cortex: effects of coil orientation, shape of the induced current pulse, and stimulus intensity. Journal of clinical neurophysiology. 1992;9:132–136. [PubMed] [Google Scholar]
- Brown TG, Sherrington CS. Observations on the localisation in the motor cortex of the baboon (“Papio anubis”) Journal of physiology. 1911;43:209–218. doi: 10.1113/jphysiol.1911.sp001467. [DOI] [PMC free article] [PubMed] [Google Scholar]
- Cavada C, Compañy T, Tejedor J, Cruz-Rizzolo RJ, Reinoso-Suárez F. The anatomical connections of the macaque monkey orbitofrontal cortex. A review. Cerebral cortex. 2000;10:220–242. doi: 10.1093/cercor/10.3.220. [DOI] [PubMed] [Google Scholar]
- Cavazzuti M, Porro CA, Biral GP, Benassi C, Barbieri GC. Ketamine effects on local cerebral blood flow and metabolism in the rat. Journal of cerebral blood flow and metabolism. 1987;7:806–811. doi: 10.1038/jcbfm.1987.138. [DOI] [PubMed] [Google Scholar]
- Chen R, Gerloff C, Classen J, Wassermann EM, Hallett M, Cohen LG. Safety of different inter-train intervals for repetitive transcranial magnetic stimulation and recommendations for safe ranges of stimulation parameters. Electroencephalography and clinical neurophysiology. 1997;105:415–421. doi: 10.1016/s0924-980x(97)00036-2. [DOI] [PubMed] [Google Scholar]
- Chen R, Tam A, Butefisch C, Corwell B, Ziemann U, Rothwell JC, Cohen LG. Intracortical inhibition and facilitation in different representations of the human motor cortex. J Neurophysiol. 1998;80:2870–2881. doi: 10.1152/jn.1998.80.6.2870. [DOI] [PubMed] [Google Scholar]
- Day BL, Dressler D, Maertens de Noordhout A, Marsden CD, Nakashima K, Rothwell JC, Thompson PD. Electric and magnetic stimulation of human motor cortex: surface EMG and single motor unit responses. J Physiol. 1989;412:449–473. doi: 10.1113/jphysiol.1989.sp017626. [DOI] [PMC free article] [PubMed] [Google Scholar]
- Dum RP, Strick PL. Motor areas in the frontal lobe of the primate. Physiology & behavior. 2002;77:677–682. doi: 10.1016/s0031-9384(02)00929-0. [DOI] [PubMed] [Google Scholar]
- Dum RP, Strick PL. Frontal lobe inputs to the digit representations of the motor areas on the lateral surface of the hemisphere. The Journal of neuroscience. 2005;25:1375–1386. doi: 10.1523/JNEUROSCI.3902-04.2005. [DOI] [PMC free article] [PubMed] [Google Scholar]
- Fink GR. Multiple nonprimary motor areas in the human cortex. Journal of neurophysiology. 1997;77:2164–2174. doi: 10.1152/jn.1997.77.4.2164. [DOI] [PubMed] [Google Scholar]
- Fox P, Ingham R, George MS, Mayberg H, Ingham J, Roby J, Martin C, Jerabek P. Imaging human intra-cerebral connectivity by PET during TMS. Neuroreport. 1997;8:2787–2791. doi: 10.1097/00001756-199708180-00027. [DOI] [PubMed] [Google Scholar]
- Fox PT, Narayana S, Tandon N, Sandoval H, Fox SP, Kochunov P, Lancaster JL. Column-based model of electric field excitation of cerebral cortex. Hum Brain Mapp. 2004;22:1–14. doi: 10.1002/hbm.20006. [DOI] [PMC free article] [PubMed] [Google Scholar]
- Fox PT, Narayana S, Tandon N, Fox SP, Sandoval H, Kochunov P, Capaday C, Lancaster JL. Intensity modulation of TMS-induced cortical excitation: primary motor cortex. Hum Brain Mapp. 2006;27:478–487. doi: 10.1002/hbm.20192. [DOI] [PMC free article] [PubMed] [Google Scholar]
- Fukuda S, del Zoppo GJ. Models of focal cerebral ischemia in the nonhuman primate. ILAR journal. 2003;44:96–104. doi: 10.1093/ilar.44.2.96. [DOI] [PubMed] [Google Scholar]
- Geyer S, Matelli M, Luppino G, Zilles K. Functional neuroanatomy of the primate isocortical motor system. Anatomy and embryology. 2000;202:443–474. doi: 10.1007/s004290000127. [DOI] [PubMed] [Google Scholar]
- Guye M, Parker GJM, Symms M, Boulby P, Wheeler-Kingshott CAM, Salek-Haddadi A, Barker GJ, Duncan JS. Combined functional MRI and tractography to demonstrate the connectivity of the human primary motor cortex in vivo. NeuroImage. 2003;19:1349–1360. doi: 10.1016/s1053-8119(03)00165-4. [DOI] [PubMed] [Google Scholar]
- Hayashi T, Ohnishi T, Okabe S, Teramoto N, Nonaka Y, Watabe H, Imabayashi E, Ohta Y, Jino H, Ejima N, Sawada T, Iida H, Matsuda H, Ugawa Y. Long-term effect of motor cortical repetitive transcranial magnetic stimulation [correction] Annals of neurology. 2004;56:77–85. doi: 10.1002/ana.20151. [DOI] [PubMed] [Google Scholar]
- Jenkinson M, Bannister P, Brady M, Smith S. Improved optimization for the robust and accurate linear registration and motion correction of brain images. NeuroImage. 2002;17:825–841. doi: 10.1016/s1053-8119(02)91132-8. [DOI] [PubMed] [Google Scholar]
- Kochunov P, Lancaster J, Thompson P, Toga AW, Brewer P, Hardies J, Fox P. An optimized individual target brain in the Talairach coordinate system. NeuroImage. 2002;17:922–927. [PubMed] [Google Scholar]
- Kujirai T, Caramia MD, Rothwell JC, Day BL, Thompson PD, Ferbert A, Wroe S, Asselman P, Marsden CD. Corticocortical inhibition in human motor cortex. J Physiol. 1993;471:501–519. doi: 10.1113/jphysiol.1993.sp019912. [DOI] [PMC free article] [PubMed] [Google Scholar]
- Laird AR, Robbins JM, Li K, Price LR, Cykowski MD, Narayana S, Laird RW, Franklin C, Fox PT. Modeling motor connectivity using TMS/PET and structural equation modeling. NeuroImage. 2008;41:424–436. doi: 10.1016/j.neuroimage.2008.01.065. [DOI] [PMC free article] [PubMed] [Google Scholar]
- Lancaster JL, Fox PT, Downs H, Nickerson DS, Hander TA, El Mallah M, Kochunov PV, Zamarripa F. Global spatial normalization of human brain using convex hulls. J Nucl Med. 1999;40:942–955. [PubMed] [Google Scholar]
- Lancaster JL, Narayana S, Wenzel D, Luckemeyer J, Roby J, Fox P. Evaluation of an image-guided, robotically positioned transcranial magnetic stimulation system. Human brain mapping. 2004;22:329–340. doi: 10.1002/hbm.20041. [DOI] [PMC free article] [PubMed] [Google Scholar]
- Långsjö JK, Kaisti KK, Aalto S, Hinkka S, Aantaa R, Oikonen V, Sipilä H, Kurki T, Silvanto M, Scheinin H. Effects of subanesthetic doses of ketamine on regional cerebral blood flow, oxygen consumption, and blood volume in humans. Anesthesiology. 2003;99:614–623. doi: 10.1097/00000542-200309000-00016. [DOI] [PubMed] [Google Scholar]
- Margulies DS, Vincent JL, Kelly C, Lohmann G, Uddin LQ, Biswal BB, Villringer A, Castellanos FX, Milham MP, Petrides M. Precuneus shares intrinsic functional architecture in humans and monkeys. Proceedings of the National Academy of Sciences of the United States of America. 2009;106:20069–20074. doi: 10.1073/pnas.0905314106. [DOI] [PMC free article] [PubMed] [Google Scholar]
- Matelli M, Carmada R, Glickstein M, Rizzolatti G. Interconnections within the postarcuate cortex (area 6) of the macaque monkey. Brain research. 1984;310:388–392. doi: 10.1016/0006-8993(84)90167-7. [DOI] [PubMed] [Google Scholar]
- Mills KR, Boniface SJ, Schubert M. Magnetic brain stimulation with a double coil: the importance of coil orientation. Electroencephalography and clinical neurophysiology. 1992;85:17–21. doi: 10.1016/0168-5597(92)90096-t. [DOI] [PubMed] [Google Scholar]
- Nachev P, Kennard C, Husain M. Functional role of the supplementary and pre-supplementary motor areas. Nature reviews. Neuroscience. 2008;9:856–869. doi: 10.1038/nrn2478. [DOI] [PubMed] [Google Scholar]
- Nagarajan SS, Durand DM, Warman EN. Effects of induced electric fields on finite neuronal structures: a simulation study. IEEE transactions on bio-medical engineering. 1993;40:1175–1188. doi: 10.1109/10.245636. [DOI] [PubMed] [Google Scholar]
- Nonaka Y, Hayashi T, Ohnishi T, Okabe S, Teramoto N, Ueno S, Watabe H, Matsuda H, Iida H, Ugawa Y. A coil for magnetic stimulation of the macaque monkey brain. Supplements to Clinical neurophysiology. 2003;56:75–80. doi: 10.1016/s1567-424x(09)70211-9. [DOI] [PubMed] [Google Scholar]
- Nowak DA, Grefkes C, Ameli M, Fink G. Interhemispheric competition after stroke: brain stimulation to enhance recovery of function of the affected hand. Neurorehabilitation and neural repair. 2009;23:641–656. doi: 10.1177/1545968309336661. [DOI] [PubMed] [Google Scholar]
- Ohnishi T, Hayashi T, Okabe S, Nonaka I, Matsuda H, Iida H, Imabayashi E, Watabe H, Miyake Y, Ogawa M, Teramoto N, Ohta Y, Ejima N, Sawada T, Ugawa Y. Endogenous dopamine release induced by repetitive transcranial magnetic stimulation over the primary motor cortex: an [11C]raclopride positron emission tomography study in anesthetized macaque monkeys. Biological psychiatry. 2004;55:484–489. doi: 10.1016/j.biopsych.2003.09.016. [DOI] [PubMed] [Google Scholar]
- Pandya DN, Hoesen GWV, Mesulam MM. Efferent connections of the cingulate gyrus in the rhesus monkey. Experimental brain research. 1981;42:319–330. doi: 10.1007/BF00237497. [DOI] [PubMed] [Google Scholar]
- Paus T, Jech R, Thompson CJ, Comeau R, Peters T, Evans AC. Transcranial magnetic stimulation during positron emission tomography: a new method for studying connectivity of the human cerebral cortex. The Journal of neuroscience. 1997;17:3178–3184. doi: 10.1523/JNEUROSCI.17-09-03178.1997. [DOI] [PMC free article] [PubMed] [Google Scholar]
- Paus T. Primate anterior cingulate cortex: where motor control, drive and cognition interface. Nature reviews. Neuroscience. 2001;2:417–424. doi: 10.1038/35077500. [DOI] [PubMed] [Google Scholar]
- Penfield W, Boldrey E. Somatic motor and sensory representation in the cerebral cortex of man as studied by electrical stimulation. Brain. 1937;60:389–443. [Google Scholar]
- Rizzolatti G, Luppino G. The cortical motor system. Neuron. 2001;31:889–901. doi: 10.1016/s0896-6273(01)00423-8. [DOI] [PubMed] [Google Scholar]
- Roth BJ, Basser PJ. A model of the stimulation of a nerve fiber by electromagnetic induction. IEEE transactions on bio-medical engineering. 1990;37:588–597. doi: 10.1109/10.55662. [DOI] [PubMed] [Google Scholar]
- Roth BJ, Pascual-Leone A, Cohen LG, Hallett M. The heating of metal electrodes during rapid-rate magnetic stimulation: a possible safety hazard. Electroencephalogr Clin Neurophysiol. 1992;85:116–123. doi: 10.1016/0168-5597(92)90077-o. [DOI] [PubMed] [Google Scholar]
- Saleem KS, Logothetis NK. A combined MRI and histology atlas of the rhesus monkey brain in stereotaxic coordinates. Academic Press; London: 2007. [Google Scholar]
- Salinas FS, Lancaster JL, Fox PT. Detailed 3D models of the induced electric field of transcranial magnetic stimulation coils. Phys Med Biol. 2007;52:2879–2892. doi: 10.1088/0031-9155/52/10/016. [DOI] [PubMed] [Google Scholar]
- Salinas FS, Lancaster JL, Fox PT. 3D modeling of the total electric field induced by transcranial magnetic stimulation using the boundary element method. Phys Med Biol. 2009;54:3631–3647. doi: 10.1088/0031-9155/54/12/002. [DOI] [PMC free article] [PubMed] [Google Scholar]
- Salinas FS, Szabó CÁ, Franklin C, Zhang W, Leland MM, Wey H-Y, Duong TQ, Fox PT, Narayana S. Development of a Baboon Model Using Repetitive Transcranial Magnetic Stimulation as Evidenced by Rate Dependent Regional Brain Activations. 16th Annual Meeting of the Organization for Human Brain Mapping; Barcelona, Spain. June 6–10.2010a. [Google Scholar]
- Salinas FS, Knape KD, Franklin C, Narayana S, Leland MM, Wey H-Y, Duong TQ, Fox PT, Szabó CÁ. Rate dependent brain activation using intermittent light stimulation in a baboon model. 16th Annual Meeting of the Organization for Human Brain Mapping; Barcelona, Spain. June 6–10.2010b. [Google Scholar]
- Salinas FS, Narayana S, Knape KD, Leland MM, Szabó CÁ. Rate dependent regional brain activations during intermittent light stimulation in photosensitive and control non-human primates. 64th Annual Meeting of the American Epilepsy Society; San Antonio, Texas. December 4–8.2010c. [Google Scholar]
- Salinas FS, Narayana S, Zhang W, Jones L, Leland MM, Lancaster JL, Fox PT. Baboon Validations of the cortical column cosine aiming model of TMS induced brain activations. 17th Annual Meeting of the Organization for Human Brain Mapping; Quebec City, Canada. June 26–30.2011. [Google Scholar]
- Siebner HR, Takano B, Peinemann A, Schwaiger M, Conrad B, Drzezga A. Continuous transcranial magnetic stimulation during positron emission tomography: a suitable tool for imaging regional excitability of the human cortex. NeuroImage. 2001;14:883–890. doi: 10.1006/nimg.2001.0889. [DOI] [PubMed] [Google Scholar]
- Siebner HR, Bergmann TO, Bestmann S, Massimini M, Johansen-Berg H, Mochizuki H, Bohning DE, Boorman ED, Groppa S, Miniussi C, Pascual-Leone A, Huber R, Taylor PC, Ilmoniemi RJ, De Gennaro L, Strafella AP, Kahkonen S, Kloppel S, Frisoni GB, George MS, Hallett M, Brandt SA, Rushworth MF, Ziemann U, Rothwell JC, Ward N, Cohen LG, Baudewig J, Paus T, Ugawa Y, Rossini PM. Consensus paper: combining transcranial stimulation with neuroimaging. Brain Stimul. 2009;2:58–80. doi: 10.1016/j.brs.2008.11.002. [DOI] [PubMed] [Google Scholar]
- Smith SM, Jenkinson M, Woolrich MW, Beckmann CF, Behrens TEJ, Johansen-Berg H, Bannister PR, Luca MD, Drobnjak I, Flitney DE, Niazy RK, Saunders J, Vickers J, Zhang Y, Stefano ND, Brady JM, Matthews PM. Advances in functional and structural MR image analysis and implementation as FSL. NeuroImage. 2004;23(Suppl 1):S208–219. doi: 10.1016/j.neuroimage.2004.07.051. [DOI] [PubMed] [Google Scholar]
- Speer AM, Willis MW, Herscovitch P, Daube-Witherspoon M, Shelton JR, Benson BE, Post RM, Wassermann EM. Intensity-dependent regional cerebral blood flow during 1-Hz repetitive transcranial magnetic stimulation (rTMS) in healthy volunteers studied with H215O positron emission tomography: I. Effects of primary motor cortex rTMS. Biological psychiatry. 2003;54:818–825. doi: 10.1016/s0006-3223(03)00002-7. [DOI] [PubMed] [Google Scholar]
- Szabó CA, Leland MM, Knape K, Elliott JJ, Haines V, Williams JT. Clinical and EEG phenotypes of epilepsy in the baboon (Papio hamadryas spp) Epilepsy research. 2005;65:71–80. doi: 10.1016/j.eplepsyres.2005.05.003. [DOI] [PubMed] [Google Scholar]
- Szabó CA, Narayana S, Franklin C, Knape KD, Davis MD, Fox PT. “Resting” CBF in the epileptic baboon: correlation with ketamine dose and interictal epileptic discharges. Epilepsy research. 2008;82:57–63. doi: 10.1016/j.eplepsyres.2008.07.015. [DOI] [PMC free article] [PubMed] [Google Scholar]
- Szabó CA, Salinas FS, Narayana S. Functional PET evaluation of the photosensitive baboon. OPEN Neuroscience Journal. 2011;(Special) doi: 10.2174/1874440001105010206. (in press) [DOI] [PMC free article] [PubMed] [Google Scholar]
- Tanji J. The supplementary motor area in the cerebral cortex. Neuroscience research. 1994;19:251–268. doi: 10.1016/0168-0102(94)90038-8. [DOI] [PubMed] [Google Scholar]
- Tassinari CA, Cincotta M, Zaccara G, Michelucci R. Transcranial magnetic stimulation and epilepsy. Clinical neurophysiology. 2003;114:777–798. doi: 10.1016/s1388-2457(03)00004-x. [DOI] [PubMed] [Google Scholar]
- Terao Y, Ugawa Y. Basic mechanisms of TMS. Journal of clinical neurophysiology. 2002;19:322–343. doi: 10.1097/00004691-200208000-00006. [DOI] [PubMed] [Google Scholar]
- Thielscher A, Kammer T. Electric field properties of two commercial figure-8 coils in TMS: calculation of focality and efficiency. Clin Neurophysiol. 2004;115:1697–1708. doi: 10.1016/j.clinph.2004.02.019. [DOI] [PubMed] [Google Scholar]
- Tokuno H, Nambu A. Organization of nonprimary motor cortical inputs on pyramidal and nonpyramidal tract neurons of primary motor cortex: An electrophysiological study in the macaque monkey. Cerebral cortex. 2000;10:58–68. doi: 10.1093/cercor/10.1.58. [DOI] [PubMed] [Google Scholar]
- Vincent JL, Patel GH, Fox MD, Snyder AZ, Baker JT, Van Essen DC, Zempel JM, Snyder LH, Corbetta M, Raichle ME. Intrinsic functional architecture in the anaesthetized monkey brain. Nature. 2007;447:83–86. doi: 10.1038/nature05758. [DOI] [PubMed] [Google Scholar]
- Wassermann EM, Fuhr P, Cohen LG, Hallett M. Effects of transcranial magnetic stimulation on ipsilateral muscles. Neurology. 1991;41:1795–1799. doi: 10.1212/wnl.41.11.1795. [DOI] [PubMed] [Google Scholar]
- Wassermann EM. Risk and safety of repetitive transcranial magnetic stimulation: report and suggested guidelines from the International Workshop on the Safety of Repetitive Transcranial Magnetic Stimulation, June 5–7, 1996. Electroencephalography and clinical neurophysiology. 1998;108:1–16. doi: 10.1016/s0168-5597(97)00096-8. [DOI] [PubMed] [Google Scholar]
- Wey HY, Li J, Szabó CÁ, Fox PT, Leland MM, Jones L, Duong TQ. BOLD fMRI of visual and somatosensory-motor stimulations in baboons. NeuroImage. 2010;52:1420–1427. doi: 10.1016/j.neuroimage.2010.05.014. [DOI] [PMC free article] [PubMed] [Google Scholar]
- Wey HY, Wang DJ, Duong TQ. Baseline CBF, and BOLD, CBF, and CMRO(2) fMRI of visual and vibrotactile stimulations in baboons. Journal of cerebral blood flow and metabolism. 2011;31:715–724. doi: 10.1038/jcbfm.2010.154. [DOI] [PMC free article] [PubMed] [Google Scholar]
- Woolrich MW, Jbabdi S, Patenaude B, Chappell M, Makni S, Behrens T, Beckmann C, Jenkinson M, Smith SM. Bayesian analysis of neuroimaging data in FSL. NeuroImage. 2009;45:S173–186. doi: 10.1016/j.neuroimage.2008.10.055. [DOI] [PubMed] [Google Scholar]
- Wu T, Sommer M, Tergau F, Paulus W. Lasting influence of repetitive transcranial magnetic stimulation on intracortical excitability in human subjects. Neuroscience letters. 2000;287:37–40. doi: 10.1016/s0304-3940(00)01132-0. [DOI] [PubMed] [Google Scholar]
- Yeterian EH, Pandya DN. Fiber pathways and cortical connections of preoccipital areas in rhesus monkeys. The Journal of comparative neurology. 2010;518:3725–3751. doi: 10.1002/cne.22420. [DOI] [PubMed] [Google Scholar]
Associated Data
This section collects any data citations, data availability statements, or supplementary materials included in this article.