Abstract
Purpose: Cerenkov emission is induced when a charged particle moves faster than the speed of light in a given medium. Both x-ray photons and electrons produce optical Cerenkov photons in everyday radiation therapy of tissue; yet, this phenomenon has never been fully documented. This study quantifies the emissions and also demonstrates that the Cerenkov emission can excite a fluorophore, protoporphyrin IX (PpIX), embedded in biological phantoms.Methods: In this study, Cerenkov emission induced by radiation from a clinical linear accelerator is investigated. Biological mimicking phantoms were irradiated with x-ray photons, with energies of 6 or 18 MV, or electrons at energies 6, 9, 12, 15, or 18 MeV. The Cerenkov emission and the induced molecular fluorescence were detected by a camera or a spectrometer equipped with a fiber optic cable.Results: It is shown that both x-ray photons and electrons, at MeV energies, produce optical Cerenkov photons in tissue mimicking media. Furthermore, we demonstrate that the Cerenkov emission can excite a fluorophore, protoporphyrin IX (PpIX), embedded in biological phantoms.Conclusions: The results here indicate that molecular fluorescence monitoring during external beam radiotherapy is possible.
Keywords: external beam radiation therapy, Cerenkov emission, fluorescence spectroscopy, molecular imaging, protoporphyrin IX
INTRODUCTION
The discovery of optical emission induced by relativistic particles was first reported in the early 1930s by Cerenkov.1 Recently, this phenomenon was demonstrated for imaging of preclinical radioactive positron emission tomography (PET) tracers using sensitive optical imaging systems.2 Cerenkov emission intensity increases significantly when MeV energies are used, and so in this study, an investigation of high-energy radiation from a linear accelerator was carried out, to quantify the induced Cerenkov emission in biological media. Both x-ray photons and electrons produce optical Cerenkov photons in radiation therapy of tissue; yet, this phenomenon has never been quantitatively characterized.
Cerenkov emission is induced when a charged particle moves faster than the speed of light in a given medium. This fundamental fact renders a threshold condition for the occurrence of optical emission given by3
| (1) |
where n is the refractive index and β is defined by3
| (2) |
In water, the threshold energy of electrons is 0.264 MeV, while in tissue, assuming a refractive index of 1.4, the threshold energy is 0.219 MeV. Several radioisotopes used within biomedical imaging satisfy the Cerenkov criterion in Eq. 1. This has been demonstrated for PET-agents where the optical emission, induced by the positrons (β+) before annihilation with an electron, was imaged with sensitive optical imaging instrumentation.2 Furthermore, optical imaging enabled through electrons (β-) emitted from several radioisotopes was shown to yield relatively high sensitivity.4 However, pure photon (γ) emitting isotopes showed no Cerenkov emission.4, 5 This is most likely due to the secondary electrons; caused by Compton scattering or photoelectric interaction between the tissue and the γ-particles, that have energies below the Cerenkov threshold. Aside from utilizing the Cerenkov emission as contrast in optical imaging, the energy can be transferred to embedded quantum-dots5 or organic fluorophores.6 The advantage of this approach is that the fluorophore emits light at a longer wavelength, compared to Cerenkov emission, where optical transmission may be more favorable. However, most radionuclides used in the pioneering works referenced above have energies well below 1 MeV. Early theoretical work by Frank and Tamm rendered an equation, predicting the number of photons emitted within a wavelength interval, λ1<λ2, per electron and electron path length, given by7
| (3) |
The Frank–Tamm equation reveals that (1) stronger photon emission can be expected when increasing the energy of the particles and (2) the optical emission is strongest in the UV-blue range. The use of radiation from a linear accelerator, as opposed to radionuclides, enables higher energy electrons, and hence, a stronger Cerenkov emission generation is expected.
The study reported herein demonstrates that the Cerenkov emission is generated in water-based phantoms when irradiated by external electron or photon beams from a linear accelerator. Furthermore, we show that the Cerenkov emission can excite a fluorophore, protoporphyrin IX (PpIX), embedded in biological phantoms. PpIX has shown selective accumulation in tumor tissues of the brain as its red fluorescence is routinely used for guidance of brain tumor resection in certain centers.8 In addition, PpIX has photosensitizing properties that are relied upon in photodynamic therapy.9 In photodynamic therapy, the light dose induces the reaction, and for this reason, the Cerenkov light fluence rate generated is quantified during external beam radiation therapy. The results here indicate that molecular fluorescence monitoring during external beam radiotherapy is possible.
MATERIALS AND METHODS
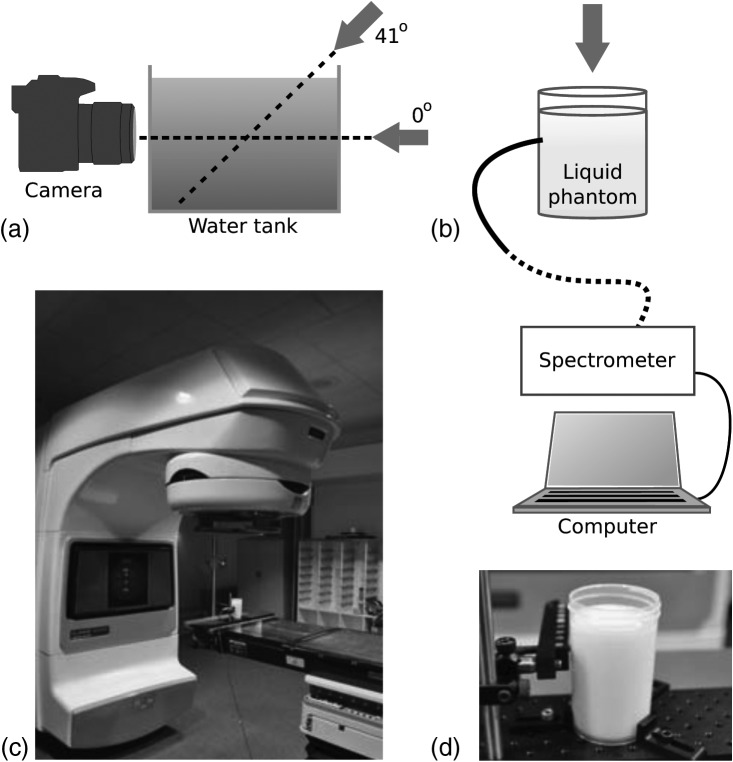
All experiments were performed with a linear accelerator (Varian Linac 2100C, Varian Medical Systems, Palo Alto), see Fig. 1. The beam field sizes and dose rates used are stated in Table TABLE I..
Figure 1.
Schematics of the experimental setups. (a) A water tank and camera where arrows indicate the irradiation direction of the linear accelerator. (b) The cylindrical scattering phantom with the fiber bundle connected to a spectrometer. (c) The linear accelerator with a phantom placed in the target region. (d) A photograph of the cylindrical scattering phantom.
TABLE I.
External beam radiation parameters used in the study. The parameters are taken from tabulated machine characterization data used in the clinical setting.
| Radiation | Field size (cm2) | Dose rate (cGy/min) | Depth of dose max (cm) |
|---|---|---|---|
| γ (6 MV) | 11 × 11 | 404 | 1.6 |
| γ (18 MV) | 11 × 11 | 404 | 3.6 |
| β-(6 MeV) | 6 × 6 | 388 | 1.4 |
| β-(9 MeV) | 6 × 6 | 392 | 2.2 |
| β-(12 MeV) | 6 × 6 | 392 | 2.7 |
| β-(15 MeV) | 6 × 6 | 392 | 3.0 |
| β-(18 MeV) | 6 × 6 | 400 | 2.5 |
The scattering liquid phantom used in the experiments was made of deionized water, 1% v/v Intralipid© (Fresenius Kabi, Uppsala, Sweden) and 5% v/v Tween-20 (Sigma Aldrich, Saint Louis, Missouri) to monomerize the PpIX mixed into the solution. PpIX was prepared in a stock solution with a concentration of 0.1 mg/ml by diluting PpIX powder in dimethyl sulphoxide (DMSO). Images were acquired with a CMOS camera Nikon D90 (Nikon, Tokyo, Japan) equipped with a standard zoom lens Sigma EX 18-50/2.8 Macro HSM (set to 50 mm and f/2.8 at all images) (Sigma Corporation, Kawasaki, Japan). The integration time for all images was 8 s, and all ambient light sources were blocked in the dark room. Images were processed by subtraction of a background image and normalization with the integration time. The images, having a size of 2868 × 4352 pixels, were processed with an average filter of 100 × 100 pixels in matlab 7.10.0 (The MathWorks Inc., Natick, MA). The spectrometer setup was governed by a spectrograph (Acton Insight, Princeton Instruments, Acton) connected to a front illuminated CCD (Pixis 400F, Princeton Instruments, Acton). The CCD was cooled to −70 °C, and the grating used in all experiments was 300 lines/mm. A 13 m long fiber bundle (Zlight, Latvia), composed of seven 400 μm diameter silica fibers, the light at the phantom and guided the photons to the spectrometer. The fiber bundle tip was positioned in contact with the cylindrical surface and 30 mm from the top surface of the liquid. All spectra were acquired with an integration time of 10 s. Each spectrum was subject to background subtraction and integration time normalization. The spectra, having a total of 1340 pixels, were then smoothed, by averaging six neighboring pixels.
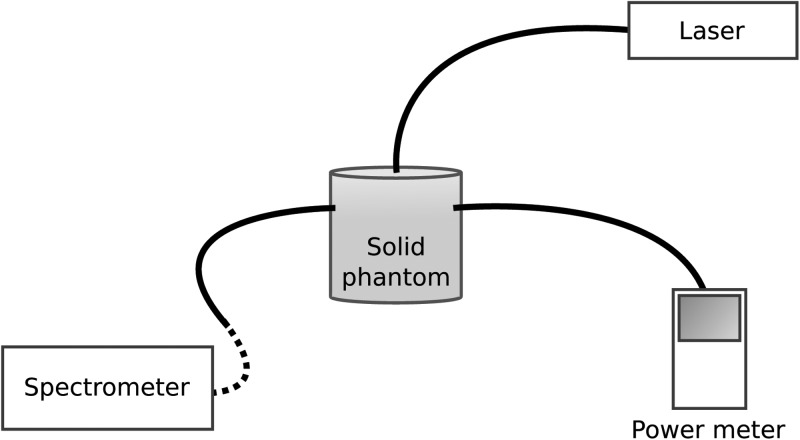
The spectrometer was calibrated by using a cylindrical solid scattering phantom, see Fig. 2. The fiber bundle tip was positioned in contact with the cylindrical surface. The fiber tip of a fiber-coupled laser source, emitting at 643 nm, was positioned at the center of the top cylinder face. In addition, a fiber coupled power meter (Thorlabs PM100, Thorlabs, Newton, NJ) was positioned at the cylindrical surface of the phantom. The power meter and the spectrometer experienced the same radiance due to equal distance to the source. The photons collected by the fiber bundle are defined as the exitance, denoted I (W/cm2). The counts on the spectrometer were related to the exitance through normalization of fiber bundle numerical aperture as well as fiber bundle surface area. Assuming that the photon migration in the medium is diffuse, as the case in tissue, the fluence rate is calculated from a boundary condition to the diffusion equation.10 The fluence rate, denoted Φ(W/cm2), is related to the exitance through I=0.170Φ.
Figure 2.
Experimental setup used for spectrometer calibration.
RESULTS
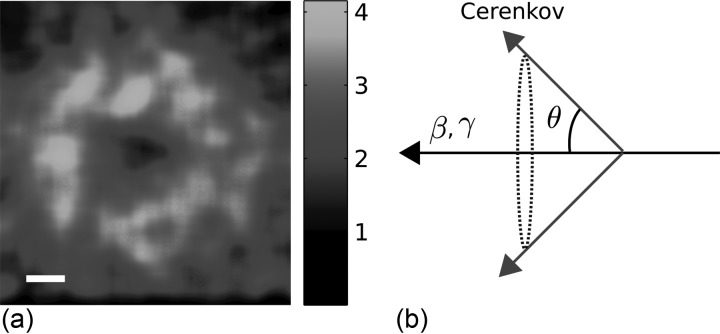
To demonstrate the ability to induce Cerenkov emission using electrons or x-ray photons from a linear accelerator a water tank was placed in the target region of the radiation source, see Fig. 1a. The gantry was rotated to satisfy an incidence angle of 0° relative to the water surface and a camera collected the visible Cerenkov emission. Electrons at 18 MeV and a circular field size of 3 cm in diameter induced a ring shaped Cerenkov pattern, as shown in Fig. 3a. This pattern arises from the coherent nature of the Cerenkov emission.11 Light from different positions along an electron’s path will be subject to interference. In practice, this manifests as light is emitted in an angle satisfying11
| (4) |
The ring shaped pattern is the cross-section of the Cerenkov emission cone, schematically plotted in Fig. 3b. This angular dependence has, historically, been utilized to assess the kinetic velocity of protons.12 The angular dependence has also been reported in a more recent study where Cerenkov emission generated in scintillating dosimeters, used in external beam radiation therapy, was investigated.13
Figure 3.
Cerenkov emission pattern induced by electrons at 18 MeV. (a) The Cerenkov emission pattern as seen from horizontal alignment of the camera and the linear accelerator gantry. The bar represents 1 cm. (b) A schematic picture showing the emission angle relative the particle direction, essentially forming an emission cone.
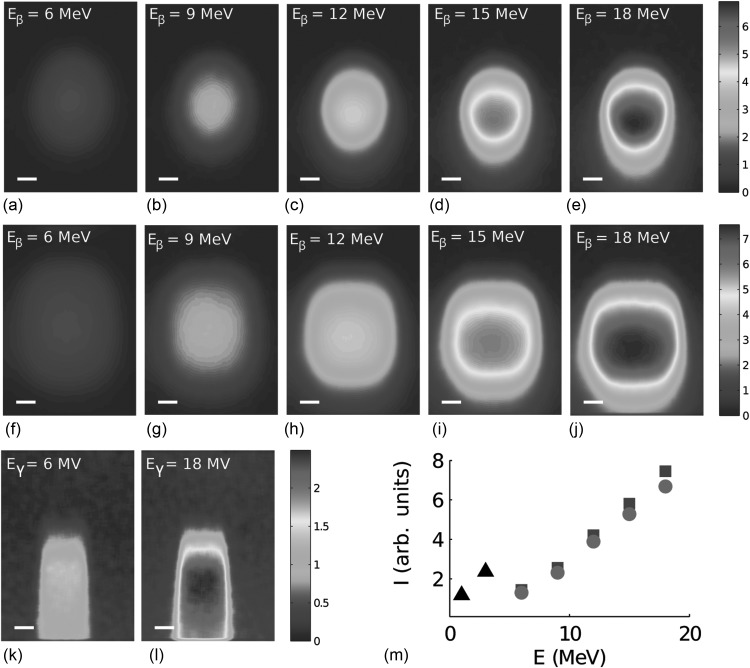
The linear accelerator gantry was rotated to accommodate oblique incidence of the electrons and the x-ray photons, see schematic in Fig. 1a. The radiation beam was incident with an angle of 41° relative to the water surface as this arrangement provides maximum Cerenkov emission in the direction of the camera, according to Eq. 4. The electron energy was sequentially increased, and the Cerenkov emission pattern was imaged using the camera. The emission pattern caused by electrons having a circular field size of 3 cm in diameter is seen in Figs. 4a–4e, for energies 6, 9, 12, 15, and 18 MeV, respectively. The emission pattern caused by electrons having a square field size of 4 × 4 cm2 is seen in Figs. 4f, 4g, 4h, 4i, 4j, for energies 6, 9, 12, 15, and 18 MeV, respectively. As the electron energy is increased, the maximum intensity of the Cerenkov emission is observed to be deeper in the phantom. This is an effect of the electron dose that effectively is deposited at larger depths for higher electron energies.14
Figure 4.
Cerenkov emission induced by electrons and photons with varying energies and field sizes. In (a)–(e) Cerenkov emission due to an electron beam with a circular field size (diameter 3 cm) at 6 MeV, 9 MeV, 12 MeV, 15 MeV, and 18 MeV respectively. In (f)–(j) Cerenkov emission due to an electron beam with a square field size (4 × 4 cm2) at 6 MeV, 9 MeV, 12 MeV, 15 MeV and 18 MeV respectively. In (k)–(l) Cerenkov emission induced by x-ray photons with a square field size (2 × 2 cm2) at 6 MV and 18 MV, respectively. In (m) the average of the intensity within a square region of 1 cm2, centered at the maximum intensity pixel of each image shown as a function of electron energy, (•) electrons with circular field size, (▪) electrons with quadratic field size and (▴) photons with square field size. The photon beam energies, at 6 and 18 MV, are replaced by the average secondary electron energies (originating from Compton or photoelectric interaction), given by 1 and 3 MeV. The bars in (a)–(l) represent 1 cm. All images are acquired in the setup seen in Fig. 1a with the beam incident at an angle of 41°.
The Cerenkov emission pattern from x-ray photons at 6 or 18 MV is shown in Figs. 4k, 4l, respectively, for a field size of 2 × 2 cm2. These images demonstrate that the x-ray photon dose deposition is fundamentally different from that of the electrons. The x-ray photons interact with the water through photoelectric or Compton interaction. In this process, an electron gains the energy, which in turn causes Cerenkov emission, given that its energy satisfies the Cerenkov criterion. The photon energies stated here, i.e., 6 and 18 MV, will cause secondary electrons having a broad energy distribution. The average electron energies, as estimated through Monte Carlo simulations, are approximately 1 and 3 MeV, respectively.15 The intensity within a 1 cm2 area centered at the maximum intensity of each image in Fig. 4 was averaged and plotted as a function of energy in Fig. 4m. The emitted optical intensity increases as the radiation energy is increased. This is expected from the Frank–Tamm formula, Eq. 3, but also from the longer path-length, exhibited by electrons or x-ray photons at higher energies.
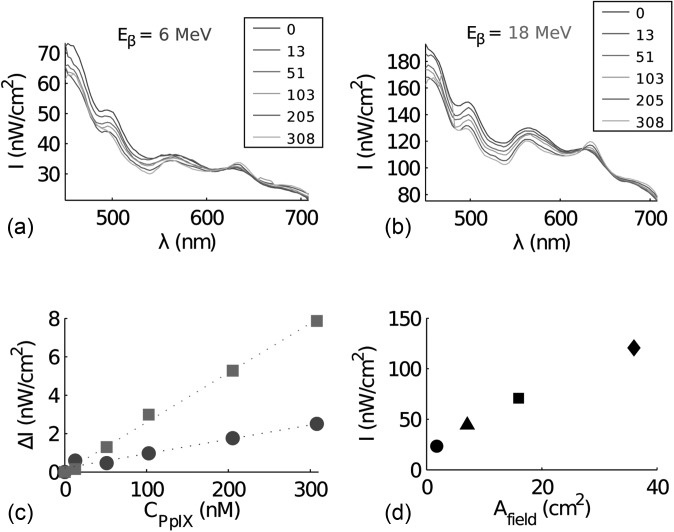
In tissue, the Cerenkov emission will be subject to strong scattering. In order to mimic the optical properties of tissue, a phantom material Intralipid© was mixed into an aqueous phantom in a cylindrical container, see Fig. 1d. To demonstrate the capability of exciting a fluorophore within a scattering medium, using the Cerenkov emission, protoporphyrin IX (PpIX) was mixed into the phantom solution. Measurements were acquired at PpIX concentrations 0, 13, 51, 103, 205, and 308 nM. A long optical fiber bundle was positioned in contact with the cylindrical container, see Fig. 1b, to record the spectrum from the phantom solution upon external beam irradiation. The collected spectra induced by 6 and 18 MeV electrons are shown in Figs. 5a, 5b, respectively. PpIX has a characteristic fluorescence emission peak at 635 nm, which is clearly seen in Figs. 5a, 5b. The incremental intensity at 635 nm, relative to the same measurement recorded without PpIX, is shown in Fig. 5c for both electron beam energies. The steeper line in Fig. 5c arises from the higher excitation power when using a higher energy of the electron beam. The fluorescence intensities at 635 nm extracted for several excitation beam field sizes are plotted in Fig. 5d demonstrating the dependence of fluorescence emission on dose rate.
Figure 5.
Fluorescence spectra induced by an electron beam. The intensity (I) as a function of wavelength (λ) collected from the scattering phantom with increasing levels of protoporphyrin IX, induced by an electron beam at (a) 6 MeV and (b) 18 MeV. The legend specifies the PpIX concentrations in nM. In (c) the incremental intensity (ΔI) at 635 nm is seen as a function of protoporhyrin IX concentration, where (•) is electron energy 6 MeV (R2 = 0.96) and (▪▪) 18 MeV (R2 = 0.99). In d) the intensity at 635 nm is plotted as a function of field size of the electron beam at 18 MeV where (•) circular field with diameter 1.5 cm, (▴) circular field with diameter 3 cm, (▪) square field size of size 4 × 4 cm2and (♦) square field size of size 6 × 6 cm2.
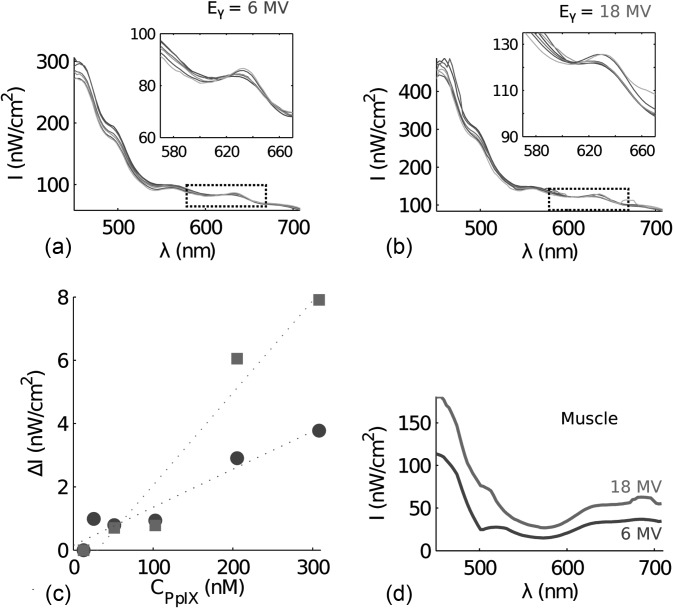
The spectra induced by x-ray photons at 6 and 18 MV are shown in Figs. 6a, 6b respectively. The fluorescence from PpIX is also shown in the insets of Figs. 6a, 6b. The extracted incremental intensity at 635 nm as a function of PpIX concentration is plotted in Fig. 6c, demonstrating a linear relationship similar to that observed with electron beam excitation. To quantify the Cerenkov emission in biological tissue, external beam induced Cerenkov radiation was measured in chicken muscular tissue irradiated by x-ray photons at 6 or 18 MV and a field size of 4 × 4 cm2. The Cerenkov emission collected by the fiber bundle is seen in Fig. 6d. The muscular tissue contains some blood, causing lower transmission of the Cerenkov emission within the spectral region 500–600 nm.
Figure 6.
Fluorescence spectra induced by a photon beam. The intensity (I) as a function of wavelength (λ) collected from the scattering phantom with increasing levels of protoporphyrin IX, induced by a photon beam (a) 6 MV and (b) 18 MV. The PpIX concentrations are specified in the legend of Fig. 5 (a)–(b). In (c) the incremental intensity (ΔI) at 635 nm is seen as a function of protoporhyrin IX concentration, where (•) is photon energy 6 MV (R2 = 0.94) and (▪) 18 MV (R2 = 0.95). In (d) the spectra from chicken muscle tissue is seen where the photon energies are 6 MV and 18 MV.
Using the measured spectra from the muscular tissue, in Fig. 6d, an estimate of the fluence rate, i.e. optical photon density, can be calculated. Based on these calculations the Cerenkov fluence rate at 450 nm, induced by a photon beam with energy 6 MV and dose rate 4 Gy/min, is approximately 0.7 μW/cm2. Increasing the energy to 18 MV increases the Cerenkov fluence rate to approximately 1.1 μW/cm2.
DISCUSSION
The results presented herein show that the Cerenkov emission, generated by radiation from a clinical linear accelerator, reaches detectable levels in aqueous tissue phantoms. Furthermore it was seen that the Cerenkov emission levels increased with higher radiation energy. The reasons are; (1) a slightly higher photon yield at higher radiation energies, (2) a longer path-length in the medium for charged particles at higher energies, allowing Cerenkov generation over a longer distance and (3) a high dose rate of the radiation. Even with these advantages, the light fluence rate is around 1 μW/cm2, when induced by radiation from the linear accelerator. While this fluence rate is relatively low, fluorophores such as PpIX have a Soret band in the blue and several Q-bands throughout the red spectral interval. Such agents benefit from the broad spectrum of Cerenkov radiation and thus are more readily excited compared to NIR-excited fluorophores. Given that the Cerenkov emission contains predominantly blue-shifted light, which has a short penetration depth in tissue, the fluorophore excitation is also more localized to the external beam field.
PpIX is an endogenous compound that presents selective accumulation in cancer cells, following administration of 5-aminolevulinic acid (ALA).9 In addition to being fluorescent it also can mediate a photodynamic effect.16 Considering a fractionation scheme where 2 Gy are administered each day for 30 days, the daily light dose at 450 nm would be approximately 20 μJ/cm2 and 32 μJ/cm2 for 6 or 18 MV photon beam, respectively. The accumulated light dose, over thirty days, would be 0.6 mJ/cm2 and 1 mJ/cm2, respectively for the two photon beam energies. While this is much lower than standard dosing in PDT, a recent in vitro study suggests that ultra-low fluence rate excitation during PDT may be effective.17 However, the total PDT light dose will be limited by the treatment scheme used in external beam radiation therapy. The PpIX concentrations employed in this study are well within the range of reported data of high-grade gliomas18 and in vitro studies have previously confirmed that the fluorescence from PpIX, induced in cells after administration of ALA, correlates well with the total cell size.19 Hence, there is a potential application in radiotherapy treatment assessment using the rationale presented in this paper. Future studies will include measurements of PpIX fluorescence induced by an external radiation beam with the aim to track temporal changes in PpIX production over the course of several radiotherapy fractionations.
CONCLUSION
In conclusion, it has been shown that molecular fluorescence can be induced in an aqueous medium mimicking tissue using radiation from a clinical linear accelerator.
ACKNOWLEDGMENT
This work has been funded by NIH grants RO1CA120368 and PO1CA084203.
References
- Cerenkov P. A., “Visible emission of clean liquids by action of γ radiation,” Dok. Akad. Nauk SSSR 2, 451–454 (1934). [Google Scholar]
- Robertson R., Germanos M. S., Li C., Mitchell G. S., Cherry S. R., and Silva M. D., “Optical imaging of Cerenkov light generation from positron-emitting radiotracers,” Phys. Med. Biol. 54(16), 355–365 (2009). 10.1088/0031-9155/54/16/N01 [DOI] [PMC free article] [PubMed] [Google Scholar]
- Ross H. H., “Measurement of β-emitting nuclides using Cerenkov radiation,” Anal. Chem. 41(10), 1260–1265 (1969). 10.1021/ac60279a011 [DOI] [Google Scholar]
- Liu H., Ren G., Miao Z., Zhang X., Tang X., Han P., Gambhir S. S., Cheng Z., and Boswell A., “Molecular optical imaging with radioactive probes,” PLoS One 5(3), 9740 (2010). [DOI] [PMC free article] [PubMed] [Google Scholar]
- Dothager R. S., Goiffon R. J., Jackson E., Harpstrite S., and Piwnica D.-Worms, “Cerenkov radiation energy transfer (cret) imaging: a novel method for optical imaging of pet isotopes in biological systems,” PLoS One 5(10), 13300 (2010). 10.1371/journal.pone.0013300.g001 [DOI] [PMC free article] [PubMed] [Google Scholar]
- Lewis M. A., Kodibagkar V. D., Oz O. K., and Mason R. P., “On the potential for molecular imaging with Cerenkov luminescence,” Opt. Lett. 35(23), 3889–3891 (2010). 10.1364/OL.35.003889 [DOI] [PMC free article] [PubMed] [Google Scholar]
- Tamm I. E. and Frank I. M., “Coherent radiation from a fast electron in a medium,” Dokl. Akad. Nauk SSSR 14, 107–112 (1937). [Google Scholar]
- Stummer W., Pichlmeier U., Meinel T., Wiestler O. D., Zanella F., and Reulen H. J., “Fluorescence-guided surgery with 5-aminolevulinic acid for resection of malignant glioma: a randomised controlled multicentre phase III trial,” Lancet Oncol. 7(5), 392–401 (2006). 10.1016/S1470-2045(06)70665-9 [DOI] [PubMed] [Google Scholar]
- Kennedy J. C., Pottier R. H., and Pross D. C., “Photodynamic therapy with endogenous protoporphyrin IX: basic principles and present clinical experience,” J. Photochem. Photobiol. B 6(1–2), 143 (1990). 10.1016/1011-1344(90)85083-9 [DOI] [PubMed] [Google Scholar]
- Kienle A. and Patterson M. S., “Improved solutions of the steady-state and the time-resolved diffusion equations for reflectance from a semi-infinite turbid medium,” J. Opt. Soc. Am. A 14(1), 246–254 (1997). 10.1364/JOSAA.14.000246 [DOI] [PubMed] [Google Scholar]
- Collins G. B. and Reiling V. G., “Cerenkov radiation,” Phys. Rev. 54, 499–503 (1938). 10.1103/PhysRev.54.499 [DOI] [Google Scholar]
- Mather R. L., “Cerenkov radiation from protons and the measurement of proton velocity and kinetic energy,” Phys. Rev. 84, 181–190 (1951). 10.1103/PhysRev.84.181 [DOI] [Google Scholar]
- Frelin A. M., Fontbonne J. M., Ban G., Colin J., Labalme M., Batalla A., Isambert A., Vela A., and Leroux T., “Spectral discrimination of Cerenkov radiation in scintillating dosimeters,” Med. Phys. 32, 3000 (2005). 10.1118/1.2008487 [DOI] [PubMed] [Google Scholar]
- Khan F., Doppke K., Hogstrom K., Kutcher G. J., Nath R., Prasad S. C., Purdy J. A., Rozenfeld M., and Werner B. L., “Clinical electron-beam dosimetry,” Med. Phys. 18(1), 73–109 (1991). 10.1118/1.596695 [DOI] [PubMed] [Google Scholar]
- Siebers J. V., Keall P. J., Nahum A. E., and Mohan R., “Converting absorbed dose to medium to absorbed dose to water for Monte Carlo based photon beam dose calculations,” Phys. Med. Biol. 45, 983 (2000). 10.1088/0031-9155/45/4/313 [DOI] [PubMed] [Google Scholar]
- Dougherty T. J., Gomer C. J., Henderson B. W., Jori G., Kessel D., Korbelik M., Moan J., and Peng Q., “Photodynamic therapy,” J. Natl. Cancer Inst. 90(12), 889–905 (1998). 10.1093/jnci/90.12.889 [DOI] [PMC free article] [PubMed] [Google Scholar]
- Mathews M. S., Angell E.-Petersen, Sanchez R., Sun C., Vo V., Hirschberg H., and Madsen S. J., “The effects of ultra low fluence rate single and repetitive photodynamic therapy on glioma spheroids,” Lasers Surg. Med. 41(8), 578–584 (2009). 10.1002/lsm.20808 [DOI] [PMC free article] [PubMed] [Google Scholar]
- Johansson A., Palte G., Schnell O., Tonn J., Herms J., and Stepp H., “5-aminolevulinic acid-induced protoporphyrin ix levels in tissue of human malignant brain tumors,” Photochem. Photobiol. 86(6), 1373–1378 (2010). 10.1111/j.1751-1097.2010.00799.x [DOI] [PubMed] [Google Scholar]
- Gibbs S. L., Chen B., ’Hara J. A. O, Hoopes P. J., Hasan T., and Pogue B. W., “Protoporphyrin ix level correlates with number of mitochondria, but increase in production correlates with tumor cell size,” Photochem. Photobiol. 82(5), 1334–1341 (2006). 10.1562/2006-03-11-RA-843 [DOI] [PubMed] [Google Scholar]


