

Abstract
On-Off direction-selective retinal ganglion cells (DSGCs) encode the axis of visual motion. They respond strongly to an object moving in a preferred direction and weakly to an object moving in the opposite, “null,” direction. Historically, On-Off DSGCs were classified into four subtypes according to their directional preference (anterior, posterior, superior, or inferior). Here, we compare two genetically identified populations of On-Off DSGCs: dopamine receptor 4 (DRD4)-DSGCs and thyrotropin-releasing hormone receptor (TRHR)-DSGCs. We find that although both populations are tuned for posterior motion, they can be distinguished by a variety of physiological and anatomical criteria. First, the directional tuning of TRHR-DSGCs is broader than that of DRD4-DSGCs. Second, whereas both populations project similarly to the dorsal lateral geniculate nucleus, they project differently to the ventral lateral geniculate nucleus and the superior colliculus. Moreover, TRHR-DSGCs, but not DRD4-DSGCs, also project to the zona incerta, a thalamic area not previously known to receive direction-tuned visual information. Our findings reveal unexpected diversity among mouse On-Off DSGC subtypes that uniquely process and convey image motion to the brain.
Introduction
Over a century ago Ramon y Cajal established that retinal ganglion cells (RGCs) are composed of distinct cell types based on their varying morphologies and patterns of dendritic stratification in the inner plexiform layer (Cajal, 1893). The advent of electrophysiological recordings further subdivided RGCs according to their functional properties, such as On-center, Off-center, or On-Off responses to illumination, size of receptive field, and adjustment to prolonged stimuli (transient vs sustained) (Hartline, 1938; Kuffler, 1953). Eventually, more specialized aspects of RGC tuning were applied to segregate RGCs into functional categories, such as direction selective, edge detecting, and color coding (Cleland and Levick, 1974; Caldwell and Daw, 1978; Vaney et al., 2001).
Another feature used to distinguish different RGC types is their projection patterns in the brain, i.e., the targets they innervate and their connectivity patterns within those targets. Although many mammalian RGC types project to the dorsal lateral geniculate nucleus (dLGN) and/or superior colliculus (SC) (Vaney et al., 1981; Linden and Perry, 1983), the axons of different RGC types often terminate at different depths (“layers”) of these structures, which reflects synaptic connectivity with different types or portions of postsynaptic cells (Itoh et al., 1981; Bowling and Michael, 1984; Hofbauer and Dräger, 1985; Martin, 1986; Mooney and Rhoades, 1990; Tamamaki et al., 1995; Callaway, 2005; Huberman et al., 2008, 2009; Kim et al., 2010; Hong et al., 2011). Other RGC types appear to avoid the dLGN and SC altogether, and instead innervate structures such as the brainstem accessory optic nuclei (Yonehara et al., 2008).
Within the retina, RGCs of the same type are arranged, both anatomically and functionally, as a mosaic. Anatomically, mosaics represent the regular spacing of cell bodies to allow uniform coverage of the retina by the dendrites of each RGC type (Dacey, 1993; Yang and Masland, 1994; for review, see Wässle et al., 1981; Wässle, 2004). Functionally, the receptive fields of a particular RGC type form a mosaic that uniformly samples the visual scene and provides a regular map of a given visual modality (Peichl and Wässle, 1979; Devries and Baylor, 1997; Field et al., 2007).
Recently, a comprehensive characterization of some RGC subtypes such as α-like RGCs, and On-Off and On-type direction-selective RGCs has been facilitated by transgenic mouse lines that express fluorescent proteins under the control of specific promoters (Huberman et al., 2008, 2009; Kim et al., 2008, 2010; Siegert et al., 2009; Yonehara et al., 2009). These molecular-genetic markers allow for targeted recordings from specific RGC subtypes, and thus provide a way to systematically link RGC physiology and anatomy within the retina and to link those properties to their patterns of central projections. Here we describe a new transgenic mouse line that expresses GFP under the control of the thyrotropin-releasing hormone receptor (TRHR-GFP). We show that the RGCs labeled in this mouse exhibit On-Off responses and preferentially respond to posterior motion. By analyzing the intraretinal anatomy, physiology, and central (axonal) projections of these RGCs, we identify novel components of the direction-selective visual circuitry in the brain. Comparing these TRHR-RGCs to the posterior-tuned On-Off DSGCs labeled in dopamine receptor 4 (DRD4)-GFP mice (Huberman et al., 2009) reveals that there are more than four subtypes of On-Off DSGCs in the mouse retina and suggests that each subtype exerts a unique role in visual processing.
Materials and Methods
Mice.
TRHR-GFP and DRD4-GFP mice of either sex were obtained from Mutant Mouse Regional Resource Centers (http://www.mmrrc.org/strains/30036/030036.html and http://www.mmrrc.org/strains/231/0231.html, respectively) (Gong et al., 2003) and crossed to C57BL/6 in our laboratory. All animal procedures were approved by the University of California (UC) Berkeley, UC San Diego, and Stanford Institutional Animal Care and Use Committees and conformed to the NIH Guide for the Care and Use of Laboratory Animals, the Public Health Service Policy, and the SFN Policy on the Use of Animals in Neuroscience Research.
Retinal histology.
Whole-mount retinas were fixed in 4% PFA for 30 min, then washed in block solution [2% donkey serum, 2% bovine serum albumin, 0.3% Triton X-100 in PBS, 3 times, 20 min) and left in block solution at 4°C overnight. Next, retinas were incubated in primary antibodies (1:1000 rabbit anti-GFP, Invitrogen; 1:1000 goat anti-VAChT or 1:500 goat anti-ChAT, Millipore Bioscience Research Reagents) for 12–18 h, and washed in block solution (3 times, 15 min). The retinas were then incubated in secondary antibody (1:1000 donkey anti-rabbit Alexa Fluor 488, 1:1000 donkey anti-goat Alexa Fluor 568; Invitrogen) for 2 h, and washed in block solution (3 times, 20 min). Then, retinas were mounted and coverslipped with Vectashield (Vector Laboratories). For retinal sections, the eyes were fixed in 4% PFA overnight, then immersed in 30% sucrose and cryosectioned at 20 μm. The sections were blocked for 30 min, left in primary antibody overnight at room temperature, washed (3 times, 15 min in block solution), incubated in secondary antibody for 2 h, and washed again (3 times, 10 min).
Confocal image acquisition.
Fluorescence images shown in Figure 1A–F and J–L were acquired on a Zeiss 510 laser scanning confocal microscope equipped with 488, 543, and 633 nm laser lines. Image 1A was acquired using a 10x/0.30 Plan-Neofluor air objective. Figure 1J–L images were acquired using a 63x/1.4 Plan Apochromat oil objective with a step size of 0.5 μm.
Figure 1.

TRHR marks a subset of On-Off RGCs and amacrine cells. A, Tiled fluorescence images of the ganglion cell layer of whole-mount TRHR-GFP retina. We used confocal microscopy to prevent out-of-focus fluorescence from GFP+ amacrine cells. Scale bar, 500 μm. B, Green-framed region in A. Scale bar, 100 μm. C, Cyan-framed region in A. The curved edge illustrates both GFP+ RGCs (yellow arrows) and GFP+ amacrine cells. Scale bar, 100 μm. D–F, TRHR-GFP retinas stained for GFP (D), VAChT (E), and merged (F). GFP+ RGCs were present in the GCL (yellow arrow). GFP+ amacrine cells were located in the INL. Their processes bear distinct beads and run mostly through the On layer [sublaminas 3 (S3) through 5]. SAC processes (VAChT staining) stratify in S2 and S4. Scale bars, 25 μm. G–I, GFP+ RGC filled with fluorescence dye. G, Projection of filled RGC with Alexa Fluor 594. H, I, The portion of the RGC in GCL and On layer (S3–S5) (H) and in Off layer (S1–S2) (I). The dendrites have looping arborizations (yellow arrows). Scale bars, 50 μm. J–L, Biocytin-filled GFP+ RGC and VAChT staining. Side view of a filled RGC (J), VAChT staining (K), and a merge of both (L). The processes of the RGC costratify with SAC processes. Scale bar, 25 μm. M, Density recovery profile, as described by Rodieck (1991). Gray bar, Average cell density; dashed line, effective radius, within which it was rare to observe another GFP+ soma. N, Distribution of the distances between nearest-neighbor GFP+ RGCs (n = 1075 cells from 4 retinas).
Quantification of GFP+ RGC mosaics and density.
The x and y coordinates and density of GFP+ RGCs were determined from four fields, 0.64 mm2 each (n = 5 retinas; 20 fields total). We avoided sampling fields from the outermost part of the retina, where the density of all RGCs is lower (Dräger and Olsen, 1981; Jeon et al., 1998). For all cells in a given field, the distance to its nearest neighbor (NN) was measured, and the regularity index was calculated by dividing the mean NN distance by the SD. Regularity indices were compared with random distributions of the same number of cells (Cook, 1996). Density was calculated across fields taken from different retinal quadrants and eccentricity. Autocorrelograms were prepared for each field, and a density recovery profile was constructed (Rodieck, 1991). The implementations of these methods were described previously by Huberman et al. (2009).
Electrophysiology.
All retinas were postnatal day 26 (P26) and older. Mice were anesthetized with isoflurane and decapitated. The orientation of the retinas was based on landmarks in the choroid, as described by Wei et al. (2010). Under a dissection microscope, using IR illumination, an eye cup with the retinal pigment epithelium attached was positioned with both the ganglion cell layer and the dorsal side facing upward. The nasal-temporal axis was aligned with a horizontal stripe running beneath the optic nerve, with a dark-appearing patch in the ventral side. The nasal-temporal side is opposite for left and right eyes. After verifying the orientation, retinas were isolated from pigment epithelium in oxygenated Ames' medium (Sigma), cut into dorsal and ventral parts, and mounted with photoreceptors down over a hole of 1–1.5 mm2 on filter paper (Millipore). Retinas were kept dark at room temperature in Ames' medium bubbled with 95% O2/5% CO2 until use (maximum 8 h).
Two-photon targeted recordings from GFP+ RGCs.
Filter paper-mounted retinas were placed under the microscope in oxygenated Ames medium at 32–34°C. Identification of and recording from GFP+ cells are described by Wei et al. (2010). In short, GFP+ cells were identified using a custom-modified two-photon microscope (Fluoview 300, Olympus America Inc.) at 920 nm, to avoid bleaching of the photoreceptors. Laser intensity was 100 ± 5 mW. The inner limiting membrane above the targeted cell was dissected with the glass electrode, and loose-patch voltage-clamp recordings (holding voltage set to “OFF”) were performed with a new glass electrode (3–5 MΩ) filled with Ames' medium. Data were acquired through an Axopatch 200B (Molecular Devices) and digitized at a sampling rate of 10 kHz.
Visual stimulation.
Visual stimuli were previously described by Huberman et al. (2009). In short, display images were centered on the soma of the recorded cell, and focused on the photoreceptor layer. We used 10 repetitions of a 100 μm white spot (2 s black, 2 s white, 2 s black) to test On and Off responses. To test directional responses, we presented 3–5 repetitions of drifting square-wave gratings (spatial frequency = 225 mm/cycle, temporal frequency 4 cycles/s, 30°/s in 12 pseudorandomly chosen directions spaced at 30° intervals, with each presentation lasting 3 s followed by 500 ms of gray screen). To determine the smallest area over which motion sensitivity is preserved, we limited the region exposed to the drifting gratings to a circular area with varied diameters. The center of the stimuli was shifted 50 μm from the cell body, usually toward posterior or anterior directions. The parameters of gratings were similar to those described above, but this time, we used 8 directions spaced at 45° intervals. The first circular gratings were usually 60–75 μm in diameter, and we decreased or increased this diameter according to the cells' response, with the purpose of finding the minimal stimuli diameter over which the cell can detect motion.
Data analysis.
We extracted spike times from the data after offline filtration using a 4 pole Butterworth bandpass filter between 80 and 2000 Hz. The preferred direction of each cell was determined by first normalizing the average spike count in each stimulus direction by the total number of spikes for all directions. The vectorial summation of these normalized responses yielded a vector whose direction was the preferred direction of the cell, and whose magnitude gave the strength and width of tuning (vector sum, ranges between 0 and 1). The direction-selective index (DSI) for each cell was calculated as:
where pref is the average response in the stimulus direction closest to the preferred direction, and null is the average response in the stimulus 180° opposite. A cell was considered direction selective if its DSI > 0.4. For the determination of the smallest area that produced a directional response, we used an additional criterion due to the low firing rate usually elicited by these stimulations: minimum 6 spikes and at least 3 responsive trials in the preferred direction ± 45°.
To quantify the On-Off responses we constructed the average response in 50 ms bins, and determined the maximal mean firing rate for the On and Off periods. Next, the averaged background activity was similarly determined based on the 2 s period of initial black screen in each trial. This provided the mean baseline activity and its SD. We then established the response onset and duration for the On and Off periods based on the first bin and the number of bins whose value exceeded the mean baseline activity by 3 SDs. Three or more consecutive bins with lower values indicated the end of the response.
The distributions of the parameters mentioned above were obtained for each mouse line, and the significance of their mean difference was tested using a bootstrap resampling procedure: the two datasets were combined, and artificially split into two groups (sample with replacement). We repeated the process 100,000 times, to build the distribution of mean difference under the null hypothesis that the two sample sets are drawn from the same distribution. Finally, we checked for the probability of the difference in the actual dataset. Data analysis was performed in Matlab 7 (MathWorks).
Intracellular filling and immunostaining of filled cells.
Filter paper-mounted retinas were placed under the microscope in oxygenated artificial CSF (ACSF) (containing, in mm: 119 NaCl, 2.5 KCl, 1.3 MgCl2, 1.0 K2HPO4, 2.5 CaCl2, 26.2 NaHCO3, and 11 d-glucose) at 32–34°C. GFP+ cells were targeted as described above with a glass microelectrode (3–5 MΩ) filled with an internal solution (containing, in mm: 98.3 potassium-gluconate, 1.7 KCl, 0.6 EGTA, 5 MgCl2, 2 Na2-ATP, 0.3 GTP, and 40 HEPES, pH 7.25, with KOH), as well as red fluorescence dye (20 mm Alexa Fluor 594, Invitrogen) and biocytin (3 mg/ml; Sigma). We used the whole-cell patch-clamp configuration for 10–20 min to fill the cell. Next, the dye-filled cells were imaged by the two-photon microscope at 780 nm. Images were acquired at 0.5 μm z-interval using a 60× objective (Olympus LUMPlanFl/IR 60x/0.90W). The cells' processes were later reconstructed from image stacks with Neurolucida. In a few of the reconstructed cells we lost individual branches of dendrites due to the limited field of view with the 60× objective (236 μm), which resulted in a small underestimation of the On and Off dendritic arbor diameters. To locate the filled cell's processes relative to starburst amacrine cell (SAC) processes, the retinas were further fixed and immunostained as described above, with the following secondaries: donkey anti-rabbit Alexa Fluor 488 (1:1000), donkey anti-goat Alexa Fluor 647 (1:1000) (Invitrogen), and Alexa Fluor 568-conjugated streptavidin (1:1000) (Invitrogen).
Brain histology and quantification of axonal projections.
Cholera toxin β (CTb) protocols and immunostaining of GFP-expressing axons are as described by (Huberman et al. (2008). Antibody labeling (Invitrogen rabbit polyclonal anti-GFP; 1:1000) was used to enhance the GFP signal in every case, and age-matched samples (ages ranging from P16 to P45) were examined for both mouse lines. CCD images were acquired on a Zeiss M1 microscope with Axiocam MR camera and imported to Adobe Photoshop for alignment, cropping, and adjustments to contrast. Confocal images were acquired on a Leica SB2 ABOS.
Enucleation to determine the origin of GFP axons in zona incerta .
TRHR-GFP mice (n = 2 mice; P40+) were anesthetized with inhalant isoflurane, and the extraocular muscles and optic nerve were cut with fine iridectomy scissors. Gelfoam was applied to the enucleated cavity to prevent bleeding and the eyelid was sealed. The mouse was recovered on a heating pad and then was returned to its home cage for 7 d, at which time, it was overdosed with sodium pentobarbital and perfused with physiological saline, followed by 4% PFA.
Results
TRHR-RGCs are bistratified and costratify with starburst amacrine cell processes
As part of an ongoing screen to identify mouse lines in which specific populations of retinal neurons express fluorescent proteins (Huberman et al., 2008, 2009; Siegert et al., 2009), we examined retinas from transgenic mice with GFP expressed under the control of the TRHR. In TRHR mice, GFP is expressed by two populations of cells—one population in the inner nuclear layer (INL) and one population in the ganglion cell layer (GCL) (Fig. 1A–C). The GFP+ cells in the INL exhibit beaded dendrites that mainly innervate the On layer of the inner plexiform layer (IPL) (Fig. 1C–F) and resemble A13 amacrine cells in cat (Kolb et al., 1981). The GFP+ neurons in the GCL have large, spherical somas and axons that extend toward the optic nerve head (Fig. 1A,B).
To characterize these TRHR-RGCs and determine whether they comprise a single RGC type, we first performed a series of anatomical experiments. We filled GFP+ RGCs with a fluorescent dye to analyze their dendritic morphology. All filled cells (n = 24 cells from 7 mice) exhibited two distinct bands of dendrites in IPL and “looping” arborizations (Fig. 1G–I). This description matches that of On-Off DSGCs across species (Vaney et al., 2001; Weng et al., 2005; Berson, 2008). Next, we filled individual GFP+ RGCs with biocytin and immunostained the retina for VAChT, which labels starburst amacrine cell processes (Fig. 1J–L). This revealed that the dendritic arbors of the filled GFP+ RGCs costratified with starburst amacrine processes in the On and Off sublaminae (n = 5 cells from 4 mice). Our results are consistent with previous descriptions of On-Off DSGCs (Demb, 2007; Fried and Masland, 2007), and thus suggest that TRHR-RGCs are On-Off DSGCs.
Since the somas of a particular RGC subtype tend to form a regularly spaced mosaic (Wässle, 2004), we analyzed the spatial distribution of GFP+ RGC somas. We found that the pattern of TRHR-GFP somas across the retina was non-random (Fig. 1M, regularity index = 2.6; p < 0.0001 vs a random distribution; n = 1075 cells from 4 retinas) with an average soma spacing of ∼63 μm (Fig. 1N). Collectively, our findings support the hypothesis that, in TRHR mice, GFP is expressed by a subset of On-Off RGCs that are non-randomly distributed and that possess dendritic arborization patterns characteristic of On-Off DSGCs.
TRHR mice exhibit labeling of posterior-preferring On-Off DSGCs similar to DRD4 mice
To determine whether TRHR-RGCs are in fact direction selective, we recorded their responses to light stimuli. To avoid bleaching of the photoreceptors, we used two-photon targeted patch-clamp recordings (Huberman et al., 2009; Wei et al., 2010). First, we recorded the On and Off responses of the cells using a white spot centered on the cell's soma. All but one of the cells revealed On and Off responses (n = 80; see example in Fig. 2A, left bottom). Second, we recorded the directional responses of the cells using drifting gratings. The vast majority of TRHR-RGCs exhibited a clear directional preference (Table 1). Surprisingly, all the direction-selective cells preferred posterior motion (Fig. 2A,B). Hence, in TRHR mice, GFP selectively labels posterior-preferring On-Off DSGCs.
Figure 2.
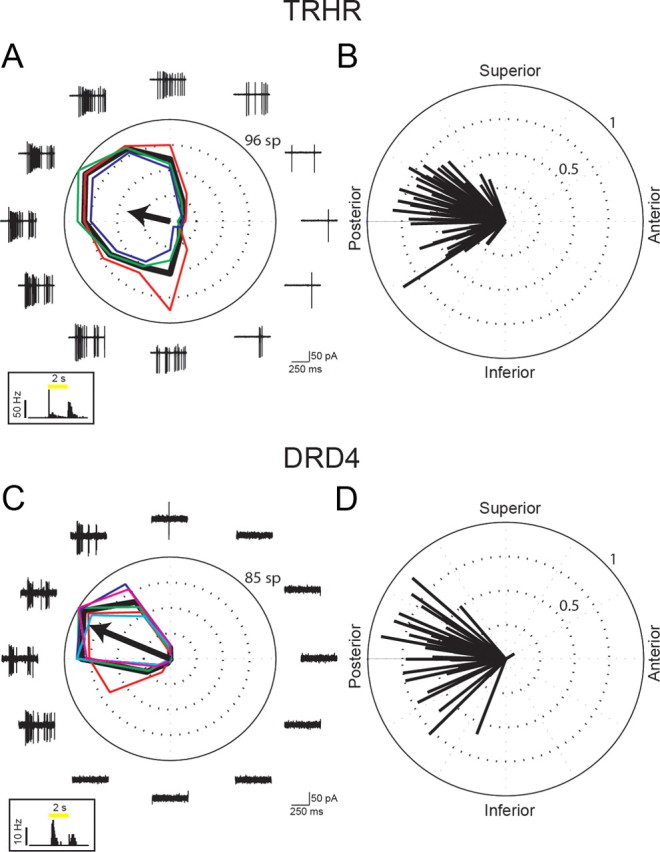
Two-photon targeted recordings reveal GFP+ RGCs in two transgenic mouse lines with similar directional preference. A, C, Responses to drifting gratings of TRHR-RGC (A) and DRD4-RGC (C). Black tuning curve shows the mean response (spike count during 3 s of gratings); colored curves show the responses for each repetition (red, green, blue) (cyan and magenta are shown for DRD4 cell, which had 5 repetitions). Black arrow indicates the vector sum of responses. Traces show the data for the first 500 ms of gratings stimuli (two periods). Frequent presentation of edges in the gratings stimulus makes resolving the On and Off responses difficult. For TRHR-RGC in A, DSI = 0.75 and vector sum = 0.42. For DRD4-RGC in C, DSI = 0.99 and vector sum = 0.84. Left bottom, Spike-density histograms of corresponding On and Off responses to a 100 μm spot shown centered on the soma (10 repetitions, 50 ms bins). Yellow bar represents the time of the spot stimuli. B, D, Vector sums of all recorded cells in TRHR (B) and DRD4 (D) mice (n = 80 and n = 40 cells from 31 TRHR and 18 DRD4 mice, respectively).
Table 1.
Comparison between the light responses of GFP+ RGCs in TRHR and DRD4 mouse lines
| TRHR | DRD4 | |
|---|---|---|
| On response | 98.75% (79/80) | 95% (38/40) |
| Off response | 100% (80/80) | 90% (36/40) |
| Directional preference | 90% (72/80) | 85% (34/40) |
The percentages and number of cells that revealed On and Off responses, as well as directional preference, out of all the recorded cells. Cells with DSI > 0.4 were considered as direction selective.
Recently, posterior-preferring On-Off DSGCs were also identified in a different mouse line in which dopamine receptor 4 drives expression of GFP in a subset of RGCs (DRD4-DSGCs) (Huberman et al., 2009). Do TRHR-DSGCs and DRD4-DSGCs represent overlapping or distinct populations of DSGCs? To address this question, we first compared their light responses. Similar to TRHR-DSGCs, the majority of DRD4-DSGCs exhibited On and Off responses (Table 1; see example in Fig. 2C, left bottom) and preferred posterior motion (Huberman et al., 2009; Wei et al., 2011) (Table 1, Fig. 2C,D). Therefore, we compared more detailed parameters of the On and Off responses (Fig. 3A,B). The distributions for all these parameters were broad and significantly overlapped. However, the average duration of the On response was significantly larger in TRHR-DSGCs than in DRD4-DSGCs (bootstrap test, p < 0.05). In addition, comparing directional tuning properties revealed that the two populations were different. While the mean DSI, which compares firing in the preferred vs null directions, did not turn out to be significantly different between the two populations, the mean vector sum was significantly lower in TRHR- than in DRD4-DSGCs (bootstrap test, p < 0.01, Fig. 3C). The vector sum contains information on both tuning strength (i.e., preferred vs null) and tuning width. Thus, the difference in the vector sum but not DSI suggests that TRHR-DSGCs were more broadly tuned than DRD4-DSGCs, responding to a larger range of directions around the preferred direction.
Figure 3.

The light responses of TRHR- and DRD4-RGCs: comparison between the distributions of distinct parameters. Top images (black) and bottom images (gray) correspond to TRHR and DRD4 mouse lines, respectively. A, On response population analysis. Distributions of maximal firing rate (Max FR) (left) and response duration (right) in response to 2 s 100 μm white spot shown centered on the soma. Values are based on the average response (10 repetitions, 50 ms bins). See Materials and Methods for details. Top images (black) and bottom images (gray) correspond to TRHR and DRD4 mouse lines, respectively. The average maximal firing rate did not differ (bootstrap test, p = 0.07), but the mean response duration was statistically different (bootstrap test, p < 0.05). B, Off response population analysis. Maximal firing rate (left) and response duration (right) in the 2 s that followed the white spot disappearance. Same conventions as in A. The averages of the two populations were not found to be statistically different (bootstrap test, p = 0.43 and p = 0.19 for maximal firing rate and response duration, respectively). C, Directional tuning population analysis. The distributions of DSI (left) and of vector sum (right) of all recorded cells. The two populations did not differ in their mean DSI (bootstrap, p = 0.09), but they differed in their vector sum (bootstrap, p < 0.01). Distributions found as statistically different are marked: *p < 0.05, **p < 0.01. Dashed lines show median values.
One possibility is that the differences in directional tuning curves result from physiological differences between the two mouse lines. However, the vector sums measured in both TRHR and DRD4 were in the range of those recorded using a multielectrode array (Elstrott et al., 2008). In addition, we conducted recordings from the Grik4-Cre mouse line (Ivanova et al., 2010) which labels a subset of RGCs. We found that ∼30% of GFP+ RGCs in Grik4 retinas were On-Off DSGCs, all of which were tuned to anterior motion (data not shown). Again, the vector sums measured in both TRHR and DRD4 were similar to those on Grik4 mice. Thus, the differences described between TRHR and DRD4 likely result from genuine differences in their tuning, and indicate that there is more than one subtype of posterior-tuned On-Off DSGC in mouse retina.
TRHR-DSGCs are less numerous than DRD4-DSGCs but display a similar dendritic morphology
To further compare TRHR- and DRD4-DSGCs, we analyzed the anatomical properties of the GFP+ cells in both mouse lines. First, we counted the GFP-expressing DSGCs at P16 and P45. We found that the number of labeled DSGCs in TRHR mice was less than half that in DRD4 mice (Fig. 4A). Moreover, in TRHR mice, the number of GFP+ cells was constant with age, while in DRD4 mice, it decreased with age. This last result could be partially explained by the fact that, with age, the overall intensity of GFP fluorescence remains high in TRHR-DSGCs but decreases in DRD4-DSGCs.
Figure 4.

Both TRHR- and DRD4-RGCs exhibit dendritic overlap which may compensate for their physiological properties. A, Cell counts of TRHR- and DRD4-RGCs from immunostained whole-mount retinas at P16 and P45. n = 5 for P16 DRD4 and n = 4 otherwise. B, Morphological properties of TRHR- and DRD4-RGCs revealed by Neurolucida reconstructions of filled cells. The parameters we measured corresponded to those previously reported to distinguish between mouse bistratified cells, and include soma size, dendritic diameters in On and Off layers, and symmetry assessment. All three diameters were not found as different (Kolmogorov–Smirnov test, p > 0.5, p > 0.14, and p > 0.74 for soma, On, and Off trees), while symmetry differed significantly (Kolmogorov–Smirnov test, p < 0.05). C, Neurolucida reconstructions of four neighboring TRHR-RGCs (right) and four neighboring DRD4-RGCs (left) that were sequentially filled. Bottom, XZ section of the reconstructed cells. Scale bar, 100 μm. D, Examples of directional tuning of TRHR-RGCs (middle column) and DRD4-RGCs (right column) in response to drifting gratings over a limited circular area. Left column illustrates the visual stimuli with the different diameters of gratings. The minimal area required for detection of motion was ∼100 μm and ∼125 μm for TRHR- and DRD4-DSGCs, respectively.
Next, we analyzed the dendritic morphology of GFP+ DSGCs in both mouse lines. Previous work classifying RGCs based on their morphology has suggested that there are between 2 and 6 different bistratified RGCs in mouse retina (Sun et al., 2002; Badea and Nathans, 2004; Coombs et al., 2006; Völgyi et al., 2009). The primary parameters used to distinguish between the different bistratified types are stratification depth in the IPL, soma size, dendritic field diameter, and symmetry.
To compare TRHR- and DRD4-DSGC morphology based on these parameters, we filled GFP+ DSGCs from each mouse line with the red-fluorescent dye Alexa Fluor 594, acquired Z-stack images of the filled cells with two-photon microscopy, and reconstructed the cells' dendrites with Neurolucida. Both TRHR- and DRD4-DSGCs costratified with ChAT processes, indicating that they shared the same depth of stratification (Fig. 1J–L) (Huberman et al., 2009). Both had similar soma size and total dendritic field size (Fig. 4B; n = 13 and n = 12 cells for TRHR- and DRD4-mice, respectively). However, there was a significantly different degree of symmetry to their dendritic trees. The TRHR-DSGC somas rested at the center of their dendritic fields, while DRD4-DSGC somas had a small tendency to shift away from it (Fig. 4B) (see also Yang and Masland, 1994). Thus, the dendritic arbors of TRHR-DSGCs were more symmetric than those of DRD4-DSGCs.
TRHR- and DRD4-DSGCs both exhibit significant dendritic overlap
An important parameter that has traditionally been used to characterize cell types is the tiling of their dendritic arbors (Wässle et al., 1981). In rabbit retina, DSGCs with similar directional preferences exhibit little or no dendritic overlap with each other (Vaney, 1994; Amthor and Oyster, 1995). The existence in mouse of more than one subtype of posterior-preferring On-Off DSGC led us to assess the dendritic overlap within the TRHR- and DRD4-DSGC populations. Based on the values we gathered for soma density and dendritic tree diameter in the two mouse lines, we estimate that the coverage factor (i.e., number of dendritic arbors that cover a given region of retina) is on average 1.55 for TRHR-DSGCs and 2.99 for DRD4-DSGCs,. Indeed, Neurolucida reconstructions of sequential cell fills of neighboring GFP+ DSGCs reveal that the TRHR- and DRD4-DSGCs both exhibit significant dendritic overlap (Fig. 4C).
This amount of dendritic overlap for each posterior-tuned DSGC population is considerably higher than the small overlap reported in rabbit, which could result in a redundant representation of moving stimuli. Is there a reason for the relatively high coverage factor provided by these GFP+ DSGC populations? One possibility is that dendritic overlap is required for the complete representation of object motion in the mouse visual field. In rabbit retina, a single DSGC produces a directional response to a motion stimulus confined to ∼40 μm of the dendritic field (Barlow and Levick, 1965). This area corresponds to 15% or less of the large dendritic field of rabbit On-Off DSGCs (Yang and Masland, 1994). To test the motion sensitivity at the level of a single DSGC in mouse retina, we determined the minimal area of the dendritic tree that needed to be stimulated to produce a directionally tuned response (Fig. 4D). Both TRHR- and DRD4-DSGCs required a minimal stimulation area of more than a 100 μm in diameter to preserve their directional preferences (108 ± 12 μm, n = 12; and 134 ± 11 μm, n = 4; mean ± SD for TRHR- and DRD4-DSGCs, respectively). This area corresponds to >50% of the dendritic field of On-Off DSGCs in mouse (Fig. 4B,C) (Sun et al., 2002). Hence, the high amount of dendritic overlap we see for mouse DSGCs may exist to compensate for these cells' poorer resolution of motion at the single-cell level.
The central projections of TRHR-DSGCs are partially distinct from those of DRD4-DSGCs
To further distinguish between TRHR- and DRD4-DSGCs and to obtain a better understanding of direction-selective visual circuits, we compared the central projections of these two genetically labeled DSGC populations. First, we made bilateral intravitreal injections of cholera toxin β conjugated to Alexa Fluor 594 (CTb-594) in TRHR and DRD4 mice, which labels all RGC axons. Two days later, we harvested and stained the brains of the CTb-injected mice, processed them for anti-GFP immunohistochemistry, and then systematically examined every retinorecipient target in the brain for the presence and pattern of CTb-594+/GFP+ axons.
The patterns of RGC axon projections revealed interesting similarities, as well as key differences between the two transgenic mouse lines. Both TRHR- and DRD4-DSGCs send axons to the dLGN and to the SC. The dLGN is a forebrain nucleus that filters and relays visual information to the cortex. Within the dLGN, both DSGCs project their axons specifically to a thin 100–150 μm segment or “layer” located just medial to the optic tract (Fig. 5A–C, G,H). In other portions of the visual thalamus, however, the axon termination patterns of TRHR-DSGCs are clearly distinct from those of DRD4-DSGCs. TRHR-DSGCs strongly innervate the lateral portion of the ventral lateral geniculate (vLGN) (Fig. 5A,B). The same region appears weakly innervated by DRD4-DSGCs (Fig. 5H), but closer inspection suggests that these DRD4-DSGC axons are largely fibers en route to the dLGN and SC. Thus, TRHR-DSGCs provide substantially more input than DRD4-DSGCs to the vLGN.
Figure 5.
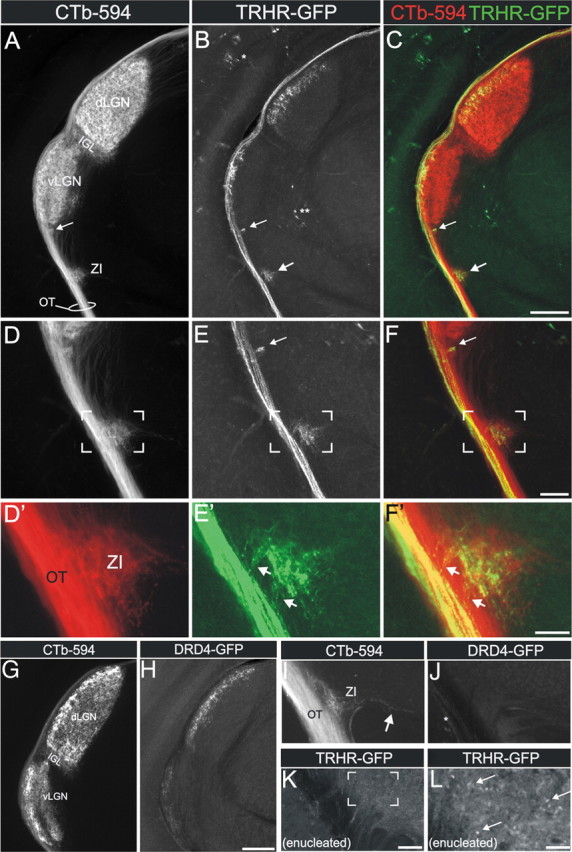
Similar and divergent axon projection patterns from TRHR- and DRD4-RGCs to the visual thalamus. A, Pan-RGC axon labeling with CTb-594 revealed the optic tract (OT) and retinorecipient areas in the mouse thalamus, including ZI, intergeniculate leaflet (IGL), and dLGN. B, TRHR-GFP axons in the same tissue section as in A. GFP+ axons are seen in the OT and in the ZI (large arrow) and just dorsal to ZI, in a small terminal field (small arrow). Single asterisk indicates GFP somas in the overlying hippocampus. Double asterisk indicates GFP somas in a more medial thalamic target. C, Merged representation of A and B. D, Magnified view of retinal projections shown in A, centered on ZI. E, Magnified view of TRHR-GFP projections shown in B, centered on ZI. F, Merged representation of D and E. Scale bars: (A–C), 250 μm; (D–F), 100 μm. D′, E′, High-magnification views of D–F. Arrows in E′ and F′ indicate TRHR-GFP RGC axons that exit the optic tract medially and enter the ZI. Scale bar, 30 μm. G, Pan-RGC axon labeling with CTb-594. H, DRD4-GFP axons in the dLGN (compare with B above). GFP terminals are present in the lateral-most dLGN, and sparse GFP+ terminals and/or fibers of passage are seen in the vLGN (for details, see Huberman et al., 2009). Scale bar, 250 μm. I, CTb-labeled axons in the ZI (arrow indicates RGC axons extending into the ZI). J, DRD4-GFP-positive axons in the same field as I. Asterisk indicates DRD4-GFP+ axons in the OT. Note that DRD4-GFP fibers are not observed in the ZI, which contrasts to E and F. K, View of the optic tract region and ZI in a TRHR-GFP mouse that had the contralateral eye enucleated (removed) 1 week prior. No GFP axons are observed in the ZI except for GFP puncta (see L), which are the remnants of degenerated GFP axons. Scale bar (I–K), 75 μm. L, High-magnification view of the bracketed region in K. Arrows indicate GFP puncta of degenerated axons that remain 7 d after enucleation. Scale bar, 25 μm.
TRHR-DSGCs also project their axons to the zona incerta (ZI), a forebrain area that resides ventral to the vLGN, and just medial to the optic tract (Fig. 5A–F′). Moreover, a small nest of their axonal arbors is observed immediately ventral to the vLGN (Fig. 5B,E,E′, small arrows). Whether this nest of terminals corresponds to a distinct retinorecipient area or to a subdivision of the vLGN is unclear at this time. By contrast, terminals of DRD4-DSGC axons are not seen in the ZI (Fig. 5I,J) or in the small area ventral to the vLGN (Fig. 5H). GFP axons in the ZI originated from GFP+ RGCs and not from GFP-expressing neurons elsewhere in the CNS. This was confirmed by the fact that (1) GFP axons could be seen entering the ZI via the adjacent optic tract (Fig. 5E,F,E′,F′), (2) they were colabeled with CTb-594 that was injected into the eye to label RGC axons, and (3) removal (enculeation) of the eye induced degeneration and loss of GFP axons in the ZI of TRHR-GFP mice (Fig. 5K,L). Thus, within the visual thalamus, TRHR- and DRD4-DSGCs display similar patterns of axonal termination in the dLGN, but different termination patterns in other visual thalamic nuclei, the most salient difference being the clear presence of direct input to the ZI from TRHR-DSGCs.
Another major target of TRHR-DSGCs is the superior colliculus, a midbrain target involved in eye movements and direction of gaze. CTb-594 labeling reveals the overall pattern of retino-collicular innervation: RGC axons enter the SC deep to the pial surface in the stratum opticum and extend terminal arbors in the overlying stratum griseum superficialis (SGS). The SGS can be divided according to depth from the pial surface into the lower SGS (lSGS) and upper SGS (uSGS) (Fig. 6A,B). TRHR-DSGCs project through the lSGS and arborize only in the uSGS (Fig. 6C,D). DRD4-DSGCs exhibit a similar pattern (Fig. 6E,F) (Huberman et al., 2009), but their terminal zones distribute more evenly throughout the uSGS than do those of the TRHR-DSGCs. The TRHR-DSGC axons form terminal zones that, overall, are sparser and less confluent (Fig. 6C–F), creating patches that are densest in the medial and caudal SC (Fig. 6C,D).
Figure 6.

Axon projection patterns arising from TRHR- and DRD4-RGCs to the superior colliculus. A, B, Pan-RGC axon labeling with CTb-594 revealed RGC axon shafts in the stratum opticum (SO) and RGC axon terminals in the lSGS and uSGS when the SC was viewed in either the sagittal (A) or coronal (B) plane. Pt, Pretectum. C–F, Axons of TRHR-RGCs and DRD4-RGCs entered the SC through the SO, and turn dorsally, passing through the lSGS to terminate in the overlying uSGS. The terminal fields of TRHR-RGCs (C, D) were less dense overall and patchy relative to those of DRD4-RGCs (E, F). Also note that TRHR-RGC terminals were less dense in the rostral (C) and lateral (D) portion of the SC. Scale bar, 250 μm. Asterisk in D, GFP-expressing midline glia.
Collectively, our analyses indicate that TRHR- and DRD4-DSGCs display markedly different patterns of connectivity in the brain. TRHR-DSGCs send directional information to a broader range of targets than do DRD4-DSGCs. Moreover, within the SC, the overall pattern of terminal arbors for TRHR-DSGCs is notably sparser and less uniform across the retinotopic map than is the termination pattern for DRD4-DSGCs.
Discussion
By comparing two transgenic mouse lines that express GFP in posterior-preferring On-Off DSGCs, we discovered that there are at least two distinct On-Off DSGC types that prefer posterior motion. Although GFP+ neurons in TRHR and DRD4 mice exhibit similar morphologies and light responses, TRHR-DSGCs project to the zona incerta, whereas DRD4-DSGCs do not. In addition, the overall arborization patterns of TRHR and DRD4 RGCs differ within the SC. Physiologically, the mean directional tuning curve for TRHR-DSGCs is broader than that for DRD4-DSGCs. Our findings suggest that sensitivity for motion along the posterior axis of the visual field is encoded by parallel channels that may play both overlapping and distinct roles in image formation and non-image-forming tasks.
Pure mosaics and dendritic overlap as a means for distinguishing cell types
In view of the difficulty in defining a cell type, an additional criterion that should be considered comes from the mosaic theory. This theory assumes that the dendrites of each functionally defined cell type will uniformly and independently cover the whole visual field, while avoiding overlap. Indeed, α cells in cat form a regular mosaic with little dendritic overlap (Wässle et al., 1981). In mouse, many RGC subtypes appear to tile less uniformly and with considerable overlap. For example, two populations of wide-field α-like cells both exhibit overlap of their dendritic fields ranging between 0% and 70% (Völgyi et al., 2005; Huberman et al., 2008), and the mouse DSGCs described in our study here provide another such example. The avoidance of dendritic overlap only works if we assume that the computation carried by a cell can be made on a single-spot basis. If a minimal stimulation area is necessary for a cell to obtain its output, then cells must overlap at least this minimal amount to reliably represent the whole visual field.
Barlow and Levick (1965) found that, in rabbit, the smallest region that produces directional responses in single DSGC covers ∼0.25° of the visual field. However, we find that, in mouse, this minimal area is larger, covering ∼4° of the field. A possible reason for this difference could lie in the different visual stimuli used; but another source might be a poorer resolution of mouse DSGCs. Such a difference can explain why little dendritic overlap of On-Off DSGCs preferring the same direction has been reported in rabbit (Vaney, 1994; Amthor and Oyster, 1995), whereas a large amount of dendritic overlap is seen for each of the posterior-preferring TRHR- and DRD4-DSGCs in mouse. Indeed, 0.25° of visual field is represented by 43 μm of rabbit retina (Hughes, 1972), and this is only a small portion of the large dendritic arbors of their On-Off DSGCs (their diameters range between 300 and 600 μm) (Yang and Masland, 1994). Hence, On-Off DSGCs in rabbit should overlap to a very small degree to functionally cover the whole visual field. In contrast, 4° is represented by 124 μm of mouse retina, and this corresponds to more than half of the DSGC dendritic arbor diameter (Fig. 4B,C) (Sun et al., 2002). As a result, On-Off DSGCs in mouse exhibit a high level of dendritic overlap of 50% or more. Thus, anatomical mosaics with minimal overlap will form only if dendritic field overlap is not vital for functional coverage of the retina.
Relationship between TRHR- and DRD4-DSGCs
This work provides anatomical and physiological evidence that TRHR- and DRD4-DSGCs are different populations, but it does not completely resolve the relationship between them. While the light responses of the two populations differ in the distribution of certain parameters, such as the vector sum, these distributions are wide in both mice and their ranges overlap. With regard to the anatomical data, the presence of GFP+ axons in the ZI of TRHR mice does not confirm that all TRHR-DSGCs send their axons to that structure. As a result, we cannot definitively determine whether TRHR- and DRD4-DSGCs are distinct populations or share a common subset of cells. Our cell count data demonstrate that TRHR-DSGCs are less numerous than DRD4-DSGCs and thus narrows the possibilities to two options: either TRHR- and DRD4-DSGCs partially overlap, or they are totally distinct.
How many On-Off DSGC subtypes are there?
On-Off DSGCs prefer one of four directions: superior, inferior, posterior, and anterior (Oyster and Barlow, 1967). If extended to other axes of motion, our findings suggest that there could be eight subtypes of On-Off DSGCs in the mouse retina, two subtypes for each cardinal direction. Morphologically, most studies report that 20–27% of mouse RGCs are bistratified (Sun et al., 2002; Badea and Nathans, 2004; Coombs et al., 2006). The majority of these cells were shown to stratify in layers close to those of SAC processes, but not all of them are necessarily direction selective. Still, it seems possible that either mouse retina could contain eight On-Off DSGCs, or perhaps only posterior motion contains multiple subtypes. However, it is interesting to note that a recent study described two distinct types of On DSGCs in the rabbit retina (Kanjhan and Sivyer, 2010). As more transgenic mouse lines are discovered that label anterior-, superior-, or inferior-preferring On-Off DSGCs, we expect this issue will be resolved.
Zona incerta and the role of On-Off DSGCs in central visual processing
As opposed to On-type DSGCs, which project to the accessory optic nuclei and are thought to regulate the optokinetic reflex (Simpson, 1984), the role of On-Off DSGCs in visual processing is still poorly understood. Our findings indicate that their roles in visual processing are diverse. First, we show that posterior-preferring On-Off DSGC subtypes with different anatomies and physiological profiles both connect to the dLGN, which lends additional support to the idea that On-Off DSGCs in mouse are positioned to influence cortical responses via the retino-geniculo-striate pathway and perhaps even to influence conscious perception of directional motion. The presence of On-Off DSGC input to the SC also implies that these cells influence eye and head movements. The additional targeting of ZI by TRHR-DSGCs is intriguing and raises several new questions both about direction-sensitive parallel visual pathways and ZI function. It was previously reported that RGCs project to the ZI (Hicks et al., 1986; Johnson et al., 1988; Youngstrom et al., 1991; Matteau et al., 2003), and that the ZI interacts with other visual centers, including the dLGN, SC, pulvinar, and occipital cortex (Power et al., 1999, 2001). ZI provides dense GABAergic input to all high-order nuclei of the thalamus, and these nuclei maintain reciprocal connections with the cortex (Barthó et al., 2002). Trageser and Keller (2004) showed that ZI controls the gain of sensory afferents that directly innervate the somatosensory posterior medial nucleus. They also suggested that ZI similarly gates other thalamic high-order nuclei, such as the pulvinar. This implies that at least one On-Off DSGC subtype participates in a non-image-forming process. However, it does not exclude the possibility that DSGCs that innervate the ZI also send collaterals to the dLGN to establish image formation.
Still, the role of ZI in visual processing remains to be discovered. The genetic identification of RGCs that project to ZI provides a first step toward parsing the role of retinal and, in particular, DSGC input to this pathway. Future advances in genetic engineering where a single On-Off DSGC subtype is silenced may clarify the requirement for multiple pathways that carry similar information about motion in the visual field. In the meantime, our findings emphasize that direction-selective visual circuits are more diverse and complex than previously recognized, and they underscore the utility of genetic approaches for probing structure–function relationships of visual circuits.
Footnotes
This work was supported by NIH Grants R21 EY018320 (B.A.B) and R01 EY11310 (B.A.B), an early career grant from the E. Matilda Ziegler Foundation for the Blind (A.D.H.), and NIH Grant RO1 EY013528, NIH American Recovery & Reinvestment Act Grant EY019498 (M.B.F.), and NSF Grant 10S-0818983. M.R.-E. was supported by the Human Frontier Science Program Organization, the National Postdoctoral Award Program for Advancing Women in Science, and the Edmond and Lily Safra (ELSC) Fellowship for Postdoctoral Training in Brain Science. We thank Holly Aaron (University of California, Berkeley Molecular Imaging Center) for technical assistance.
References
- Amthor FR, Oyster CW. Spatial organization of retinal information about the direction of image motion. Proc Natl Acad Sci U S A. 1995;92:4002–4005. doi: 10.1073/pnas.92.9.4002. [DOI] [PMC free article] [PubMed] [Google Scholar]
- Badea TC, Nathans J. Quantitative analysis of neuronal morphologies in the mouse retina visualized by using a genetically directed reporter. J Comp Neurol. 2004;480:331–351. doi: 10.1002/cne.20304. [DOI] [PubMed] [Google Scholar]
- Barlow HB, Levick WR. The mechanism of directionally selective units in rabbit's retina. J Physiol. 1965;178:477–504. doi: 10.1113/jphysiol.1965.sp007638. [DOI] [PMC free article] [PubMed] [Google Scholar]
- Barthó P, Freund TF, Acsády L. Selective GABAergic innervation of thalamic nuclei from zona incerta. Eur J Neurosci. 2002;16:999–1014. doi: 10.1046/j.1460-9568.2002.02157.x. [DOI] [PubMed] [Google Scholar]
- Berson DM. Retinal ganglion-cell types and their central projections. In: Masland RH, Albright TD, editors. The senses: a comprehensive reference. San Diego: Academic; 2008. pp. 491–520. [Google Scholar]
- Bowling DB, Michael CR. Terminal patterns of single, physiologically characterized optic tract fibers in the cat's lateral geniculate nucleus. J Neurosci. 1984;4:198–216. doi: 10.1523/JNEUROSCI.04-01-00198.1984. [DOI] [PMC free article] [PubMed] [Google Scholar]
- Cajal SR. La rétine des vertébrés. Cellule. 1893;9:17–257. [Google Scholar]
- Caldwell JH, Daw NW. New properties of rabbit retinal ganglion cells. J Physiol. 1978;276:257–276. doi: 10.1113/jphysiol.1978.sp012232. [DOI] [PMC free article] [PubMed] [Google Scholar]
- Callaway EM. Structure and function of parallel pathways in the primate early visual system. J Physiol. 2005;566:13–19. doi: 10.1113/jphysiol.2005.088047. [DOI] [PMC free article] [PubMed] [Google Scholar]
- Cleland BG, Levick WR. Properties of rarely encountered types of ganglion cells in the cat's retina and on overall classification. J Physiol. 1974;240:457–492. doi: 10.1113/jphysiol.1974.sp010618. [DOI] [PMC free article] [PubMed] [Google Scholar]
- Cook JE. Spatial properties of retinal mosaics: an empirical evaluation of some existing measures. Vis Neurosci. 1996;13:15–30. doi: 10.1017/s0952523800007094. [DOI] [PubMed] [Google Scholar]
- Coombs J, van der List D, Wang GY, Chalupa LM. Morphological properties of mouse retinal ganglion cells. Neuroscience. 2006;140:123–136. doi: 10.1016/j.neuroscience.2006.02.079. [DOI] [PubMed] [Google Scholar]
- Dacey DM. The mosaic of midget ganglion cells in the human retina. J Neurosci. 1993;13:5334–5355. doi: 10.1523/JNEUROSCI.13-12-05334.1993. [DOI] [PMC free article] [PubMed] [Google Scholar]
- Demb JB. Cellular mechanisms for direction selectivity in the retina. Neuron. 2007;55:179–186. doi: 10.1016/j.neuron.2007.07.001. [DOI] [PubMed] [Google Scholar]
- Devries SH, Baylor DA. Mosaic arrangement of ganglion cell receptive fields in rabbit retina. J Neurophysiol. 1997;78:2048–2060. doi: 10.1152/jn.1997.78.4.2048. [DOI] [PubMed] [Google Scholar]
- Dräger UC, Olsen JF. Ganglion cell distribution in the retina of the mouse. Invest Ophthalmol Vis Sci. 1981;20:285–293. [PubMed] [Google Scholar]
- Elstrott J, Anishchenko A, Greschner M, Sher A, Litke AM, Chichilnisky EJ, Feller MB. Direction selectivity in the retina is established independent of visual experience and cholinergic retinal waves. Neuron. 2008;58:499–506. doi: 10.1016/j.neuron.2008.03.013. [DOI] [PMC free article] [PubMed] [Google Scholar]
- Field GD, Sher A, Gauthier JL, Greschner M, Shlens J, Litke AM, Chichilnisky EJ. Spatial properties and functional organization of small bistratified ganglion cells in primate retina. J Neurosci. 2007;27:13261–13272. doi: 10.1523/JNEUROSCI.3437-07.2007. [DOI] [PMC free article] [PubMed] [Google Scholar]
- Fried SI, Masland RH. Image processing: how the retina detects the direction of image motion. Curr Biol. 2007;17:R63–R66. doi: 10.1016/j.cub.2006.12.013. [DOI] [PubMed] [Google Scholar]
- Gong S, Zheng C, Doughty ML, Losos K, Didkovsky N, Schambra UB, Nowak NJ, Joyner A, Leblanc G, Hatten ME, Heintz N. A gene expression atlas of the central nervous system based on bacterial artificial chromosomes. Nature. 2003;425:917–925. doi: 10.1038/nature02033. [DOI] [PubMed] [Google Scholar]
- Hartline HK. The response of single optic nerve fibers of the vertebrate eye to illumination of the retina. Am J Physiol. 1938;121:400–415. [Google Scholar]
- Hicks TP, Stark CA, Fletcher WA. Origins of afferents to visual suprageniculate nucleus of the cat. J Comp Neurol. 1986;246:544–554. doi: 10.1002/cne.902460410. [DOI] [PubMed] [Google Scholar]
- Hofbauer A, Dräger UC. Depth segregation of retinal ganglion cells projecting to mouse superior colliculus. J Comp Neurol. 1985;234:465–474. doi: 10.1002/cne.902340405. [DOI] [PubMed] [Google Scholar]
- Hong YK, Kim IJ, Sanes JR. Stereotyped axonal arbors of retinal ganglion cell subsets in the mouse superior colliculus. J Comp Neurol. 2011;519:1691–1711. doi: 10.1002/cne.22595. [DOI] [PMC free article] [PubMed] [Google Scholar]
- Huberman AD, Manu M, Koch SM, Susman MW, Lutz AB, Ullian EM, Baccus SA, Barres BA. Architecture and activity-mediated refinement of axonal projections from a mosaic of genetically identified retinal ganglion cells. Neuron. 2008;59:425–438. doi: 10.1016/j.neuron.2008.07.018. [DOI] [PMC free article] [PubMed] [Google Scholar]
- Huberman AD, Wei W, Elstrott J, Stafford BK, Feller MB, Barres BA. Genetic identification of an On-Off direction-selective retinal ganglion cell subtype reveals a layer-specific subcortical map of posterior motion. Neuron. 2009;62:327–334. doi: 10.1016/j.neuron.2009.04.014. [DOI] [PMC free article] [PubMed] [Google Scholar]
- Hughes A. A schematic eye for the rabbit. Vision Res. 1972;12:123–138. doi: 10.1016/0042-6989(72)90143-5. [DOI] [PubMed] [Google Scholar]
- Itoh K, Conley M, Diamond IT. Different distribution of large and small retinal ganglion cells in the cat after HRP injections of single layers of the lateral geniculate body and the superior colliculus. Brain Res. 1981;207:147–152. doi: 10.1016/0006-8993(81)90684-3. [DOI] [PubMed] [Google Scholar]
- Ivanova E, Hwang GS, Pan ZH. Characterization of transgenic mouse lines expressing Cre recombinase in the retina. Neuroscience. 2010;165:233–243. doi: 10.1016/j.neuroscience.2009.10.021. [DOI] [PMC free article] [PubMed] [Google Scholar]
- Jeon CJ, Strettoi E, Masland RH. The major cell populations of the mouse retina. J Neurosci. 1998;18:8936–8946. doi: 10.1523/JNEUROSCI.18-21-08936.1998. [DOI] [PMC free article] [PubMed] [Google Scholar]
- Johnson RF, Morin LP, Moore RY. Retinohypothalamic projections in the hamster and rat demonstrated using cholera toxin. Brain Res. 1988;462:301–312. doi: 10.1016/0006-8993(88)90558-6. [DOI] [PubMed] [Google Scholar]
- Kanjhan R, Sivyer B. Two types of ON direction-selective ganglion cells in rabbit retina. Neurosci Lett. 2010;483:105–109. doi: 10.1016/j.neulet.2010.07.071. [DOI] [PubMed] [Google Scholar]
- Kim IJ, Zhang Y, Yamagata M, Meister M, Sanes JR. Molecular identification of a retinal cell type that responds to upward motion. Nature. 2008;452:478–482. doi: 10.1038/nature06739. [DOI] [PubMed] [Google Scholar]
- Kim IJ, Zhang Y, Meister M, Sanes JR. Laminar restriction of retinal ganglion cell dendrites and axons: subtype-specific developmental patterns revealed with transgenic markers. J Neurosci. 2010;30:1452–1462. doi: 10.1523/JNEUROSCI.4779-09.2010. [DOI] [PMC free article] [PubMed] [Google Scholar]
- Kolb H, Nelson R, Mariani A. Amacrine cells, bipolar cells and ganglion cells of the cat retina: a Golgi study. Vision Res. 1981;21:1081–1114. doi: 10.1016/0042-6989(81)90013-4. [DOI] [PubMed] [Google Scholar]
- Kuffler SW. Discharge patterns and functional organization of mammalian retina. J Neurophysiol. 1953;16:37–68. doi: 10.1152/jn.1953.16.1.37. [DOI] [PubMed] [Google Scholar]
- Linden R, Perry VH. Massive retinotectal projection in rats. Brain Res. 1983;272:145–149. doi: 10.1016/0006-8993(83)90371-2. [DOI] [PubMed] [Google Scholar]
- Martin PR. The projection of different retinal ganglion cell classes to the dorsal lateral geniculate nucleus in the hooded rat. Exp Brain Res. 1986;62:77–88. doi: 10.1007/BF00237404. [DOI] [PubMed] [Google Scholar]
- Matteau I, Boire D, Ptito M. Retinal projections in the cat: a cholera toxin B subunit study. Vis Neurosci. 2003;20:481–493. doi: 10.1017/s0952523803205022. [DOI] [PubMed] [Google Scholar]
- Mooney RD, Rhoades RW. Relationships between physiological and morphological properties of retinocollicular axons in the hamster. J Neurosci. 1990;10:3164–3177. doi: 10.1523/JNEUROSCI.10-09-03164.1990. [DOI] [PMC free article] [PubMed] [Google Scholar]
- Oyster CW, Barlow HB. Direction-selective units in rabbit retina: distribution of preferred directions. Science. 1967;155:841–842. doi: 10.1126/science.155.3764.841. [DOI] [PubMed] [Google Scholar]
- Peichl L, Wässle H. Size, scatter and coverage of ganglion cell receptive field centres in the cat retina. J Physiol. 1979;291:117–141. doi: 10.1113/jphysiol.1979.sp012803. [DOI] [PMC free article] [PubMed] [Google Scholar]
- Power BD, Kolmac CI, Mitrofanis J. Evidence for a large projection from the zona incerta to the dorsal thalamus. J Comp Neurol. 1999;404:554–565. [PubMed] [Google Scholar]
- Power BD, Leamey CA, Mitrofanis J. Evidence for a visual subsector within the zona incerta. Vis Neurosci. 2001;18:179–186. doi: 10.1017/s0952523801182027. [DOI] [PubMed] [Google Scholar]
- Rodieck RW. The density recovery profile: a method for the analysis of points in the plane applicable to retinal studies. Vis Neurosci. 1991;6:95–111. doi: 10.1017/s095252380001049x. [DOI] [PubMed] [Google Scholar]
- Siegert S, Scherf BG, Del Punta K, Didkovsky N, Heintz N, Roska B. Genetic address book for retinal cell types. Nat Neurosci. 2009;12:1197–1204. doi: 10.1038/nn.2370. [DOI] [PubMed] [Google Scholar]
- Simpson JI. The accessory optic system. Annu Rev Neurosci. 1984;7:13–41. doi: 10.1146/annurev.ne.07.030184.000305. [DOI] [PubMed] [Google Scholar]
- Sun W, Li N, He S. Large-scale morphological survey of mouse retinal ganglion cells. J Comp Neurol. 2002;451:115–126. doi: 10.1002/cne.10323. [DOI] [PubMed] [Google Scholar]
- Tamamaki N, Uhlrich DJ, Sherman SM. Morphology of physiologically identified retinal X and Y axons in the cat's thalamus and midbrain as revealed by intraaxonal injection of biocytin. J Comp Neurol. 1995;354:583–607. doi: 10.1002/cne.903540408. [DOI] [PubMed] [Google Scholar]
- Trageser JC, Keller A. Reducing the uncertainty: gating of peripheral inputs by zona incerta. J Neurosci. 2004;24:8911–8915. doi: 10.1523/JNEUROSCI.3218-04.2004. [DOI] [PMC free article] [PubMed] [Google Scholar]
- Vaney DI. Territorial organization of direction-selective ganglion cells in rabbit retina. J Neurosci. 1994;14:6301–6316. doi: 10.1523/JNEUROSCI.14-11-06301.1994. [DOI] [PMC free article] [PubMed] [Google Scholar]
- Vaney DI, Peichl L, Wässle H, Illing RB. Almost all ganglion cells in the rabbit retina project to the superior colliculus. Brain Res. 1981;212:447–453. doi: 10.1016/0006-8993(81)90476-5. [DOI] [PubMed] [Google Scholar]
- Vaney DI, He S, Taylor WR, Levick WR. Direction-selective ganglion cells in the retina. In: Zanker JM, Zeil J, editors. Motion vision—computational, neural, and ecological constraints. Berlin: Springer; 2001. pp. 13–56. [Google Scholar]
- Völgyi B, Abrams J, Paul DL, Bloomfield SA. Morphology and tracer coupling pattern of alpha ganglion cells in the mouse retina. J Comp Neurol. 2005;492:66–77. doi: 10.1002/cne.20700. [DOI] [PMC free article] [PubMed] [Google Scholar]
- Völgyi B, Chheda S, Bloomfield SA. Tracer coupling patterns of the ganglion cell subtypes in the mouse retina. J Comp Neurol. 2009;512:664–687. doi: 10.1002/cne.21912. [DOI] [PMC free article] [PubMed] [Google Scholar]
- Wässle H. Parallel processing in the mammalian retina. Nat Rev Neurosci. 2004;5:747–757. doi: 10.1038/nrn1497. [DOI] [PubMed] [Google Scholar]
- Wässle H, Peichl L, Boycott BB. Dendritic territories of cat retinal ganglion cells. Nature. 1981;292:344–345. doi: 10.1038/292344a0. [DOI] [PubMed] [Google Scholar]
- Wei W, Elstrott J, Feller MB. Two-photon targeted recording of GFP-expressing neurons for light responses and live-cell imaging in the mouse retina. Nat Protoc. 2010;5:1347–1352. doi: 10.1038/nprot.2010.106. [DOI] [PMC free article] [PubMed] [Google Scholar]
- Wei W, Hamby AM, Zhou K, Feller MB. Development of asymmetric inhibition underlying direction selectivity in the retina. Nature. 2011;469:402–406. doi: 10.1038/nature09600. [DOI] [PMC free article] [PubMed] [Google Scholar]
- Weng S, Sun W, He S. Identification of ON-OFF direction-selective ganglion cells in the mouse retina. J Physiol. 2005;562:915–923. doi: 10.1113/jphysiol.2004.076695. [DOI] [PMC free article] [PubMed] [Google Scholar]
- Yang G, Masland RH. Receptive fields and dendritic structure of directionally selective retinal ganglion cells. J Neurosci. 1994;14:5267–5280. doi: 10.1523/JNEUROSCI.14-09-05267.1994. [DOI] [PMC free article] [PubMed] [Google Scholar]
- Yonehara K, Shintani T, Suzuki R, Sakuta H, Takeuchi Y, Nakamura-Yonehara K, Noda M. Expression of SPIG1 reveals development of a retinal ganglion cell subtype projecting to the medial terminal nucleus in the mouse. PLoS One. 2008;3:e1533. doi: 10.1371/journal.pone.0001533. [DOI] [PMC free article] [PubMed] [Google Scholar]
- Yonehara K, Ishikane H, Sakuta H, Shintani T, Nakamura-Yonehara K, Kamiji NL, Usui S, Noda M. Identification of retinal ganglion cells and their Projections involved in central transmission of information about upward and downward image motion. PLoS One. 2009;4:e4320. doi: 10.1371/journal.pone.0004320. [DOI] [PMC free article] [PubMed] [Google Scholar]
- Youngstrom TG, Weiss ML, Nunez AA. Retinofugal projections to the hypothalamus, anterior thalamus and basal forebrain in hamsters. Brain Res Bull. 1991;26:403–411. doi: 10.1016/0361-9230(91)90014-b. [DOI] [PubMed] [Google Scholar]