Abstract
Ion mobility spectrometry (IMS), and particularly differential or field asymmetric waveform IMS (FAIMS), was recently shown capable of separating post-translationally modified peptides with variant PTM localization. However, that work was limited to a model peptide with Ser phosphorylation on fairly distant alternative sites. Here, we demonstrate that FAIMS (coupled to ESI/MS) can broadly baseline-resolve variant phosphopeptides from a biologically modified human protein, including those involving phosphorylation of different residues and adjacent sites that challenge existing MS/MS methods most. Singly and doubly phosphorylated variants can be resolved equally well and identified without dissociation, based on accurate separation properties. The spectra change little over a range of infusion solvent pH, hence the present approach should be viable in conjunction with chromatographic separations using mobile phase gradients.
Introduction
A singular challenge for proteomics is characterizing the full complement and function of post-translational modifications (PTMs) in global analyses.1–4 Some reasons are biological, such as lack of connection to genomes that guide analyses of unmodified peptides and substoichiometric modifications testing the limitations of sensitivity and dynamic range.4 Other factors are methodological: (i) inhibition of proteolytic digestion near many modification sites,5 (ii) lower protonation yield in positive-mode ESI for peptides with acidic PTMs, especially when multiply modified;5,6 (iii) lesser suitability of collision-induced dissociation (CID) for characterization of weakly-bound PTMs (that are often lost from intact backbone) than for peptide sequencing;2,7 and (iv) isomerization of activated peptides prior to dissociation, which complicates identification of PTMs and may shift them along the backbone, obstructing the elucidation of attachment site (localization).8,9 Aspects (iii) and (iv) can be overcome using electron capture or transfer dissociation (EC/TD) - a direct process that avoids cleaving PTMs off the peptide or moving them around.10,11 However, the sensitivity of EC/TD is limited by inefficiency and indiscriminate fragment partitioning into numerous channels. While the reasons for low yield of informative (PTM-retaining) fragments from modified peptides in CID and ETD differ, the detection limits relative to the parent are typically worse by ~100 times in either case.
For these reasons, PTMs are often assigned to a region of the protein instead of a specific residue.12 This is a problem as different localization variants (regioisomers) may have different biological activity and coexist in cells.11,13–15 Localizing a PTM is particularly difficult when more than two variants are or may be present,13,14,16 as at least one produces no unique fragments in either CID or EC/TD. Indeed, a mixture of X1mZX2ZX3ZX4, X1ZX2mZX3ZX4, and X1ZX2ZX3mZX4 (where X1-4 and Z are arbitrary amino acids and m is a modification of Z) produces unique-mass fragments for the 1st and 3rd, but not the 2nd peptide.17 For doubly modified species, X1mZX2ZX3mZX4 shares all fragment masses with a mixture of X1mZX2mZX3ZX4 and X1ZX2mZX3mZX4. In principle, such sequence isomer fragments can be disentangled12,17 by MS3. However, usually EC/TD (which is more suitable for PTM localization than CID as the link to PTM is retained)2,7 is precluded by the charge reduction in 1st dissociation step, and the signal loss of another two orders of magnitude upon the 2nd step (either CID or EC/TD) is prohibitive anyway. This situation is not rare. For example, with respect to phosphorylation (perhaps the most important and extensively studied PTM), up to ~13% of modified peptides contain three or more phosphates,2,18 and many more have at least three possible addition sites. While MS analyses of mixtures are often simplified by prior separations, localization variants tend to co-elute in reverse-phase liquid chromatography (RPLC) or capillary zone electrophoresis (CZE), especially for multiply modified peptides.15,19–21 A version of normal-phase LC called hydrophilic interaction LC (HILIC) that uses a hydroxyl or amino-based stationary phase performs better, and singly and multiply phosphorylated peptide isomers can be separated using optimum stationary and mobile phases.20 Still, some isomers co-eluted under any conditions tried, while others (especially multiply phosphorylated ones) failed to elute.20 Also, large variation of LC elution times impedes the assignment based on those values, while long gradients inherent to LC or CZE with sufficient peak capacity limit one to ~10 analyses per day.
The specificity and throughput constraints of LC have focused interest on the ion mobility separations (IMS) in gases. These post-ionization methods include conventional IMS based on the absolute mobility (K) and differential or field asymmetric waveform IMS (FAIMS) that exploits the increment of K depending on the electric field strength (E). Localization variants of phosphopeptides were recently distinguished by FAIMS,17 and baseline-separated using a high-resolution FAIMS device with planar gap in He/N2 mixtures.22,23 Higher He fractions and peak amplitudes of the separation field (“dispersion field”, ED) increase the FAIMS resolving power,24,25 but the electrical breakdown threshold in He/N2 drops at higher He content.26 Thus one has to balance the He fraction vs. ED or the corresponding voltage across the gap (the “dispersion voltage”, DV), and we operated using 75% He and DV = 4 kV or 50% He and DV = 5.4 kV.24,25 These two regimes provide similar resolving power, but the specific features differ somewhat (largely because the field heating and ensuing unfolding of peptides are greater in the latter) and particular variants may be better separated in either.22
Previous work has been limited to the 2+ and 3+ ions of APLSFRGSLPKSYVK peptide,22,23 phosphorylated at one or two serines (S) and ESI solvent with pH 3. Hence, several key issues remained. First, while in eukaryotes ~85% of all phosphate groups are on S, they also add to threonine (T), tyrosine (Y), or (in prokaryotes) other residues.2,18 Non-serine phosphorylations have distinct and crucial biological roles. Second, the serines in above peptide are four residues apart. The maximum number of distinct fragments (fragment pairs) in either CID or EC/TD spectra of two variants equals the count of residues by which a PTM is shifted between the two,17 therefore the variants with adjacent alternatively modified sites are typically the toughest to distinguish.12 Third, the variants were overall better separated for the charge state (z) of 3 than 2 (as one may expect from the higher resolving power for z = 3).23–25 Then the separation may be better yet for z of 4 or greater. Fourth, the composition of solvent infused to ESI depends on the sample preparation protocol and normally varies during the LC gradient. Conformations of proteins in solution are sensitive to the nature and particularly acidity of the solvent, and the ESI process may possess a memory as evidenced by IMS and FAIMS data.27–30 The effect of solution on the geometries of pertinent peptide ions is critical to the separation or identification of localization variants using IMS approaches. Finally, APLSFRGSLPKSYVK is a model peptide of no biological significance.
Here, we explore FAIMS separation of variants (a) involving non-Ser phosphorylation, (b) with adjacent or closely spaced alternatively modified sites, (c) assuming z up to 4, (d) generated from solutions of variable acidity, and (e) from a real, biologically modified protein - the longest splicing form of human tau (τ) expressed in the brain with 441 residues.20,31 This protein has four regions with variant phosphorylation potentially relevant to the Alzheimer’s disease: 194 – 211, 210 – 224, 226 – 240, and 386 – 406, each featuring three or four modification sites.20 We focused on the τ226 – 240 (VAVVRT231PPKS235PS237S238AK) believed important for the aggregation of tau paired helical filaments (PHF) in Alzheimer’s disease because of hyper-phosphorylation of T231 and S235 and its influence on the cis/trans ratio of adjacent prolyl bonds and thereby on the conformations of tau and shorter peptides.32 Docking of Pin1 (a prolyl isomerase enzyme) to this region specifically isomerizes prolyl bonds32,33 and restores the binding of PHF-tau to microtubules.34 This region comprises T and three S that may be phosphorylated in vivo, of which two are adjacent. The results showcase broad utility of FAIMS for phosphopeptide analyses.
Experimental methods
We used the FAIMS/MS platform comprising a high-resolution FAIMS unit and modified LTQ ion trap mass spectrometer (Thermo Fisher).24,25 The He/N2 gas was supplied at the standard 2 L/min, leading to the ion residence time of 0.2 s. The He fraction was up to 50% or 75%, with the maximum DV selected as stated above. The peptides or their mixtures were dissolved to ~5 μM in our previously adopted22–25 common ESI infusion solvent A (50/49/1 water/methanol/acetic acid, computed pH 2.9) or more acidic solvent B (48/48/4 water/ methanol/formic acid, pH 1.9). The sample was infused to ESI emitter at the flow of 0.1 – 0.6 μL/min, adjusted for best signal intensity and stability. In line with the ESI fundamentals, the optimum rates were lower for B than the less electrically conductive A.
Here we investigate four mono- and three bis- phosphorylated peptides with the τ226 - 240 sequence: pT231 (1), pS235 (2), pS237 (3), pS238 (4) with the monoisotopic mass (m) of 1602.9 Da and pT231pS235 (5), pT231pS237 (6), and pT231pS238 (7) with m = 1682.8 Da. The peptides were synthesized on solid phase and purified to homogeneity by RPLC,20,35 with purity confirmed by CZE.21 The peptides were first screened one at a time with the peptide Syntide 2 (St) of similar (but not overlapping) m = 1508 Da as the internal calibrant.22,23 The raw FAIMS spectra were checked for quality and horizontally scaled to align the major peak(s) for St ions of same charge state as the target species.22 The findings were verified by analyses of binary isomeric mixtures.
The features in FAIMS spectra are labeled by the number 1 – 7 for the peptide preceded by a letter identifying the peak in the order of increasing charge state and EC. For example, c6 means the third peak for peptide 6. The apparent charge-reduction products are denoted by an apostrophe added to the precursor, i.e., the proton stripping from j1 produces j1'.
Results and discussion
We have started analyses from monophosphorylated peptides, using solvent A and DV = 4 kV. The variant 1 yields protonated ions of z = 2, 3, and (in low intensity) 4. As anticipated,22–25 the FAIMS spectral features for all z narrow and shift to higher EC values with increasing He content (Fig. 1). For z = 2, there is a single major peak b1 with a secondary a1 at lower EC splitting from it above ~30% He and subdividing into three features by 70% He. All features for 3+ ions lie at higher EC than those for 2+ ions, more so at greater He fractions. There are two major peaks in N2: g1 with high EC and c1 with low EC. As He is added up to 40%, g1 is attenuated relative to c1, with three resolved minor features d1, e1, f1 emerging in-between and one h1 at yet higher EC. Upon further He addition, the peaks vanish in the order of decreasing EC: first h1 and g1 at 50% He, then f1 at 60% He, and finally e1 at 70% He. These patterns are typical for unmodified or modified peptides,22–25,36 and indicate unfolding that increases for greater z (because ions generally get more mobile and thus heated stronger in a field, while Coulomb repulsion between the charged sites reduces the barriers to unfolding) and in He-rich gases (because of stronger field heating).24 For z = 4 (Fig. 1), we found a small feature j1. In all compositions, this peak coincides with the peak j1' for z = 3 that becomes dominant at 40% He. Hence j1' likely originates from j1 charge-reduced after FAIMS stage.36 At the near-maximum He fraction of 70%, the resolving power values are ~60 for z = 2 and ~150 for z = 3 or 4, matching the metrics24 for Syntide 2.
Fig. 1.
Normalized FAIMS spectra measured for the 2+, 3+, and 4+ ions of 1 from solvent A, using DV = 4 kV and He fractions of 0 – 70% (v/v) as marked. The peak widths (fwhm, V/cm) with the resolving power values underneath are given for the major well-shaped peaks. Features mentioned in the text are labeled.
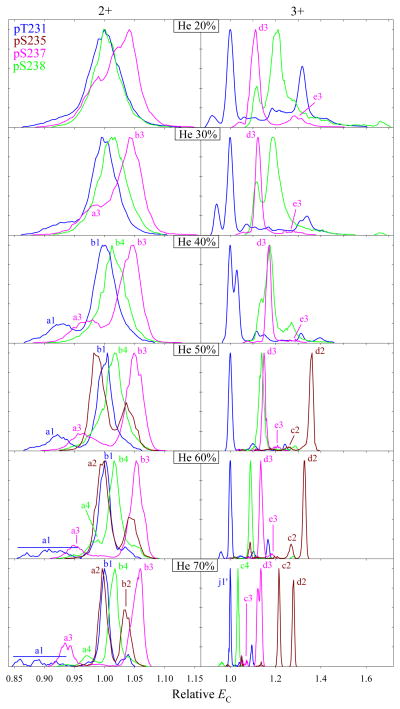
For the variants 2, 3, and 4, the yield of 4+ ions at all He fractions was, if any, too low for FAIMS analysis. The spectra of 2+ and 3+ ions evolve as a function of He percentage similarly to those for 1 overall, but the features (for z = 3) lie apart already at 20% He (Fig. 2). Increasing the He fraction generally improves the variant separation in either charge state, and at 70% He the major peaks of all four variants in z = 3 (j1', c2 or d2, d3, and c4) are resolved baseline, with each filtered from others to at least ~99%. The separation for 2+ ions is worse, but each variant was still filtered to ~80% or more at a major peak (b1, a2 or b2, b3, and b4) except 1 from 2, and 1 was fully separated from others using one of the a1 features. For either charge state, this performance exceeds that for model peptides.22 The peak order is independent of the gas composition, except the major peaks of 3 and 4 with z = 3 switch at ~40% He (Fig. 2). By comparison with the peaks for 1 and 2, that is caused by 4 moving to relatively lower EC upon He addition, possibly because of heat-induced unfolding. For APLS1FRGS2LPKS3YVK, the 3+ ions of pS1 and pS3 variants also inverted order depending on the He fraction or DV (supposedly as pS3 unfolded), but no variants with z = 2 did.22 This trend likely reflects that 3+ ions tend to be heated stronger and unfold easier, as described above. The spectra for some variants include a minor feature coincident with the major peak for another variant. Such features may be due to imperfections of peptide synthesis, hence different variants may actually be separated even cleaner than seen in the figures throughout the paper.
Fig. 2.
Normalized spectra for the 2+ and 3+ ions of variants 1 – 4 from solvent A, using DV = 4 kV and 20 – 70% He as marked (50 – 70% He for 2). The EC axes are linearly scaled such that the base peaks of 1 (in either charge state) have EC = 1. Features mentioned in the text are labeled.
A conserved EC order for different variants across charge states would have implied that the conformational changes due to PTM moved along the backbone were not grossly influenced by the peptide charging scheme. That is not the case, e.g., the order of major peaks at 70% He is {1 and 2, 4, 3} for z = 2 but {1, 4, 3, 2} for z = 3 (Fig. 2). This may look as perfect correlation except for the element 2, but 10 out of 24 possible four-digit sequences exhibit this property. Even without 2, the order at <40% He changes to {1, 3, 4} for 3+ but not 2+ ions. Similarly for APLS1FRGS2LPKS3YVK, the EC order at DV = 4 kV and 0 – 60% He was {pS3, pS1, pS2} for z = 2 but {pS1, pS3, pS2} for z = 3.22 We conclude that the conformational differences between localization variants broadly depend on the protonated sites. This enables optimizing the separation selectivity by switching between different charge states.
As seen in the {1, 4, 3, 2} sequence, the separation distance between variants is unrelated to the PTM shift along the backbone. Moreover, 3 and 4 that are modified at neighboring sites are separated (as 2+ or 3+ ions) as well or better than some other pairs involving greater PTM shifts, including 1 and 4 with the maximum seven-residue shift. For APLS1FRGS2LPKS3YVK, the features for pS1 and pS2 or pS2 and pS2 variants with four-residue shifts also lied further apart than those for pS1 and pS3 with an eight-residue shift.22 Hence, FAIMS can separate the variants with adjacent or nearby alternatively modified sites as well as those with distant sites.
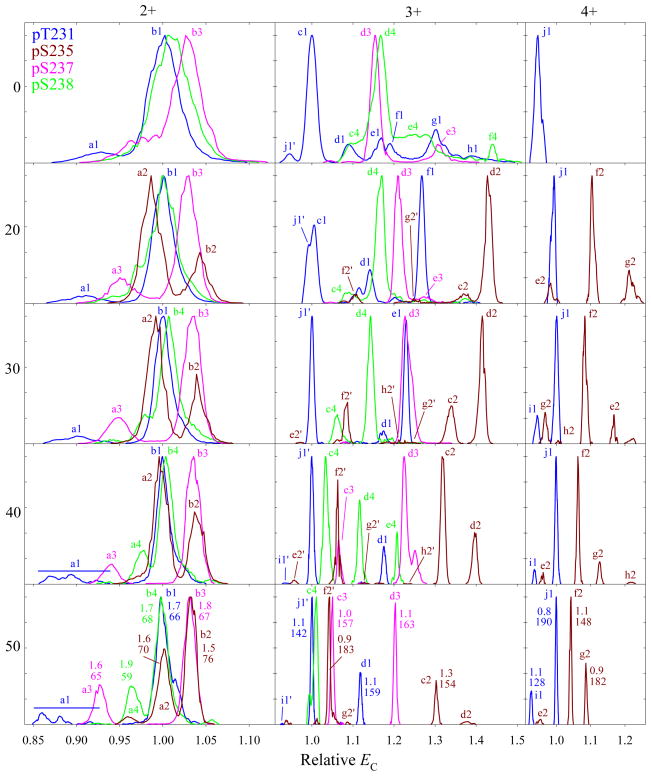
In preceding work,22,25 the FAIMS separations of peptides at DV = 5.4 kV overall tracked those at 4 kV with He fractions transposed by ~30% up, e.g., the spectra at 5.4 kV and 20% He resembled those at 4 kV and 50% He. Here (Fig. 3), this pattern is seen for 3+ ions in: (i) the major peak d3 splitting and c3 feature at lower EC growing at 40% He (vs. 70% in Fig. 2), (ii) the major peak of 4 and d3 inverting order between 0 and 20% He (vs. 40% in Fig. 2), and (iii) the relative intensities of c2 and d2 evolving over the 20 – 40% He range (vs. 50 – 70% in Fig. 2). Likewise for 2+ ions: (i) the major peaks b3 and b4 split features at lower EC (a3 and a4) between 0 and 20% He (vs. 40% in Fig. 2) for 3 and at 30 – 40% He (vs. 60 – 70 % in Fig. 2) for 4, and (ii) the three-topped feature a1 appears at 40% He (vs. 70% in Fig. 2). As always, there also are differences such as, for 3+ ions: (i) at some He fractions, much more intense and even dominant high-EC features f1 and e1 and low-EC feature f2', and (ii) two or three intense features for 4 (c4, d4, e4) at 30 or 40% He (vs. one significant peak in Fig. 2 at 50 – 70% He). Some of the new or enhanced features (e.g., f2') are likely derived from 4+ ions that are much more prominent at DV = 5.4 kV (below). The resolving power values at 50% He are ~70 for z = 2 and ~140 – 190 for z = 3 (Fig. 3), or slightly above the maxima using DV = 4 kV. This in agreement with the evaluation for unmodified peptides.25 However, the separation is not necessarily improved: for 3+ ions, 4 is resolved from 1 (i.e., c4 from j1') only partly (vs. fully in Fig. 2) and, for 2+ ions, the major peaks of 2 and 3 (b2 and b3) and of 1 and 4 (b1 and b4) coincide in Fig. 3 but not Fig. 2. Some variants are separated better at lower He fractions, e.g., c4 and j1' are baseline-resolved at 40% He (Fig. 3). This situation is parallel to chromatography, where targeted analyses may be affected by the retention factor (controlled by the choice of stationary and mobile phases) more than by the peak capacity or peak width.
Fig. 3.
Same as Fig. 2 for the 2+, 3+, and 4+ ions, using DV = 5.4 kV and 0 – 50% He (20 – 50% He for 2). The peak widths (V/cm) with R values underneath are given for the major well-shaped peaks at 50% He.
Raising DV to 5.4 kV has increased the signal for 4+ ions, enough to obtain the spectra for 2 (though not 3 or 4). The peaks for 1 and 2 are easily resolved (Fig. 3), showing that FAIMS can also separate the peptide variants with z = 4. As seen for 1 in Fig. 1, here some (but not all) features for 3+ ions of 1 and 2 track their peaks for 4+ ions at any He fraction, and thus are likely the products of post-FAIMS charge reduction. The intensity gain for z = 4 at higher DV may be due to the stronger field heating in FAIMS that prevents peptide refolding from unfolded states. The species 1 - 4 have four sites with high proton affinity (the N-terminal amino group, R230, K234, and K240) and the phosphate groups as only acidic sites, which would mainly produce 4+ ions in the ESI process. However, a protonated site may form a salt bridge with a negatively charged (deprotonated) phosphate group, leading to the maximum z = 3. (These32 and similar37,38 peptides form zwitterions in solution and/or the gas phase.) When unfolding precludes a salt bridge, the proton on the phosphate and the 4+ state are retained.
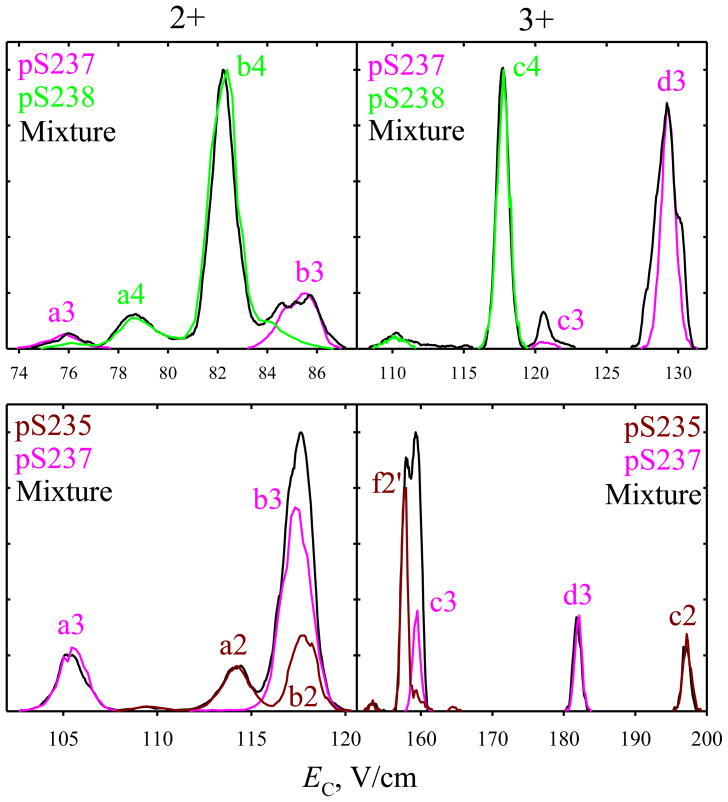
In chromatography or electrophoresis, the peptides ostensibly resolved when run one-by-one occasionally co-elute when loaded as a mixture, presumably because of intermolecular interactions. This should not occur in the gas phase, and separations using both DV values have been confirmed by analyses of binary mixtures of variants in 1:1 ratio and, in some cases, other ratios. All spectral features for mixtures closely match those measured for the components, and thus are readily attributable (Fig. 4). This does not happen without calibration, therefore these results validate the present calibration protocol.
Fig. 4.
Spectra for selected two variants and their 1:1 mixtures from solvent A, using DV = 4 kV and 73% He (top panels) and DV = 5.4 kV and 50% He (bottom panels). The signal intensity for one variant was scaled to match the heights of corresponding peaks in the mixture. (The relative peak heights often deviate from those defined by the sample composition, presumably because of (i) different ionization efficiencies for the two variants and competitive ionization and (ii) unequal transmission efficiencies through the FAIMS unit because of differing absolute mobility and thus diffusion coefficient.) The results for other binary mixtures were similar.
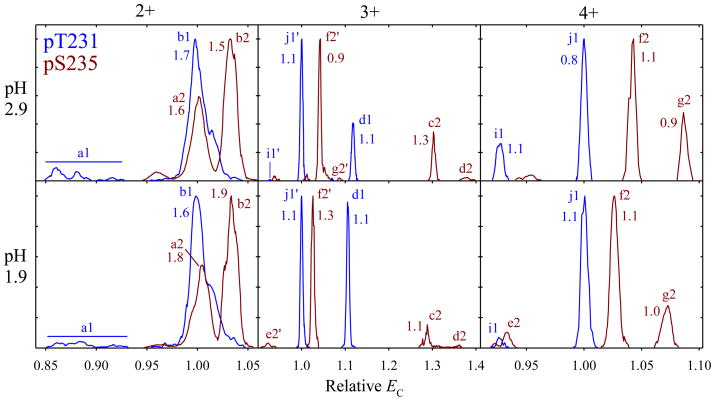
To gauge the sensitivity of separation to the solution composition, we have re-acquired the data for 1 and 2 with the more acidic solvent B using same He fractions and DVs. The results for both variants are close to those measured using the solvent A under all conditions tried, although some peaks slightly shift (Fig. 5). The comparisons at DV = 4 kV and/or other He fractions are similar. This follows the consensus that the solution conditions strongly affect gas-phase conformations for proteins but much less so (if at all) for peptides. Hence the spectra for particular variants are transferable across at least a finite range of solution pH, such as found in RPLC mobile phase gradients. This should permit using FAIMS to fingerprint known localization variants in LC/FAIMS/MS analyses that are explored for broad proteomic applications.39–41
Fig. 5.
Normalized spectra for the 2+, 3+, and 4+ ions of variants 1 and 2 from solvent A (top panels) and B (bottom panels), using DV = 5.4 kV and 50% He. The peak widths (V/cm) are given for the major well-shaped peaks.
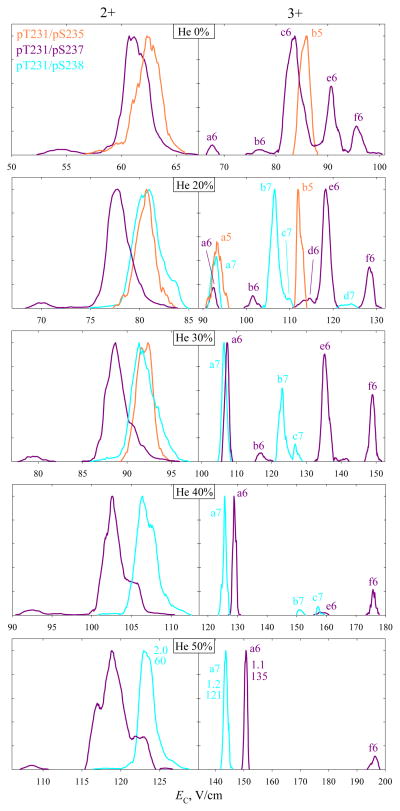
As we have reviewed, multiply modified peptides naturally challenge MS/MS methods. The bisphosphorylated (pS1pS2 and pS1pS3) variants of APLS1FRGS2LPKS3YVK with z = 2 or 3 were separated by FAIMS, but with greater effort than the monophosphorylated analogs.20 Whether (and, if so, why) that trend would be general was unclear. The bisphosphorylated variants here {5, 6, 7} produce significant signal for 2+ or 3+ ions only. Whereas the intensities of either were fairly uniform for variants 1 – 4, those for 5 were much below those for 6 or 7. With solvent A, the prevailing products for 5 – 7 were 2+ rather than the 3+ ions that tend to allow superior variant separation. The yield of 3+ ions greatly improves with solvent B, which we employed for most analyses of 5 – 7. As with 1 and 2 (Fig. 5), the FAIMS spectra for same species from solvents A and B were similar. The trends for 5 – 7 with increasing He content follow the recognized pattern, as seen for DV = 5.4 kV in Fig. 6: (i) all peaks narrow and move to higher EC, and (ii, for 3+ ions) new features emerge and grow at relatively lower EC values, while those at higher EC decrease and vanish, as seen in the transitions from b5 to a5, from (b6, c6, d6, e6, f6) to a6, and from d7 to (b7, c7) and then to a7.
Fig. 6.
Normalized spectra for the 2+ and 3+ ions of variants 5 - 7 from solvent B, using DV = 5.4 kV and 0 – 50% He as marked (20 – 50% He for 7). Features mentioned in the text are labeled. The peak widths (V/cm) with R values underneath are given for the major well-shaped peaks at 50% He. Separations were validated by analyses of binary mixtures.
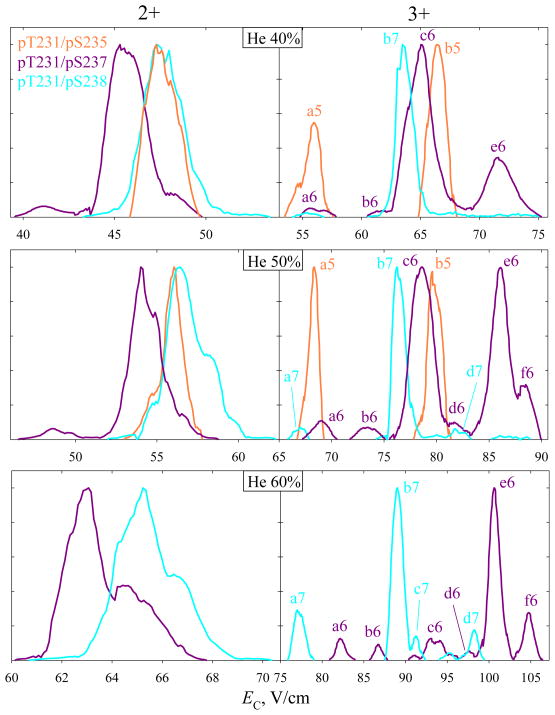
For z = 3, the peak widths compare to those for 1 – 4 with same DV and He fractions (Fig. 3), but the EC and thus resolving power values are somewhat lower. Still, the major peaks for 6 and 7 with alternative modification of adjacent sites (pS237 and pS238) are, again, baseline-resolved at 20 – 50% He. This outcome is similar to or slightly better than that for monophosphorylated variants with z = 3, some of which were not fully resolved at <40% He (Fig. 3). The separation for 2+ ions also improves with increasing He content, and 6 and 7, though not resolved baseline, are fully filtered from each other at or near the peak apexes (Fig. 6). This is likewise similar to or better than the separation for monophosphorylated analogs with z = 2 (Fig. 3). The signal intensities for all variants drop at higher He content as usual, but those for 5 (with z = 2 or 3) are much lower already in N2 and merge into the noise above ~20 – 30% He (Fig. 6). However, 5 (in the major peak b5 for 3+ ions) can be filtered from the other two variants to ~97% already at 20% He. Again, the variant separation in FAIMS is unrelated to the distance between alternatively modified sites along the backbone: for either 2+ or 3+ ions, the major peaks for 6 and 7 (e6 or f6 and b7 for z = 3) lie further apart than those for 5 and 7 with a three-residue distance (Fig. 6, at 20% He).
At the lower DV = 4 kV (Fig. 7), the signal for 5 in either charge state survives up to 50% He. For z = 2, the separations of all three variants are identical to those in Fig. 6. For 3+ ions, b5 is not resolved from c6 now, but the feature a5 emerges at lower He fractions than a6 and a7, and 5 can be filtered from the other two variants to >90% (Fig. 7). The major peaks of 6 and 7 can still be separated baseline (e6 and b7 at 60% He).
Fig. 7.
Same as Fig. 6, using DV = 4 kV and 40 – 60% He as marked.
Under some conditions, most variants exhibit several peaks (often two major ones) for either 2+ or 3+ ions. In the studied sequence, T231 and S235 are followed by prolines. Steric crowding hinders rotation around that bond, creating cis- and trans- isomers that at ambient temperature may interconvert slowly and, in some cases, be separated by RPLC.32 As we reviewed, phosphorylation at T231 and/or S235 (in 1, 2, 5, 6, and 7) may change the cis/trans ratio with biomedical consequences. Whether the presently observed multiple peaks are related to those cis- and trans- configurations remains to be determined.
Conclusions
We have employed differential ion mobility spectrometry (FAIMS) in He/N2 mixtures to analyze the localization isomers of a biomedically relevant variably modified sequence of human tau-protein, τ226 - 240 that contains one T and three S phosphorylation sites. As expected, resolution broadly improves with increasing He fraction up to the electrical breakdown limit. All four monophosphorylated and three bisphosphorylated variants can be fully filtered within “standard” 0.2 s residence time, including both pairs with alternatively modified adjacent sites (pS237 and pS238) that are most challenging to distinguish by tandem MS and co-elute even in extensively optimized chromatography.20 Unlike with the model peptides,22 the bisphosphorylated variants are resolved as well as monophosphorylated ones, if not better. The variants involving T and S modification are distinguished equally well.
The resolution of pairs with alternative S237 and S238 phosphorylations (for 3+ ions, based on fwhm) is 6. In fact, these pairs are separated better than some with greater PTM shifts by up to seven residues, i.e., the variant resolution is uncorrelated with that shift. The variant separation is generally better for 3+ and 4+ than 2+ ions, reflecting higher FAIMS resolving power and peak capacity achieved for the former.22–25 This is in line with the results22 for model peptides regarding the 2+ and 3+ ions (no 4+ ions were previously examined in this context). The separations in different charge states are largely orthogonal, presumably as the peptide conformations strongly depend on the charging scheme. Broadly, the peak capacities for variant separation, calculated as the width of EC range spanned by observed monophosphorylated variants (at 50% He and DV = 5.4 kV) divided by the mean peak width, are 13 for 2+ ions, 63 for 3+ ions, and 25 for 4+ ions, for the total of 100. To account for the average number of major peaks per variant, these values should be adjusted down by a factor of ~2, to ~50 for the total. The number of conceivable, leave alone biologically relevant, variants for virtually all proteolytic peptides is substantially below that estimate (which is an underestimate for more complex cases as increasing the number of variants statistically expands the covered separation space). Hence FAIMS has spare resolving power to generally filter the phosphopeptide localization variants in 0.2 s and, if necessary, the resolution and peak capacity can be improved by ~50 – 100% using extended residence times of ~0.4 – 0.8 s.23
Reproducible peak positions for unique features allow identifying the variants by that position using standards. The spectra are only weakly dependent of solution pH over at least some range, enabling such identification despite variations in the sample preparation procedure or over an LC mobile phase gradient. One can also assign the variants separated by IMS a priori via CID and/or EC/TD, although at a major sensitivity cost.17,42 Present findings suggest broad utility of FAIMS/MS and potentially LC/FAIMS/MS for separation and identification of the localization variants of phosphopeptides from alternatively modified proteins.
Acknowledgments
We thank Ron Moore and Heather Brewer for experimental help, and Drs. Keqi Tang, Mike Belov, Yehia Ibrahim, Julia Laskin, and Helen Cooper for discussions. This research was supported by the NIH National Center for Research Resources (RR18522). Work was performed in the Environmental Molecular Sciences Laboratory, a US DoE OBER national scientific user facility at PNNL.
References
- 1.Mann M, Jensen ON. Nat Biotechnol. 2003;21:255–261. doi: 10.1038/nbt0303-255. [DOI] [PubMed] [Google Scholar]
- 2.Molina H, Horn DM, Tang N, Mathivanan S, Pandey A. Proc Natl Acad Sci USA. 2007;104:2199–2204. doi: 10.1073/pnas.0611217104. [DOI] [PMC free article] [PubMed] [Google Scholar]
- 3.Gupta N, Tanner S, Jaitly N, Adkins JN, Lipton M, Edwards R, Romine M, Osterman A, Bafna V, Smith RD, Pevzner PA. Genome Res. 2007;17:1362–1377. doi: 10.1101/gr.6427907. [DOI] [PMC free article] [PubMed] [Google Scholar]
- 4.Savitski MM, Nielsen ML, Zubarev RA. Moll Cell Proteomics. 2006;5:935–948. doi: 10.1074/mcp.T500034-MCP200. [DOI] [PubMed] [Google Scholar]
- 5.Kim S, Choi H, Park ZY. Mol Cells. 2007;23:340–348. [PubMed] [Google Scholar]
- 6.Kyono Y, Sugiyama N, Tomita M, Ishihama Y. Rapid Commun Mass Spectrom. 2010;24:2277–2282. doi: 10.1002/rcm.4627. [DOI] [PubMed] [Google Scholar]
- 7.Sweet SMM, Bailey CM, Cunningham DL, Heath JK, Cooper HJ. Mol Cell Proteomics. 2009;8:904–912. doi: 10.1074/mcp.M800451-MCP200. [DOI] [PMC free article] [PubMed] [Google Scholar]
- 8.Palumbo A, Reid GE. Anal Chem. 2008;80:9735–9743. doi: 10.1021/ac801768s. [DOI] [PubMed] [Google Scholar]
- 9.Edelson-Averbukh M, Shevchenko A, Pipkorn R, Lehmann WD. Anal Chem. 2009;81:4369–4381. doi: 10.1021/ac900244e. [DOI] [PubMed] [Google Scholar]
- 10.Swaney DL, McAlister GC, Wirtala M, Schwartz JC, Syka JEP, Coon JJ. Anal Chem. 2007;79:477–485. doi: 10.1021/ac061457f. [DOI] [PMC free article] [PubMed] [Google Scholar]
- 11.Chi A, Huttenhower C, Geer LY, Coon JJ, Syka JEP, Bai DL, Shabanowitz J, Burke DJ, Troyanskaya OG, Hunt DF. Proc Natl Acad Sci USA. 2007;104:2193–2198. doi: 10.1073/pnas.0607084104. [DOI] [PMC free article] [PubMed] [Google Scholar]
- 12.Boersema PJ, Mohammed S, Heck AJR. J Mass Spectrom. 2009;44:861–878. doi: 10.1002/jms.1599. [DOI] [PubMed] [Google Scholar]
- 13.Sweet SMM, Mardakheh FK, Ryan KJP, Langton AJ, Heath JK, Cooper HJ. Anal Chem. 2008;80:6650–6657. doi: 10.1021/ac800963a. [DOI] [PubMed] [Google Scholar]
- 14.Cunningham DL, Sweet SMM, Cooper HJ, Heath JK. J Prot Res. 2010;9:2317–2328. doi: 10.1021/pr9010475. [DOI] [PMC free article] [PubMed] [Google Scholar]
- 15.Langlais P, Mandarino LJ, Yi Z. J Am Soc Mass Spectrom. 2010;21:1490–1499. doi: 10.1016/j.jasms.2010.05.009. [DOI] [PMC free article] [PubMed] [Google Scholar]
- 16.Woodling KA, Eyler JR, Tsybin YO, Nilsson CL, Marshall AG, Edison AS, Al-Naggar IM, Bubb MR. J Am Soc Mass Spectrom. 2007;18:2137–2145. doi: 10.1016/j.jasms.2007.09.010. [DOI] [PubMed] [Google Scholar]
- 17.Xuan Y, Creese AJ, Horner JA, Cooper HJ. Rapid Commun Mass Spectrom. 2009;23:1963–1969. doi: 10.1002/rcm.4101. [DOI] [PubMed] [Google Scholar]
- 18.Olsen JV, Blagoev B, Gnad F, Macek B, Kumar C, Mortensen P, Mann M. Cell. 2006;127:635–648. doi: 10.1016/j.cell.2006.09.026. [DOI] [PubMed] [Google Scholar]
- 19.Hoffmann R, Segal M, Otvos L. Anal Chim Acta. 1997;352:327–333. [Google Scholar]
- 20.Singer D, Kuhlmann J, Muschket M, Hoffman R. Anal Chem. 2010;82:6409–6414. doi: 10.1021/ac100473k. [DOI] [PubMed] [Google Scholar]
- 21.Muetzelburg MV, Hoffmann R. Electrophoresis. 2008;29:4381–4385. doi: 10.1002/elps.200800089. [DOI] [PubMed] [Google Scholar]
- 22.Shvartsburg AA, Creese AJ, Smith RD, Cooper HJ. Anal Chem. 2010;82:8327–8334. doi: 10.1021/ac101878a. [DOI] [PMC free article] [PubMed] [Google Scholar]
- 23.Shvartsburg AA, Smith RD. Anal Chem. 2011;83:23–29. doi: 10.1021/ac202386w. [DOI] [PMC free article] [PubMed] [Google Scholar]
- 24.Shvartsburg AA, Danielson WF, Smith RD. Anal Chem. 2010;82:2456–2462. doi: 10.1021/ac902852a. [DOI] [PMC free article] [PubMed] [Google Scholar]
- 25.Shvartsburg AA, Prior DC, Tang K, Smith RD. Anal Chem. 2010;82:7649–7655. doi: 10.1021/ac101413k. [DOI] [PMC free article] [PubMed] [Google Scholar]
- 26.Meek JM, Craggs JD. Electrical Breakdown of Gases. Wiley; NY: 1978. [Google Scholar]
- 27.Hudgins RR, Woenckhaus J, Jarrold MF. Int J Mass Spectrom Ion Processes. 1997;165/166:497–507. [Google Scholar]
- 28.Li J, Taraszka JA, Counterman AE, Clemmer DE. Int J Mass Spectrom. 1999;185/186/187:37–47. [Google Scholar]
- 29.Guevremont R. J Chromatogr A. 2004;1058:3–19. [PubMed] [Google Scholar]
- 30.Shvartsburg AA, Bryskiewicz T, Purves RW, Tang K, Guevremont R, Smith RD. J Phys Chem B. 2006;110:21966–21980. doi: 10.1021/jp062573p. [DOI] [PubMed] [Google Scholar]
- 31.Hanisch K, Soininen H, Alafuzoff I, Hoffmann R. J Proteome Res. 2010;9:1476–1482. doi: 10.1021/pr901002t. [DOI] [PubMed] [Google Scholar]
- 32.Daly NL, Hoffmann R, Otvos L, Craik DJ. Biochem. 2000;39:9039–9046. doi: 10.1021/bi0004807. [DOI] [PubMed] [Google Scholar]
- 33.Schutkowski M, Bernhardt A, Zhou XZ, Shen M, Reimer U, Rahfeld JU, Lu KP, Fischer G. Biochem. 1998;37:5566–5575. doi: 10.1021/bi973060z. [DOI] [PubMed] [Google Scholar]
- 34.Lu PJ, Wulf G, Zhou XZ, Davies P, Lu KP. Nature. 1999;399:784–788. doi: 10.1038/21650. [DOI] [PubMed] [Google Scholar]
- 35.Singer D, Lehmann J, Hanisch K, Hartig W, Hoffmann R. Biochem Biophys Res Commun. 2006;346:819–828. doi: 10.1016/j.bbrc.2006.05.201. [DOI] [PubMed] [Google Scholar]
- 36.Shvartsburg AA, Tang K, Smith RD. Anal Chem. 2010;82:32–35. doi: 10.1021/ac902133n. [DOI] [PMC free article] [PubMed] [Google Scholar]
- 37.Rodriquez CF, Orlova G, Guo Y, Li X, Siu SK, Hopkinson AC, Siu KWM. J Phys Chem B. 2006;110:7528–7537. doi: 10.1021/jp046015r. [DOI] [PubMed] [Google Scholar]
- 38.Marchese R, Grandori R, Carloni P, Raugei S. PLoS Comput Biol. 2010;6:e1000775. doi: 10.1371/journal.pcbi.1000775. [DOI] [PMC free article] [PubMed] [Google Scholar]
- 39.Venne K, Bonneil E, Eng K, Thibault P. Anal Chem. 2005;77:2176–2186. doi: 10.1021/ac048410j. [DOI] [PubMed] [Google Scholar]
- 40.Canterbury JD, Yi X, Hoopmann MR, MacCoss MJ. Anal Chem. 2008;80:6888–6897. doi: 10.1021/ac8004988. [DOI] [PMC free article] [PubMed] [Google Scholar]
- 41.Saba J, Bonneil E, Pomies C, Eng K, Thibault P. J Proteome Res. 2009;8:3355–3366. doi: 10.1021/pr801106a. [DOI] [PubMed] [Google Scholar]
- 42.Ibrahim YM, Shvartsburg AA, Smith RD, Belov ME. Anal Chem. 2011 doi: 10.1021/ac200719n. [DOI] [PMC free article] [PubMed] [Google Scholar]


