

Abstract
BACKGROUND
Current surveillance guidelines for patients with long-standing ulcerative colitis (UC) recommend repeated colonoscopy with random biopsies, which is time-consuming, discomforting and expensive. A less invasive strategy is to identify neoplasia by analyzing biomarkers from the more accessible rectum to predict the need for a full colonoscopy. The goal of this pilot study is to evaluate whether optical markers of rectal mucosa derived from a novel optical technique – partial-wave spectroscopic microscopy (PWS) could identify UC patients with high-grade dysplasia (HGD) or cancer (CA) present anywhere in their colon.
METHODS
Banked frozen non-dysplastic mucosal rectal biopsies were used from 28 UC patients (15 without dysplasia and 13 with concurrent HGD or CA). The specimen slides were made using a touch prep method and underwent PWS analysis. We divided the patients into two groups: 13 as a training set and an independent 15 as a validation set.
RESULTS
We identified six optical markers, ranked by measuring the information gain with respect to the outcome of cancer. The most effective markers were selected by maximizing the cross validated training accuracy of a Naive Bayes classifier. The optimal classifier was applied to the validation data yielding 100% sensitivity and 75% specificity.
CONCLUSIONS
Our results indicate that the PWS-derived optical markers can accurately predict UC patients with HGD/CA through assessment of rectal epithelial cells. By aiming for a high sensitivity, our approach could potentially simplify the surveillance of UC patients and improve overall resource utilization by identifying patients with HGD/CA who should proceed with colonoscopy.
Keywords: Ulcerative colitis, Field effect, Spectroscopy, Optical markers
INTRODUCTION
Ulcerative colitis (UC) is a chronic inflammatory bowel disease (IBD) that predisposes the risk of developing colorectal cancer (CRC) and affects nearly half a million individuals yearly in the United States alone (1). The potentiality of developing CRC in patients with long-standing UC is high with reported range between three to 20 times that of the general population (2, 3). The risk of cancer increases with the duration of disease and how much the colon has been damaged (i.e. patients who have more extensive colorectal inflammation and a longer duration of colitis have the greatest risk) (4, 5). Similarly, the severity of colonic inflammation is also highly significant in terms of neoplasia risk (6). Current surveillance guidelines for patients with longstanding UC recommend annual to biennial colonoscopy with random biopsies taken every 10 cm of colonic mucosa beginning 8 to 10 years after the onset of disease, which is time-consuming, discomforting, expensive, and only detects a neoplastic process once it has progressed to a morphologically recognizable stage. Moreover, this approach can be problematic in the light of colon being a large organ and dysplasia can be patchy and endoscopically invisible. Consequently, current surveillance approach suffers from significant sampling errors (7). Hence, new robust and reliable diagnostic approaches are urgently desired to improve the surveillance of CRC in UC patients.
Significant advances have been made in understanding the molecular precursors of UC that lead to the development of CRC. It has been proposed that neoplastic progression in UC occurs in a stepwise manner of histological changes from negative → indefinite for dysplasia → dysplasia → cancer (8). In the case of UC, the regions of cancer (CA) or high grade dysplasia (HGD) are often surrounded by mucosa with indefinite or low-grade histology (9). Numerous molecular biomarkers have been identified associated with the presence of neoplasm in UC patients and UC neoplastic progression, especially in nonneoplastic epithelium for detection and risk stratification of CRC in UC patients (10, 11). Fluorescence in situ hybridization (FISH) analysis suggests that chromosomal instability involves essentially the entire colon when dysplasia or cancer is present (9). Salk et al. have demonstrated that the cell lineage information encoded in the genome by neutral mutant markers provides a useful tool for studying histologically invisible neoplasia processes (12). DNA fingerprinting abnormalities have been shown to distinguish UC patients with dysplasia and cancer from those who are dysplasia/cancer-free (7). Additionally, the estrogen receptor (ER) methylation level in nonneoplastic epithelium was found to be significantly higher throughout the entire colon in UC patients with neoplasia than in those without (13). These promising biomarkers demonstrate the feasibility of identifying UC patients with colonic neoplasia through the analysis of uninvolved rectum. This approach aims at selecting a sub-group of UC patients who are likely to have or develop CRC for more intensive surveillance with full colonoscopy or other advanced imaging modalities such as chromoendoscopy and confocal endoscopy.
Despite their great potential for surveillance of CRC in UC patients, the implementation of these molecular markers to routine clinical use has been challenging, in part due to the time-consuming and labor intensive nature, the special requirement for sample preparation and high cost. Alternatively, the analysis of cell nano-architectural alterations in the rectum may represent an exquisitely sensitive and simple modality to discriminate those UC patients with and without neoplasia. (14). A novel optical technique – partial-wave spectroscopic microscopy (PWS) – provides significant insights into the internal architecture of biological cells (15–18). PWS has shown great promise to detect subtle genetic and epigenetic alterations that occur in colonic carcinogenesis that precede pathological changes in colon cancer cell-lines and animal models (16).
The goal of this proof-of-concept study is to determine whether the partial-wave spectroscopic microscopy (PWS) performed on non-dysplastic rectal biopsies can identify the presence of colorectal high-grade dysplasia or cancer anywhere in the colon. We analyzed structural alterations in the nuclei of epithelial cells from histologically non-dysplastic rectum in UC patients with and without neoplasia.
MATERIALS AND METHODS
Human Specimens
Banked frozen mucosal biopsies from 15 UC patients without dysplasia (UC-Negative or UC-Neg) and 13 UC patients with concurrent HGD or CA (UC-HGD/CA) were included in this study. Tissues were collected in accordance with approved Human Subject’s Guidelines at the University of Washington and Cleveland Clinic. The specimen slides were made from non-dysplastic mucosal rectal biopsies using a touch prep method. Afterward the slides were stained following standard diff-quik staining protocol. Finally, the cells mounted on glass slide with coverslip underwent PWS analysis. We divided the patients into two groups: a group of 13 patients (7 UC-Neg and 6 UC-HGD/CA) for the specimens obtained from University of Washington as a training set and an independent group of 15 patients for the specimens obtained from Cleveland Clinic as a validation/testing set (8 UC-Neg and 7 UC-HGD/CA). The average age of the 15 UC-Neg patients (9 males and 6 females) was 40 years; the average age of the 13 UC-HGD/CA patients (9 males and 4 females) was 54 years. The known duration of disease was 14 ± 12 years (mean + SD; range, 1 to 44 years) for UC-Neg, and 16 ± 8 years (mean + SD; range, 4 to 29 years) for UC-HGD/CA. The reported distance to the neoplasia represents the distance to the closest neoplasia. Details of the patients incorporated in this study and their tested biopsy characterization including age, gender, duration of disease, most advance pathology of the patient, pathological status of tested biopsy and the presence of active inflammation in the rectum are summarized in Table 1.
TABLE 1(a).
Details of patient and tested biopsy characteristics for training set.
| Patient No. | Age (years) | Gender | Disease duration (years) | Most advanced pathology | Dysplasia grade on tested biopsy | Distance to neoplasia (cm) | Active inflmmation (in rectum) |
|---|---|---|---|---|---|---|---|
| 1 | 30 | M | 8 | negative | negative | NA | none |
| 2 | 50 | F | 32 | negative | negative | NA | none |
| 3 | 60 | M | 44 | negative | negative | NA | none |
| 4 | 36 | F | 12 | negative | negative | NA | none |
| 5 | 23 | M | 12 | negative | negative | NA | none |
| 6 | 77 | F | 24 | negative | negative | NA | none |
| 7 | 60 | F | 24 | negative | negative | NA | none |
| 8 | 58 | M | 29 | HGD | negative | ~4 | none |
| 9 | 46 | M | 26 | HGD | negative | ~7 | none |
| 10 | 48 | M | 10 | HGD | negative | ~10 | none |
| 11 | 34 | M | 17 | HGD | negative | ~22 | none |
| 12 | 31 | M | 4 | cancer | negative | ~2 | none |
| 13 | 53 | F | 22 | cancer | negative | ~25 | none |
Partial-Wave Spectroscopic Microscopy (PWS)
The detailed description of instrumentation of the partial-wave spectroscopy can be found elsewhere (15–18) so only short introduction is presented here. The specimen (i.e., cytology slide) is illuminated by white, low spatially-coherent light with a low numerical aperture (NA = 0.4) and the backscattered photons are collected to form an image. The backscattered image and backscattering spectrum (i.e., light intensity as a function of wavelength (λ)where the wavelength of light ranges from 450 to 700 nm) from each pixel were simultaneously recorded, by scanning the slit of the imaging spectrograph coupled with the charge coupled device (CCD) camera. As a result, we obtain a data cube I(λ,x,y), where (x,y) represents the spatial position of each pixel.
PWS enables the measurement of a spectral fluctuating component in the backscattering spectra. This component, referred to as the “fluctuating part of the reflection spectrum” R(k), where k is the wavenumber, arises from the interference of photons reflected from nanoscale refractive index fluctuations within a scattering medium. PWS essentially decomposes a complex three-dimensional (3D) weakly disordered medium into many spatially independent parallel one-dimensional (1D) axial channels. Although the lateral size of each channel is determined by the transverse resolution of the system, information about refractive index variations at sub-wavelength scales is embedded in R(k). Since R(k) is formed primarily by axially backscattered photons, R(k) can be analyzed by means of 1D mesoscopic light transport theory in disordered media. Mesoscopic theory enables quantification of the statistical properties of the spatial refractive index variations within a 1D scattering medium, e.g. a 1D channel within a cell, as the characteristic features of the sample under investigation.
Data Analysis
The acquired backscattered spectra from each pixel (x, y) is first normalized by the reference spectrum (backscattered spectra collected from empty clean glass slide) and then filtered to remove the high-frequency spectral noise to get the noise-filtered spectrum S(λ,x,y), by using a sixth-order low-pass Butterworth filter with a normalized cutoff frequency of 0.07. Each s(λ,x,y) is further analyzed to extract the varying component of the spectrum R(k,x,y) for each pixel within the individual cell nucleus. A 4th-order polynomial Sp(k,x,y) is used to fit S(k,x,y) and the final spectrum R(k,x,y) is obtained as R(k,x,y) = S(k,x,y) − Sp(k,x,y). Several optical markers can be derived from R(k,x,y) as described in the following section (15–18).
Optical Markers
For the quantitative analysis of the cell nuclear architecture, various optical markers are identified, including disorder strength and its standard deviation, reflection coefficient and its standard deviation, and correlation decay and its standard deviation. These variables are good indicators for the architectural changes of nuclear organization (15, 16).
Following the terminology from mesoscopic theory, the disorder strength, Ld(x,y) = <Δn2>Lc, is defined for each channel or pixel (x,y), where <Δn2> is the variance of refractive index fluctuation Δn(z) within a channel and Lc is the spatial correlation length of the refractive index fluctuation. One can determine Ld(x,y) of each pixel from two experimentally acquired quantities: R(k) and its autocorrelation function C(Δk) = <R(k) R(k + Δk)/<R2(k)> The fluctuating part of the reflection spectrum R(k) for each pixel can be approximated as , where n0 is average refractive index of the cell and L is the cell thickness. The autocorrelation function C(Δk) can be approximated as the following simplified relation: ln C(Δk)=−AL(Δk)2or ln C(Δk) ∝ − (Δk)2 where A is a constant which depends on the physical properties of the cell such as size and cell thickness (L). The disorder strength Ld that describes the statistical properties of refractive index variation (i.e., the variance and the spatial correlation length of the refractive index variations) can be calculated by eliminating L in <R(k)> and C(Δk) (15–18). The average value of fluctuating part of the reflection spectrum <R(k)> is referred to as “reflection coefficient” (R̄). The reflection coefficient is an optical marker for comprehensive quantitative characterization for physical and refractive index properties of the biological cell.
To further characterize the spectral characteristics of the backscattering spectrum, we performed the analysis of the autocorrelation function C(Δk) =< R(k) R(k+Δk)/<R2(k) > and extracted an optical marker referred to as “correlation decay” to describe any cell architectural alterations that lead to the changes of the backscattering spectral amplitude. Specifically, we calculated the autocorrelation function C(Δk) based on the unbiased convolution method. Typically, C(Δk) is a sinusoid-like function of alternating peaks and valleys whose envelop is a declining function of Δk. The “correlation decay” (D) is defined as the difference between the first point (C(Δk = 0) =1) and the first valley of C(Δk). The correlation decay is an optical marker that is most sensitive to the spatial correlation distance Lc of the refractive index fluctuation, independent of the cell shape induced variations.
For each optical marker (i.e., disorder strength Ld, reflection coefficient R̄, correlation decay D), we can map the two-dimensional spatial distribution of Ld(x,y), R̄(x,y) and D(x,y) from each single cell or sub-cellular organelle. To analyze each optical marker from the individual cell nucleus, we calculated two statistical parameters – the average and standard deviation of each optical marker over the entire cell nucleus, denoted as Ld(nu), R̄(nu), D(nu)and σLd,(nu) σR̄(nu), σD(nu), respectively, with a total of six PWS-derived optical markers. For each patient, we analyzed approximately 25–30 cell nuclei and the optical markers from each patient were calculated by averaging the values of each marker within the individual cell nuclei under analysis, denoted as 〈Ld(nu)〉p, 〈R(nu)〉p, 〈D(nu)〉p, 〈σLd (nu)〉p, 〈σR̄(nu)〉p and 〈σD(nu)〉p, respectively.
Statistical Analysis
We performed a series of statistical analysis in order to evaluate and validate the diagnostic potential of measured optical markers. Each optical marker was compared between UC-Neg and UC-HGD/CA patients using the student’s t-test (Microsoft Excel 2007). Two-sided P values (assuming unequal variances) were used for all analyses. A two-sided P value of 0.05 or less was considered as statistically significant. The performance characteristics (i.e. sensitivity, specificity etc.) with combined data set of selected optical markers which maximizes the power of statistical analysis were calculated using Naive Bayes classifier, a machine-learning statistical model. This algorithm was employed in order to test and validate the diagnostic capability of the calculated optical signatures.
Naive Bayes Algorithm
In what follows, C refers to the class (i.e., cancer or normal) and Mi is the ith optical marker. Naïve Bayes assumes the markers are conditionally independent and normally distributed, given the class. Under these assumptions, the posterior probability of the class given the evidence is: . Maximum likelihood estimates for the parameters of the model (i.e. the means and the variances) are computed from the empirical means and variances. Predictions are made by returning the class with the largest posterior probability.
RESULTS
In the present study, we investigated the ability of partial-wave spectroscopic microscopy derived optical markers performed on the cell nuclei from non-dysplastic rectal mucosa to identify UC patients with high-grade dysplasia (HGD) or cancer (CA) (UC-HGD/CA) present anywhere in their colon. Specifically, we analyzed six optical markers derived from PWS, including disorder strength and its standard deviation, reflection coefficient and its standard deviation, and correlation decay and its standard deviation to differentiate UC-Neg patients from those of UC-HGD/CA. These optical markers provide complementary information about the subtle structural variations in the cell nuclear architectures and quantify the nano-structural alterations of nuclear refractive index fluctuation.
Figure 1 depicts the cytological and corresponding pseudocolor images of disorder strength (Ld(x,y)), reflection coefficient (R̄(x,y)) and correlation decay (D(x,y)) from the cell nuclei of histologically normal appearing rectal epithelial cells of UC-Neg and UC-HGD/CA patients. The significant qualitative alternation in the internal structures of the cell nucleus of UC-HGD/CA patients compared to UC-Neg is easily noticeable as indicated by changes in the values of optical markers (colors).
FIGURE 1.
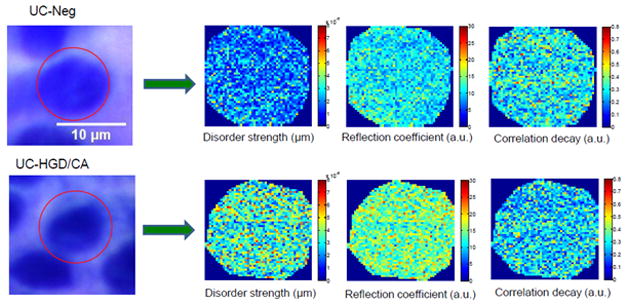
Representative bright field cytological specimen images and corresponding pseudocolor PWS images of various optical markers from a cell nucleus of UC patients. Top row: for UC-Negative (UC-Neg) and Bottom row: for UC-High Grade Dysplasia or Cancer (UC-HGD/CA).
For individual patient-based clinical diagnosis, we evaluated approximately 25–30 cell nuclei from cytologically non-dysplastic rectal epithelial cells from each patient and the average value of each optical marker was used as a quantitative optical marker for the patient. We identified six PWS-derived optical markers (i.e., 〈Ld(nu)〉p, 〈R(nu)〉p, 〈D(nu)〉p, 〈σLd(nu)〉p, 〈σR̄(nu)〉p and 〈σD(nu)〉p) which are statistically significant between UC patients with HGD/CA present anywhere in their colon and those UC patients without dysplasia. Figure 2 illustrates the box and whisker plots for the studied optical markers. As shown in the figure, the values of these optical markers have changed significantly in the UC patients with HGD/CA compared to UC-Neg cases. In particular, disorder strength and its standard deviation are remarkably elevated in the UC-HGD/CA patients (P = 0.00013 and 0.0017, respectively). Similarly, reflection coefficient and its standard deviation have also increased from UC-Neg patient to UC-HGD/CA patients (P = 0.0032 and 0.046, respectively). Finally, correlation decay and its standard deviation have decreased in UC-HGD/CA patients with compared to UC-Neg patients (P = 0.012 and 0.011, respectively). Such changes provide the evidence of nano-architectural alterations in the cell nucleus corresponding to HGD/CA patients.
FIGURE 2.
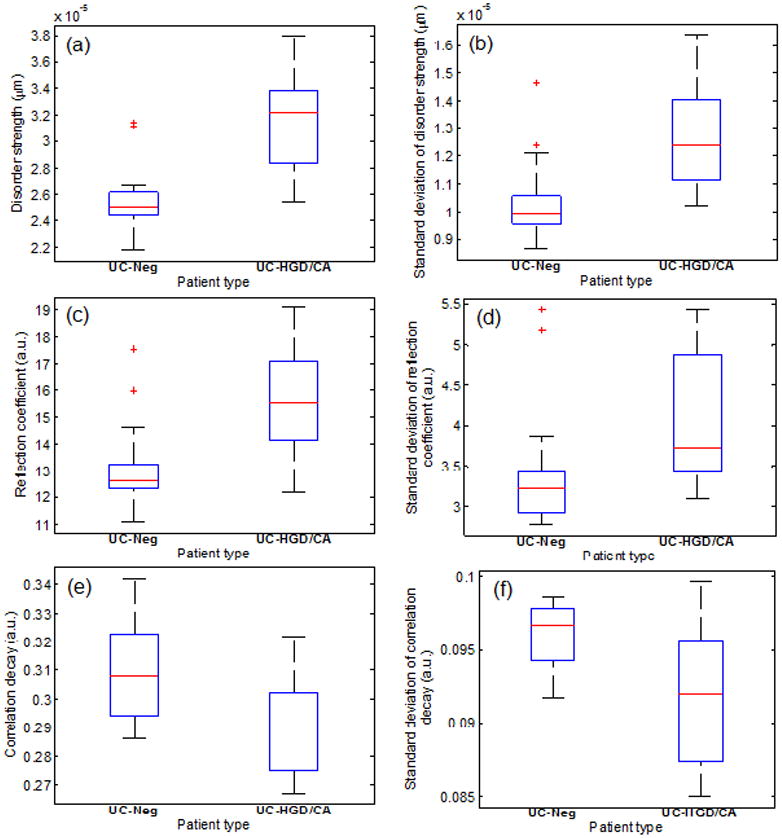
Box and whisker plots showing the change in the values of optical markers for UC-Neg and UC-HGD/CA patients: (a) Disorder strength (P = 0.00013) (b) Standard deviation of disorder strength (P = 0.0017) (c) Reflection coefficient (P = 0.0032) (d) Standard deviation of reflection coefficient (P = 0.046) (e) Correlation decay (P = 0.012), and (f) Standard deviation of correlation decay (P = 0.011). Final values of these parameters are obtained by averaging the individual values derived from randomly chosen ~25–30 cell nuclei for each patients type.
Performance characteristics of PWS derived optical markers
To determine the diagnostic ability of these optical markers, we have used a set of data obtained from 13 patients as training set and another 15 patients as a validation set. Using this training data, the two optical markers namely disorder strength and standard deviation of correlation decay were selected by maximizing training accuracy as concluded by Naive Bayes classifier. That classifier was then applied to the independent testing/validation data sets to evaluate the performance characteristics of optical markers obtained from PWS measurements by calculating sensitivity, specificity, positive predictive value, and negative predictive value. Here, the calculated values of the performance characteristics for both training and validation sets are summarized in Table 2. The performance characteristics of optical markers for detecting HGD or CA in the testing set of UC patients were modest with a sensitivity of 100%, specificity of 75% and F-measure of 0.865.
TABLE 2.
Performance characteristics of optical markers in correctly predicting UC patients with cancer/high-grade dysplasia.
| Training set (%) | Validation/testing set (%) | |
|---|---|---|
| Sensitivity | 100 | 100 |
| Specificity | 89 | 75 |
| Positive predictive value | 83 | 78 |
| Negative predictive value | 100 | 100 |
DISCUSSION
In this work, we have shown that the optical markers derived from PWS analysis, which utilizes measurements of the one-dimensional backscattering spectrum to assess refractive-index fluctuations at a sub-cellular level, allows for the quantitative assessment of subtle nano-structural alterations that are otherwise undetectable with conventional pathology. We report herein significant nuclear architectural changes from non-dysplastic rectal epithelial cells obtained from histologically non-dysplastic rectal biopsies in UC-HGD/CA patients as observed by several PWS-optical markers. With a combination of only two of these optical markers, we can accurately predict the UC-HGD/CA with 100% sensitivity and a specificity of approximately 80% (the average value of the training and validation set). This detection was made possible because of the unprecedented sensitivity of PWS method for assessing alterations in cell architecture at a scale as sensitive as 10 to 100 nm (19), well beyond what conventional microscopy reveals. Thus, nanoscale structural analysis in the single cell level from uninvolved rectum represents a powerful means of detecting the presence of colon cancer or high grade dysplasia and subsequently, could lead to better diagnosis and management of UC patients.
The utilization of cell nuclear nano-architecture to detect concurrent HGD/CA in UC patient is based on the concept of the “field effect” in colorectal cancer. Substantial evidence has been shown to support the biological basis of the “field effect”. It is commonly recognized that long-standing and extensive UC predisposes to the development of CRC. Hence, sporadic CRC in the colonic epithelium of patients with long-standing UC can be characterized by the “field effect” that makes a region of normal mucosal cells surrounding tumors susceptible to the occurrence and development of neoplasia (20). To support this hypothesis, a series of epigenetic and genetic changes have been proposed as candidate mediators of this “field effect”, which implicates both risk assessment and cancer prevention (21). It has been suggested that the hypermethylation is a frequent and early occurring event during the process of neoplastic progression in UC (22). Nuclear accumulation of p53 proteins has also been recognized as a useful marker to distinguish the UC-associated neoplasia from benign UC conditions (13). In this direction, numerous molecular alterations (e.g., DNA aneuploidy, chromosomal instability, K-ras mutation, p16 hypermethylation, p14 hypermethylation, microsatellite instability, telomere length shortening, gene expression by DNA microarray) have been revealed in the epithelium classified as histologically “nonneoplastic” from UC patients with neoplasia (9, 23–31). These molecular alterations in nonneoplastic mucosa could result in the nano-architectural changes of cell nuclei that may not be visible with conventional microscopy, but are detectable with PWS. Indeed, PWS has previously been shown to detect histologically unapparent nanoscale architecture of genetic alterations in three variants of colorectal cancer cell line HT29 due to genetic alteration as well as intestinal epithelial cells from APCMin mouse model due to APC germ-line mutation (16). Our results indicate that the detection of nuclear nano-architectural changes associated with complex molecular alterations in “cancer-adjacent” normal cells can be an excellent signature marker for surveillance of UC patients.
To characterize the nano-architecture of the cell nucleus derived from rectum biopsies, we employed six optical signatures: disorder strength and its standard deviation, reflection coefficient and its standard deviation and correlation decay and its standard deviation. Disorder strength is the combination of the product of the variance and the spatial correlation length of the refractive index fluctuations (Ld(x,y) = < Δn2 > Lc). The disorder strength quantifies the statistical properties of spatial variability of refractive index and, thus, the local concentration of intracellular material such as DNA, RNA, proteins, etc. At a given point in a cell, Δn is proportional to the local concentration of intracellular solids, whereas can be viewed as the characteristic size of the intracellular ultrastructure of a cell, with longer Lc corresponding to the spatially slower-changing refractive index due to the existence of larger intracellular macromolecular aggregates. Hence, a higher Ld in UC-HGD/CA patients may be due to the increase in < Δn2 > and/or Lc. Specifically, higher < Δn2 >can be associated with the increased density of intracellular macromolecular complexes, while the change in Lc may be due to the macromolecular aggregation (15). Similarly, the reflection coefficient characterizes the physical and refractive index properties of the biological cell. The correlation decay is most sensitive to the spatial correlation distance Lc of the refractive index fluctuation, independent of the cell shape induced variations. Furthermore, the standard deviation of each parameter evaluates the intra-nuclear spatial heterogeneity of the physical characteristics described by each optical marker. An important aspect of these parameters is that they can detect the subtle structural alternations (i.e., nano-architecture) beyond what a conventional optical microscope can visualize in the sub-cellular level. The numerical values of all of the optical signatures presented here are statistically significant in the UC patients with HGD/CA compared to normal patient.
The diagnostic performance of this optical technology does not appear to be compromised by confounding factor contributed by the presence of active inflammation in the rectum. The statistical analyses (student t-test) show that the differences of the PWS-derived rectal optical markers between UC-Neg and UC-HGD/CA are unlikely to be attributed to the presence of active inflammation in the rectum. For example, there is no statistical significance in all the PWS-derived optical markers between UC-HGD/CA patients without and with active inflammation (P = 0.3 and 0.7 for disorder strength and its standard deviation, P = 0.7 and 0.9 for reflection coefficient and its standard deviation and P = 0.2 and 0.9 for correlation decay and its standard deviation). Moreover, most optical markers between UC-Neg patients without and with active inflammation are also not statistically significant (P = 0.3 and 0.07 for disorder strength and its standard deviation, P = 0.03 and 0.03 for reflection coefficient and its standard deviation and P = 0.06 and 0.3 for correlation decay and its standard deviation). Most importantly, the presence of active inflammation showed no effect on the most effective optical markers selected in developing the prediction model (disorder strength and standard deviation of correlation decay) (P = 0.3).
Our ultimate goal is to simplify the surveillance of UC patients by optical analysis of rectal epithelial cells to identify a group of high-risk patients who deserve more meticulous examination with colonoscopy and emerging advanced in-vivo imaging technologies such as chromoendoscopy and confocal endoscopy. Since our goal is to identify those UC patients with high-grade dysplasia or cancer anywhere in their colon through the analysis of rectal biopsies, we aim at maximizing sensitivity, rather than specificity. This strategy is based on our desire to identify the vast majority of patients with high-grade dysplasia or colon cancer (i.e., 95–98%). A false-positive finding on PWS only leads to the performance of a current standard-of-practice – a full surveillance colonoscopy. We developed a prediction rule based on a training data set with a Naive Bayes classifier and 10-fold cross-validation. The performance characteristics were then validated on an independent validation data set. Based on the observed performance characteristics (100% sensitivity, approximately 80% specificity), these optical signatures hold promise for improved CRC surveillance in UC patients.
Our data using a small subset of samples from banked non-dysplastic rectal biopsies represents a proof-of-concept pilot study. A number of limitations in this study need to be acknowledged. First, we recognize that it is not ideal to use the banked frozen rectal tissue biopsies since the sample preparation may potentially alter the tissue structure, thus their optical markers could be distinct from those from freshly obtained tissue samples in future prospective studies. The results from this study could only serve as a proof-of-principle to demonstrate the feasibility of PWS-based optical markers to differentiate UC patients with HGD/CA from those without dysplasia. Second, our sample size is relatively small. It is encouraging that even with this small sample size, we could validate the prediction rule on an independent patients set with an excellent sensitivity. To mitigate the possibility of overfitting, we only used two most effective optical markers to develop the prediction model. Given the limited sample size and the use of banked frozen sample in this pilot study, the clinical utility of this technique needs to be further validated with a larger prospective study. Ultimately a large multicenter study will need to be performed to determine whether our proposed strategy of simplifying the surveillance of UC patients by optical analysis of rectal epithelial cells can be clinically effective.
In summary, we show herein that using a powerful light scattering based technology, PWS, performed on non-dysplastic rectal mucosa, we are able to accurately identify those UC patients with HGD or CA present anywhere in their colon. Our study suggests that the subtle changes in colorectal carcinogenesis are accompanied by increasing disorder strength and progressively higher heterogeneity of the intra-cellular nano-architecture of cells. Our findings indicate that PWS based optical signatures were able to identify those UC patients at higher risk of cancer with reasonable accuracy which provides compelling evidence for the relevance of these nano-architectural measures to neoplasia. More importantly, by aiming for a high sensitivity, this approach could potentially simplify the surveillance of UC patients and improve overall resource utilization by identifying those patients with HGD/CA who should proceed with colonoscopy and limiting the number of unnecessary negative surveillance procedures. Finally, the PWS technique is highly sensitive towards the nanoscale changes in the nuclear architecture which may play vital roles to predict those at an increased risk of neoplasm in a more objective and reliable manner. Hence, the utility of PWS-derived optical markers for the analysis of field carcinogenesis may serve as an effective tool as a novel, promising, and minimally-invasive approach for screening and surveillance of other types of malignancies.
TABLE 1(b) .
Details of patient and tested biopsy characteristics for validation/testing set.
| Patient No. | Age (years) | Gender | Disease duration (years) | Most advanced pathology | Dysplasia grade on tested biopsy | Distance to neoplasia (cm) | Active inflmmmation (in rectum) |
|---|---|---|---|---|---|---|---|
| 1 | 30 | F | 3 | negative | negative | NA | moderate |
| 2 | 34 | M | 2.5 | negative | negative | NA | severe |
| 3 | 31 | M | 3 | negative | negative | NA | florid |
| 4 | 17 | M | 1 | negative | negative | NA | severe |
| 5 | 31 | M | 8 | negative | negative | NA | severe |
| 6 | 31 | F | 12 | negative | negative | NA | mild |
| 7 | 34 | M | 8 | negative | negative | NA | mild |
| 8 | 60 | M | NA | negative | negative | NA | normal-colon diverticulitis |
| 9 | 69 | M | 11 | HGD | negative | ~96 | none |
| 10 | 63 | F | 23 | HGD | negative | ~28 | none |
| 11 | 39 | F | 20 | cancer | negative | ~62.5 | none |
| 12 | 86 | M | 5 | cancer | negative | ~65 | severe |
| 13 | 47 | M | 20 | cancer | negative | ~39 | moderate |
| 14 | 71 | F | 7.5 | cancer | negative | ~67 | severe |
| 15 | 66 | M | 13 | cancer | negative | ~149 | none |
Acknowledgments
Financial support: This work was supported by National Institute of Health/National Cancer Institute (R21CA138370, R21CA152935) and University of Pittsburgh Medical Center.
References
- 1.Hanauer SB. Inflammatory bowel disease: Epidemiology, pathogenesis, and therapeutic opportunities. Inflamm Bowel Dis. 2006;12 (Suppl 1):S3–S9. doi: 10.1097/01.mib.0000195385.19268.68. [DOI] [PubMed] [Google Scholar]
- 2.Ekbom A, Helmik CG, Zack M, et al. Survival and causes of death in patients with inflammatory bowel disease: a population-based study. Gastroenterology. 1992;103:954–960. doi: 10.1016/0016-5085(92)90029-x. [DOI] [PubMed] [Google Scholar]
- 3.Askling J, Dickman PW, Karlen P, et al. Family history as a risk factor for colorectal cancer in inflammatory bowel disease. Gastroenterology. 2001;120:1356–1362. doi: 10.1053/gast.2001.24052. [DOI] [PubMed] [Google Scholar]
- 4.Ekbom A, Helmick C, Zack M, et al. Ulcerative colitis and colorectal cancer. A population-based study. N Engl J Med. 1990;323:1228–1233. doi: 10.1056/NEJM199011013231802. [DOI] [PubMed] [Google Scholar]
- 5.Eaden JA, Abrams KR, Mayberry JF. The risk of colorectal cancer in ulcerative colitis: a meta-analysis. Gut. 2001;48:526–535. doi: 10.1136/gut.48.4.526. [DOI] [PMC free article] [PubMed] [Google Scholar]
- 6.Rutter M, Saunders B, Wilkinson K, et al. Severity of inflammation is a risk factor for colorectal neoplasia in ulcerative colitis. Gastroenterology. 2004;126:451–459. doi: 10.1053/j.gastro.2003.11.010. [DOI] [PubMed] [Google Scholar]
- 7.Chen R, Rabinovitch PS, Crispin DA, et al. DNA fingerprinting abnormalities can distinguish ulcerative colitis patients with dysplasia and cancer from those who are dysplasia/cancer-free. Am J Pathol. 2003;162:665–672. doi: 10.1016/S0002-9440(10)63860-6. [DOI] [PMC free article] [PubMed] [Google Scholar]
- 8.Riddell RH, Goldman H, Ransohoff DF, et al. Dysplasia in inflammatory bowel disease: standardized classification with provisional clinical applications. Hum Pathol. 1983;14:931–968. doi: 10.1016/s0046-8177(83)80175-0. [DOI] [PubMed] [Google Scholar]
- 9.Rabinovitch PS, Dziadon S, Brentnall TA, et al. Pancolonic chromosomal instability precedes dysplasia and cancer in ulcerative colitis. Cancer Res. 1999;59:5148–5153. [PubMed] [Google Scholar]
- 10.Brentnall TA, Pan S, Bronner MP, et al. Proteins that underline neoplastic progression of ulcerative colitis. Proteomics Clin Appl. 2009;3:1326–1337. doi: 10.1002/prca.200900061. [DOI] [PMC free article] [PubMed] [Google Scholar]
- 11.Bronner MP, O’Sullivan JN, Rabinovitch PS, et al. Genomic biomarkers to improve ulcerative colitis neoplasia surveillance. Am J Pathol. 2008;173:1853–1860. doi: 10.2353/ajpath.2008.080250. [DOI] [PMC free article] [PubMed] [Google Scholar]
- 12.Salk JJ, Salipante SJ, Ana Risques R, et al. Clonal expansions in ulcerative colitis identify patients with neoplasia. Proc Natl Acad Sci USA. 2009;106:20871–20876. doi: 10.1073/pnas.0909428106. [DOI] [PMC free article] [PubMed] [Google Scholar]
- 13.Fujii S, Katsumata D, Fujimori T. Limits of diagnosis and molecular markers for early detection of ulcerative colitis-associated colorectal neoplasia. Digestion. 2008;77 (suppl 1):2–12. doi: 10.1159/000111482. [DOI] [PubMed] [Google Scholar]
- 14.Roy HK, Kim YL, Wali RK, et al. Spectral markers in preneoplastic intestinal mucosa: an accurate predictor of tumor risk in the MIN mouse. Cancer Epidemiol Biomarkers Prev. 2005;14:1639–1645. doi: 10.1158/1055-9965.EPI-04-0837. [DOI] [PubMed] [Google Scholar]
- 15.Subramanian H, Pradhan P, Liu Y, et al. Partial-wave microscopic spectroscopy detects subwavelength refractive index fluctuations: an application to cancer diagnosis. Opt Lett. 2009;34:518–520. doi: 10.1364/ol.34.000518. [DOI] [PMC free article] [PubMed] [Google Scholar]
- 16.Subramanian H, Pradhan P, Liu Y, et al. Optical methodology for detecting histologically unapparent nanoscale consequences of genetic alterations in biological cells. Proc Natl Acad Sci USA. 2008;105:20124–20129. doi: 10.1073/pnas.0804723105. [DOI] [PMC free article] [PubMed] [Google Scholar]
- 17.Subramanian H, Roy HK, Pradhan P, et al. Nanoscale cellular changes in field carcinogenesis detected by partial wave spectroscopy. Cancer Res. 2009;69:5357–5363. doi: 10.1158/0008-5472.CAN-08-3895. [DOI] [PMC free article] [PubMed] [Google Scholar]
- 18.Liu Y, Li X, Kim YL, Backman V. Elastic backscattering spectroscopic microscopy. Opt Lett. 2005;30:2445–2447. doi: 10.1364/ol.30.002445. [DOI] [PubMed] [Google Scholar]
- 19.Boustany NN, Boppart SA, Backman V. Microscopic imaging and spectroscopy with scattered light. Annu Rev Biomed Engg. 2010;12:285–314. doi: 10.1146/annurev-bioeng-061008-124811. [DOI] [PMC free article] [PubMed] [Google Scholar]
- 20.Kim MS, Lee J, Sidransky D. DNA methylation markers in colorectal cancer. Caner Metastasis Rev. 2010;29:181–206. doi: 10.1007/s10555-010-9207-6. [DOI] [PubMed] [Google Scholar]
- 21.Shen L, Kondo Y, Rosner GL, Xiao L, et al. MGMT promoter methylation and field defect in sporadic colorectal cancer. J Natl Cancer Inst. 2005;97:1330–1338. doi: 10.1093/jnci/dji275. [DOI] [PubMed] [Google Scholar]
- 22.Hsieh C, Klump B, Holzmann K, Borchard F, et al. Hypermethylation of the P16INK4a promoter in colectomy specimens of patients with long-standing and extensive ulcerative colitis. Cancer Res. 1998;58:3942–3945. [PubMed] [Google Scholar]
- 23.Lashner BA, Shapiro BD, Husain A, Goldblum JR. Evaluation of the usefulness of testing for p53 mutations in colorectal cancer surveillance for ulcerative colitis. Am J Gastroenterol. 1999;94:456–462. doi: 10.1111/j.1572-0241.1999.877_f.x. [DOI] [PubMed] [Google Scholar]
- 24.Holzmann K, Weis-Klemm M, Klump B, Hsieh CJ, et al. Comparison of flow cytometry and histology with mutational screening for p53 and Ki-ras mutations in surveillance of patients with long-standing ulcerative colitis. Scand J Gastroenterol. 2001;36:1320–1326. doi: 10.1080/003655201317097191. [DOI] [PubMed] [Google Scholar]
- 25.Andersen SN, Lovig T, Clausen OP, et al. Villous, hypermucinous mucosa in longstanding ulcerative colitis shows high frequency of K-ras mutations. Gut. 1999;45:686–692. doi: 10.1136/gut.45.5.686. [DOI] [PMC free article] [PubMed] [Google Scholar]
- 26.Hsieh CJ, Klump B, Holzmann K, et al. Hypermethylation of the p16INK4a promoter in colectomy specimens of patients with long-standing and extensive ulcerative colitis. Cancer Res. 1998;58:3942–3945. [PubMed] [Google Scholar]
- 27.Sato F, Harpaz N, Shibata D, et al. Hypermethylation of the p14(ARF) gene in ulcerative colitis-associated colorectal carcinogenesis. Cancer Res. 2002;62:1148–1151. [PubMed] [Google Scholar]
- 28.Brentnall TA, Crispin DA, Bronner MP, et al. Microsatellite instability in nonneoplastic mucosa from patients with chronic ulcerative colitis. Cancer Res. 1996;56:1237–1240. [PubMed] [Google Scholar]
- 29.Issa JP, Ahuja N, Toyota M, et al. Accelerated age-related CpG island methylation in ulcerative colitis. Cancer Res. 2001;61:3573–3577. [PubMed] [Google Scholar]
- 30.O’Sullivan JN, Bronner MP, Brentnall TA, et al. Chromosomal instability in ulcerative colitis is related to telomere shortening. Nat Genet. 2002;32:280–284. doi: 10.1038/ng989. [DOI] [PubMed] [Google Scholar]
- 31.Watanabe T, Kobunai T, Toda E, et al. Gene expression signature and the prediction of ulcerative colitis-associated colorectal cancer by DNA microarray. Clin Cancer Res. 2007;13:415–420. doi: 10.1158/1078-0432.CCR-06-0753. [DOI] [PubMed] [Google Scholar]