

Abstract
Event-related brain oscillations (EROs) represent highly heritable neuroelectrical correlates of human perception and cognitive performance that exhibit marked deficits in patients with various psychiatric disorders. We report the results of the first genome-wide association study (GWAS) of an ERO endophenotype – frontal theta ERO evoked by visual oddball targets during P300 response in 1,064 unrelated individuals drawn from a study of alcohol dependence. Forty-two SNPs of the Illumina HumanHap 1M microarray were selected from the theta ERO GWAS for replication in family-based samples (N = 1,095), with four markers revealing nominally significant association. The most significant marker from the two-stage study is rs4907240 located within ARID protein 5A gene (ARID5A) on chromosome 2q11 (unadjusted, Fisher’s combined P = 3.68 × 10⁻⁶). However, the most intriguing association to emerge is with rs7916403 in serotonin receptor gene HTR7 on chromosome 10q23 (combined P = 1.53 × 10⁻⁴), implicating the serotonergic system in the neurophysiological underpinnings of theta EROs. Moreover, promising SNPs were tested for association with diagnoses of alcohol dependence (DSM-IV), revealing a significant relationship with the HTR7 polymorphism among GWAS case-controls (P = 0.008). Significant recessive genetic effects were also detected for alcohol dependence in both case-control and family-based samples (P = 0.031 and 0.042, respectively), with the HTR7 risk allele corresponding to theta ERO reductions among homozygotes. These results suggest a role of the serotonergic system in the biological basis of alcohol dependence and underscore the utility of analyzing brain oscillations as a powerful approach to understanding complex genetic psychiatric disorders.
Keywords: serotonin receptor gene (HTR7), serotonin receptor (5-HT7), event-related oscillation (ERO), alcohol dependence, genome-wide association study (GWAS)
INTRODUCTION
Brain oscillations are salient features of active neural networks, with specific frequency rhythms correlated to sensory perception and cognitive performance, including conscious awareness, memory, and stimulus processing [Llinas and Ribary, 1993; Klimesch et al., 1997, 2001; Basar et al., 2001a]. These electrophysiological markers are highly heritable [van Beijsterveldt and Boomsma, 1994; van Beijsterveldt et al., 1996] and are modulated by neurotransmitters and signal transduction factors, qualities that make them advantageous as intermediate phenotypes or endophenotypes that are less complex, quantitative, and more proximate to gene function than traditional cognitive measures and clinical diagnoses that are more influenced by individual and familial environmental factors [Tsuang and Faraone, 2000; Begleiter and Porjesz, 2006].
The electroencephalogram (EEG) records brain electrical activity using non-invasive scalp electrodes when the subject is either at rest, producing ongoing state measurements of neuroelectrical activity, or engaged in cognitive tasks, yielding event-related potentials (ERPs) that are time-locked to specific stimuli, events or processes. The P300 signal is perhaps the best studied ERP [Porjesz et al, 2005]; it is a large positive component occurring between 300-600 ms after a stimulus (Figure 1). This neuroelectrical component is highly heritable [O’Connor et al., 1994; Katsanis et al., 1997; Almasy et al., 1999], associated with brain structure integrity [McCarley et al., 1993; Ford et al., 1994] and with various task-related cognitive processes [Verleger, 1988; Tomberg and Desmedt, 1998; Polich and Herbst, 2000]. The neurochemical underpinnings of P300 are unclear, although available data suggest the involvement of strong GABAergic, cholinergic and glutamatergic interactions that elicit excitatory and inhibitory post-synaptic potentials, with indirect dopaminergic, nor-adrenergic and serotonergic modulating effects [Frodl-Bauch et al., 1999; Polich, 2007]. Various neurological disorders display reductions in P300 amplitude and prolonged latency, foremost being alcohol dependence [Porjesz and Begleiter, 1998] and schizophrenia [Ford et al., 1999], as well as a spectrum of externalizing disorders [Iacono et al., 2003].
Figure 1. Illustration of a standard P300 waveform and its time-frequency decomposition.

Top panel: visual oddball ERP waveforms from 48 normal, healthy control subjects. Bottom panel: time-frequency representation (TFR) plot for EEG responses to target stimuli. White box highlights the time-frequency region of interest (TFROI) and the inset head plot exhibits the frontal preponderance of the peak theta band activity.
Recent studies involving time-frequency domain analysis have determined that ERPs may not be unitary entities but arise from phase resetting or superposition of different frequency bands in various regions of the brain [Basar et al., 2001a; Makeig et al., 2002; Gruber et al., 2005]. These underlying neural phenomena, referred to as event-related oscillations (EROs), appear to influence the timing of brain activity and synchrony in networks of active neurons, and thus are likely to represent a basic mechanism of neural communication and integrative brain functions [Basar et al., 1999, 2001a; Fries, 2005; Buzsaki, 2006].
Generally, EROs have been analyzed using traditional EEG frequency band limits: delta (1-3 Hz); theta (4-7 Hz); alpha (8-12 Hz); beta (13-28 Hz); and gamma (>29 Hz). EROs have been increasingly used to study the neural components of brain function [Klimesch et al., 1997b, 2001; Schurmann et al., 1997; Basar et al., 2000, 2001a]. Different frequency rhythms of oscillatory responses are attributed to particular cognitive processes. For instance, delta EROs are attributed to signal evaluation and decision-making [Basar et al., 1999; Schurmann et al., 2001], whereas theta rhythms appear to mediate conscious awareness, attention, recognition memory, frontal inhibitory control, and episodic retrieval [Klimesch et al., 1994, 2001; Doppelmayr et al., 1998; Gevins et al., 1998; Karakas et al., 2000a,b; Basar et al., 2001b]. The P300 component is composed of a superposition of different frequency bands, predominantly theta and delta, with the theta having a more frontal topography, while the delta maximum has a more parietal location.
These oscillatory responses have served as useful endophenotypes for measuring and deconstructing neurocognitive dysfunctions related to a variety of complex behavioral disorders, including alcohol dependence [Jones et al., 2004, 2006b; Porjesz et al., 2005; Padmanabhapillai et al., 2006a,b; Rangaswamy et al., 2007]. The Collaborative Study on the Genetics of Alcoholism (COGA) has investigated event-related oscillatory responses in families densely affected with alcoholism, finding significant reductions in evoked theta and delta ERO amplitudes among affected subjects while processing target stimuli [Jones et al., 2006b]. Studies examining high-risk children of alcoholics for the same paradigm have revealed similar reductions in theta and delta band ERO amplitudes compared to normal children (ages 14-17 years) [Rangaswamy et al., 2007], indicating that the deficits antecede the development of alcoholism and represent a strong trait marker. Family-based linkage analysis and candidate gene association studies of ERO responses have identified several chromosome regions and genetic variants that underpin these neuroelectrical activities and contribute to the risk of alcohol dependence. Most notably, significant genetic linkage was reported on chromosome 7q31-34, with association detected between positional candidate CHRM2, muscarinic cholinergic receptor 2, and frontal theta EROs underlying the P300 ERP to target stimuli during a visual oddball task [Jones et al., 2004, 2006a]. In addition, several SNPs in GRM8 (metabotropic glutamate receptor type 8), another candidate gene located under the same linkage peak, are associated with theta EROs to target stimuli at frontal, central and parietal regions [Chen et al., 2009]. Both of these receptor genes have also been implicated in the development of alcoholism [Wang et al., 2004; Chen et al., 2009], underscoring the utility of EROs as endophenotypes in relation to psychiatric pathologies.
In the present paper, we report the results of the first genome-wide association study (GWAS) of an ERO endophenotype – frontal theta oscillations at the midline frontal electrode (Fz) during processing of target visual signals in a visual oddball paradigm. The analysis used a sample of unrelated individuals drawn from a study of alcohol-dependence. High ranking SNPs from the GWAS were selected for replication analysis in a family-based sample ascertained for alcohol dependence, implicating new regions not detected by previous linkage analyses, with a number of significant markers in or near genes that play important roles in cellular development and signal transduction pathways. Promising SNPs were also tested for association with diagnoses of alcohol dependence in both samples.
METHODS
Sample Recruitment and Assessment
The samples included in this study were recruited and tested as part of the multi-site Collaborative Study on the Genetics of Alcoholism (COGA), a national consortium designed to study the genetic predisposition to develop alcoholism and related phenotypes. Data from seven COGA sites were included in the analysis: SUNY Downstate Medical Center at Brooklyn, New York; University of Connecticut Health Center; Washington University School of Medicine in St. Louis; University of California at San Diego; University of Iowa Carver College of Medicine; Indiana University School of Medicine; and Howard University College of Medicine. Institutional review boards at each site approved the research protocols in the COGA study and written consent was obtained from each individual prior to participation.
Recruitment and assessment procedures have been outlined previously [Begleiter et al., 1995; Reich et al., 1998; Foroud et al., 2000; Nurnberger et al., 2004]. Alcoholic probands were recruited from inpatient and outpatient treatment centers and control families were selected from HMOs, drivers’ license records, and dental clinics, with the objective of obtaining representative samples of the communities at each recruitment site. Prior to administration of a neurophysiological battery and drawing of blood for DNA extraction, alcohol dependent subjects were required to have been detoxified in a 30-day treatment program and not exhibit withdrawal symptoms. Subjects were excluded from assessment for any of the following: (1) recent substance and alcohol abuse (i.e., positive breath-analyzer test and/or urine screen); (2) hepatic encephalopathy/cirrhosis of the liver; (3) significant history of head injuries, seizures or neurosurgical procedures; (4) uncorrected sensory deficits; (5) subjects taking medication known to influence brain functioning (e.g., any psychotropic drugs); and (6) history or symptoms of psychoses.
All recruited individuals and participating family members were administered a validated poly-diagnostic instrument, the Semi-Structured Assessment for the Genetics of Alcoholism (SSAGA) [Bucholz et al., 1994; Hesselbrock et al., 1999]. The SSAGA allows assessment of alcohol dependence by several criteria, including Feighner [Feighner et al, 1972], DSM-IIIR [American Psychiatric Association, 1987], DSM-IV [American Psychiatric Association, 1994], and ICD-10 [World Health Organization, 1993].
GWAS Case-Control Sample
All alcohol-dependent cases and controls in the GWAS sample (N = 1,884) are genetically unrelated. Cases (N = 1,192) were diagnosed for DSM-IV alcohol dependence at each clinical assessment if assessed multiple times. Controls (N = 692) were chosen for the GWAS if considered unaffected during their entire lifetimes according to any of the four alcohol dependence criteria. To avoid pleiotropic genetic components that contribute to multiple substance abuse phenotypes, controls for the GWAS also did not meet diagnostic criteria for other illicit substance abuse or dependence. Furthermore, controls were required to be 25 years or older and to have consumed alcohol at some point in their lives to ensure that their unaffected status was not due to lack of exposure to alcohol. Based on the results of a multidimensional (MDS) analysis of genomewide IBS differences, GWAS samples predominantly clustered among two subgroups characterized as being of either European (74.3%; N = 1,399) or African ancestry (25.7%; N = 485) (refer to the section on GWAS genotyping for more detail). Twenty-one individuals did not cluster with either of the two groups and were excluded from analysis. A subset of the subjects (N = 1,064) had measurements for theta ERO energy available for GWAS analysis (see Figure 2 for overview of research design).
Figure 2.
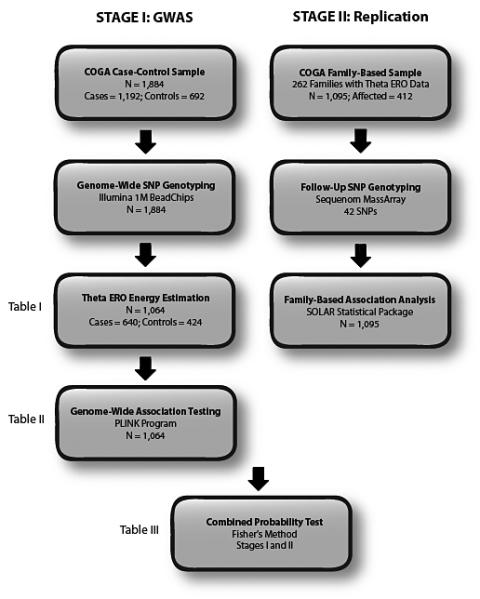
Schematic of two-stage association study of the theta ERO phenotype.
Family-Based Replication Sample
For the second stage, forty-two promising SNPs from the GWAS were tested for association with theta EROs in a set of 262 genetically informative, multiplex alcohol dependence pedigrees (N = 1,095 individuals). The ethnic composition of the sample based on self-reporting is predominantly European-American (78.5%; N = 862) and African-American (13.9%; N = 153). Both linkage [Reich et al, 1998; Williams et al., 1999; Foroud et al., 2000; Jones et al., 2004] and family-based association analyses [Edenberg et al., 2004; Wang et al. 2004; Edenberg and Foroud, 2006; Jones et al., 2006a; Dick et al., 2007] have been performed previously in these families. Although some members of these families, primarily probands, were included among the GWAS case-controls, overlapping individuals were removed from this family-based sample using the program PEDSYS, and thus the results from each association test are independent.
Electrophysiological Data Collection
All seven collaborating sites used identical experimental procedures and EEG acquisition hardware and software programs. EEG was recorded using a fitted electrode cap (Electro-Cap International, Inc., Eaton, OH) with a nose reference point and a forehead ground electrode. Continuous EEG was sampled as the subjects performed the standard visual oddball paradigm that was selected to elicit the event-related potential containing the P300 component [Porjesz et al., 1998]. The task involves the presentation of three types of visual stimuli: 12.5% are target (X), 75% are non-target (squares) and 12.5% are novel (non-repeating colored polygons). Subjects responded to the appearance of target stimuli by pressing a button with either the left or right index finger. The artifact control and data reduction procedures have been described in great detail in two earlier papers on theta and delta EROs [Jones et al., 2006b; Rangaswamy et al., 2007].
ERO Energy Estimation
Estimates of localized energy of non-stationary event-related potential time series were obtained using a time-frequency representation (TFR) method, the S-transform [Stockwell et al., 1996; Stockwell 2007]. Additional details of this method are described in previous publications [Jones et al., 2004, 2006b; Rangaswamy et al., 2007].
Visual oddball event-related electrophysiological data for the target conditions were analyzed. Mean values were calculated from the S-transform TFR for use as phenotypes within time-frequency regions of interest (TFROIs) that are specified by frequency band ranges and time intervals [Lachaux et al., 2003]. This study focused on the total amplitude of the theta (4.0-7.0 Hz) frequency band in the 300-700 ms time window range, which corresponds to the P300 latency window in the event-related waveforms measured at the frontal midline channel (Fz electrode) (see Figure 1), a brain region where theta oscillations have been found to be strongly concentrated for the P300 response [Karakas et al., 2000b]. This TFROI was established by examination of target condition grand-mean TFRs and selecting a time region that bound observed stimulus evoked increases in theta band energy relating to a subcomponent of the P300 ERP. Similar to the P300 ERP amplitude, the theta ERO phenotype showed a significant age effect and thus age was included as a covariate in the genetic analyses.
For the GWAS sample, a total of 1,064 theta ERO measurements were recorded (with ±4 SD outliers excluded from genome-wide association analysis), corresponding to 640 cases with alcohol dependence and 424 controls, ranging in age from 17 to 69 years, and consisting of 570 males and 494 females (see Table I). Of the cases, 242 were selected from densely affected families that have been studied in previous COGA family-based linkage and association analyses, but none of these were included in the family-based replication study.
Table I.
Descriptive Statistics and Ethnic Composition of GWAS Cases and Controls with Theta ERO Measurements.
| Cases (N = 640) | Controls (N = 424) | |
|---|---|---|
| European-American | 431 | 340 |
| African-American | 209 | 84 |
| Sex (Male: Female) | 452:188 | 118:306 |
| Mean Age (SD) | 39.10 (10.04) | 43.33 (11.84) |
| Mean Theta ERO (SD) | 3.47 μV (1.12) | 3.76 μV (1.11) |
GWAS Genotyping and Quality Control
Genotyping was performed by the Center for Inherited Disease Research (CIDR) at John Hopkins University using the Illumina Infinium II assay protocol protocol [Gunderson et al., 2006] for hybridization to Illumina HumanHap 1M BeadChips (Illumina, San Diego, CA). Details are reported by Edenberg et al. [2010] and both protocols and the dataset are available on the NCBI database dbGaP (available at http://www.ncbi.nlm.nih.gov/sites/entrez?db=gap; accession number: phs000125.v1.p1). Blind duplicate reproducibility was 99.97%.
Additional quality control measures were applied to the dbGaP data for both the samples and the SNPs. Samples having genotypes for at least 98% of the SNPs were considered for inclusion in analyses. These samples were rigorously checked for cryptic relatedness, population stratification, consistency with reported sex, and related quality control issues [Edenberg et al., 2010]. For the theta ERO sample subset (N = 1,064) used in the GWAS analysis (see below), 771 individuals were classified as European-American and 293 as African-American. The inclusion thresholds for SNPs were a minimum call rate of 98%, minor allele frequency (MAF) greater than 0.01, and Hardy-Weinberg P-values greater than 0.001 for the European-American and African-American groups. Based on these criteria, 90,394 SNPs were removed, reducing the number of SNP markers in the final genotype dataset to 951,071.
Replication Genotyping
After reviewing the results from the primary genome-wide association analysis, top-ranking SNPs were annotated for function (i.e., synonymous, non-synonymous, splice-site, intronic, etc.) and aligned against the human genome assembly build 36.3 using the program WGAViewer ver. 1.25 [Ge and Goldstein, 2007]. Forty-two SNPs were chosen from the GWAS results and successfully genotyped in the family-based sample (see supplementary online material). Of these, 30 were selected from the top 250 ranking markers located within or near (<50 kb) genes of interest based on genic function and expression patterns, including regions exhibiting high regulatory potential and interspecies conservation (e.g., ESPERR score) [Taylor et al., 2006]. These were supplemented by 12 other SNPs outside the top 250, but still nominally significant (P = 0.05), identified as potentially relevant to neuroelectrical activity and neuronal development [e.g., Neuritin 1 (NRN1), Neurexophilin 1 (NXPH1), and serotonin receptor genes (HTR2A and HTR7)]. Genotyping assays were designed for the Sequenom MassArray system (Sequenom, San Diego, CA) using MassArray Assay Design Software. Genotyping used iPLEX assays (Sequenom, San Diego, CA), with alleles discriminated by mass spectrometry. Assays were tested on two independent groups, 40 unrelated European-American individuals and 40 unrelated African-American individuals (samples obtained from Coriell Cell Repositories). SNPs that were not in Hardy Weinberg equilibrium in both groups were not genotyped in the COGA families. All SNPs were tested for Mendelian inheritance using the program PEDCHECK [O’Connell and Weeks, 1998]. Marker allele frequencies were computed using the program USERM13 [Lange et al., 1988].
Statistical Genetic Analyses
Genome-wide association tests were performed on 1,064 frontal theta ERO measurements and corresponding genotypic data using a standard quantitative trait measured genotype method [Boerwinkle et al., 1986] implemented in the new GWAS software package PLINK [Purcell et al., 2007a]. Under a simple fixed effects additive measured genotype (MG) model, SNP genotypes are coded 0 for heterozygotes, −1 for one homozygote, and 1 for the other homozygote and then the variation of the trait mean by genotype is assessed via a general linear regression. Population stratification, a well-known source of confounding for case-control association studies, was corrected using two methods: computation of genomic-control (GC) adjusted significance values [Devlin and Roeder, 1999], which accommodates over-dispersion of the chi-square statistic due to heterogeneity through the estimation of an inflation statistic; and adjustment of genotypes and phenotypes for population ancestry through linear regressions of principal component scores estimated from genotypic data [Price et al., 2006]. Success of the principal component score-based correction was assessed by examining the GC correction factor. Furthermore, neurophysiological endophenotypes are known to vary between males and females and by age and thus age and sex were also incorporated as covariates in the linear regression model. Case/control status was not used as a covariate in the main analysis, despite observed theta ERO deficits among the GWAS cases, in order to detect genetic variants that may contribute to the susceptibility of alcohol dependence through their effects on electrophysiology. If a gene affects brain function, as indexed by electrophysiological measures, and these differences in brain function also contribute to risk of alcohol dependence, then correcting for case/control status partially removes the effects of the very genes we are most interested in localizing. However, secondary analyses were performed in which case/control status was used as a covariate, producing negligible differences among the top-ranking SNPs as compared to the main GWAS results. The full set of P-values that emerged from the PLINK association analysis were loaded and visualized in Haploview ver. 4.1 [Barrett et al., 2005] and WGAViewer ver. 1.25. These two programs were used to compute LD patterns and haplotype maps, generate quantile-quantile (Q-Q) plots, and annotate top-ranking SNPs with the latest available genomic databases.
For the family-based replication study, SNP association analysis was conducted with the statistical computer software SOLAR [Almasy and Blangero, 1998] using the quantitative trait linkage disequilibrium (QTLD) procedure. This procedure performs a test for population stratification (based on the likelihood comparison of between-family and within-family association parameters of estimated and constrained fixed effect models) and two commonly used association tests: measured genotype test (see above) and the quantitative transmission disequilibrium test (QTDT) [Abecasis et al., 2000]. Although QTDT is a family-based association test that controls for spurious associations due to population stratification by scoring allelic transmissions based on parental genotypes, in the absence of stratification the classical measured genotype approach uses more of the relative association information and exhibits more power than the QTDT [Havill et al., 2005] and thus is reported for the replication results when this condition is met.
SNPs exhibiting significant or near significant association with theta ERO measurements for both sample sets were further tested for association with diagnoses of alcohol dependence (DSM-IV). For the case-control data set, these analyses were performed in PLINK using logistic regression under an additive model, with age, sex, and the first and second PCs as covariates. For the family sample, a liability threshold model with an ascertainment correction was implemented in SOLAR, also assuming an additive mode of gene action. Markers that produced significant results under the additive model for either sample were additionally tested for association under both recessive and dominant genetic models (i.e., pairwise comparison of frequencies for either the minor or major homozygotes against the other two genotype classes). Haplotype-based tests were also carried out for the HTR7 region in the GWAS data set using PLINK, including single omnibus analyses for H–1 degrees of freedom that jointly tests all H haplotypes by comparing the alternate (each haplotype having a unique effect) versus the null (no haplotypes having any different effect) [Purcell et al., 2007b].
RESULTS
Stage I: GWAS in Unrelated Individuals
Estimates of theta ERO energy of the TFROI were calculated using the S-transform algorithm for 1,064 case-control subjects, producing a mean score of 3.58 ± 1.12 μV and range of 0.86 μV to 8.05 μV. For the two subject classes, cases (N = 640) and controls (N = 424), the means were 3.47 ± 1.12 μV and 3.76 ± 1.11 μV, respectively (P = 3.1 × 10⁻⁵). After stringent data cleaning and quality control, GWAS was performed on theta ERO data for 951,071 SNPs, with age, sex and PCs 1 and 2 included as covariates. The quantile-quantile plot of association results for individual SNPs is presented in Figure 3. No strong deviation is observed from the expected distribution of P-values, although some dispersion is evident at the extreme tail. The genomic inflation factor (λ) is 1.0 (corresponding median chi-squared statistic is 0.94), indicating no biased inflation of the test statistic or population stratification artifacts.
Figure 3. Quantile-quantile plot of genome-wide association results.
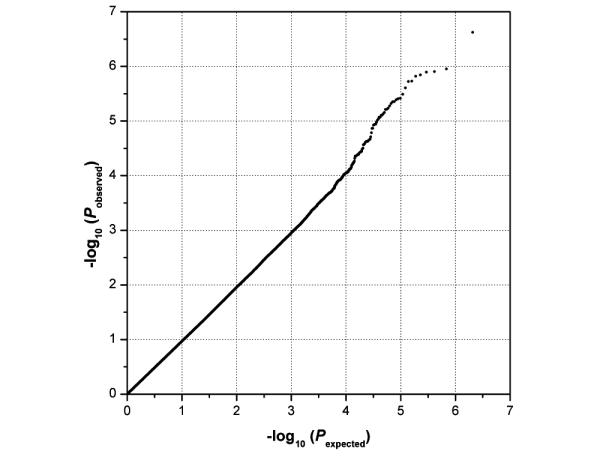
Observed P-values (y-axis) for theta ERO measurements are plotted for 951,071 SNPs against expected P-values (x-axis) under the null distribution for no association.
The genome-wide association results (−log10 P-value scores) for theta EROs are presented as a Manhattan plot in Figure 4, with SNPs displaying P-values less than 1.0 × 10⁻⁵ (N = 28) listed in Table II. The top-ranking SNP (rs2784) has a P-value of 2.4 × 10⁻⁷, falling short of the threshold for genome-wide significant association (Bonferroni-adjusted 5.3 × 10⁻⁸). This marker, along with ten other SNPs listed in Table II, are located within the intronic regions of TAOK3 on chromosome 12q24 (NCBI build 36.3 bp 117,071,989 – 117,295,133). This gene codes for TAO kinase 3, which is involved in MAP kinase (ERK and JNK) signaling pathways [Zhang et al., 2000] that play important roles in neuronal growth and differentiation [Rueda et al., 2002; Harada et al., 2004; Kanzawa et al., 2006]. A 199 kb “strong LD” block (bp 117,073,452 – 117,272,386) encompassing rs2784 and neighboring top-ranking SNPs was identified by the D’ confidence interval algorithm employed in Haploview ver. 4.1 [Gabriel et al., 2002]. The pairwise r2 scores for rs2784 with other top-ranking TAOK3 markers (P < 1.0 × 10⁻⁵) range from 0.75 (rs7314987) to 0.97 (rs17512142). Results from a haplotype-based association test identified 14 different haplotypes within this 38 SNP LD block, with one of the haplotypes (frequency of 0.095) producing a highly significant P-value of 6.5 × 10⁻⁷.
Figure 4. Genome-wide association results.
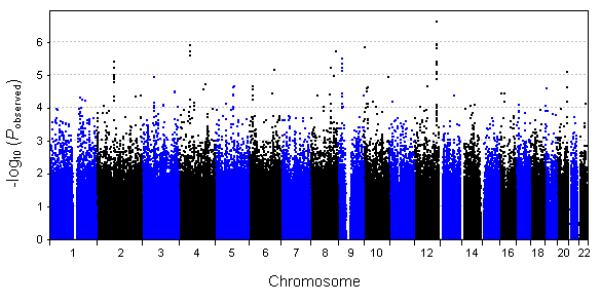
P-values (−log10) for 951,071 SNPs are plotted in order of chromosome position.
Table II.
Association Results for Theta ERO Phenotype (P < 1 × 10⁻⁵)
| CHR | refSNP ID | Class | Position (bp)a | Allelesb | MAFc | MAF-EAd | MAF-AAe | Nearest Gene | Distance (bp)f | P-value |
|---|---|---|---|---|---|---|---|---|---|---|
| 2 | rs2278563 | Intronic | 96,576,420 | T:C | 0.225 | 0.276 | 0.080 | ARID5A | 0 | 6.17 × 10⁻⁶ |
| 2 | rs4907240 | Intergenic | 96,591,766 | A:G | 0.227 | 0.278 | 0.074 | ARID5A | 9,669 | 3.93 × 10⁻⁶ |
| 2 | rs6749159 | Intronic | 96,631,020 | C:T | 0.227 | 0.278 | 0.079 | KIAA1310 | 0 | 9.67 × 10⁻⁶ |
| 4 | rs6828465 | Intergenic | 60,169,830 | A:G | 0.354 | 0.295 | 0.476 | AC096588.1 | 87,619 | 1.87 × 10⁻⁶ |
| 4 | rs6842739 | Intergenic | 60,172,105 | A:G | 0.355 | 0.296 | 0.477 | AC096588.1 | 89,894 | 1.27 × 10⁻⁶ |
| 4 | rs10866168 | Intergenic | 60,175,356 | T:C | 0.371 | 0.296 | 0.413 | AC096588.1 | 93,145 | 2.48 × 10⁻⁶ |
| 6 | rs1556640 | Intronic | 138,467,725 | C:T | 0.127 | 0.123 | 0.137 | PERP | 0 | 7.00 × 10⁻⁶ |
| 8 | rs281757 | Intergenic | 108,701,158 | A:G | 0.370 | 0.331 | 0.485 | ANGPT1 | 121,699 | 6.09 × 10⁻⁶ |
| 8 | rs2199922 | Intergenic | 136,313,508 | A:G | 0.080 | 0.100 | 0.022 | KHDRBS3 | 225,382 | 1.89 × 10⁻⁶ |
| 9 | rs1063192 | 3′ UTR | 21,993,367 | C:T | 0.338 | 0.427 | 0.080 | CDKN2B | 0 | 4.40 × 10⁻⁶ |
| 9 | rs564398 | Downstream | 22,019,547 | G:A | 0.326 | 0.413 | 0.074 | MTAP | 31 | 7.39 × 10⁻⁶ |
| 9 | rs2157719 | Downstream | 22,023,366 | G:A | 0.333 | 0.422 | 0.075 | MTAP | 3,850 | 3.23 × 10⁻⁶ |
| 9 | rs1412829 | Intergenic | 22,033,926 | C:T | 0.326 | 0.413 | 0.074 | MTAP | 14,410 | 5.83 × 10⁻⁶ |
| 10 | rs2961599 | Intergenic | 4,835,165 | A:G | 0.370 | 0.330 | 0.488 | AKR1CL2 | 23,237 | 1.43 × 10⁻⁶ |
| 12 | rs17440315 | Intronic | 117,081,007 | G:A | 0.106 | 0.134 | 0.025 | TAOK3 | 0 | 4.06 × 10⁻⁶ |
| 12 | rs17440336 | Intronic | 117,085,493 | T:C | 0.119 | 0.134 | 0.076 | TAOK3 | 0 | 4.47 × 10⁻⁶ |
| 12 | rs17512142 | Intronic | 117,108,374 | C:A | 0.096 | 0.121 | 0.023 | TAOK3 | 0 | 1.24 × 10⁻⁶ |
| 12 | rs17512198 | Intronic | 117,116,405 | G:T | 0.119 | 0.134 | 0.076 | TAOK3 | 0 | 4.77 × 10⁻⁶ |
| 12 | rs10507286 | Intronic | 117,119,289 | T:C | 0.120 | 0.134 | 0.080 | TAOK3 | 0 | 7.88 × 10⁻⁶ |
| 12 | rs17440433 | Intronic | 117,123,695 | A:G | 0.105 | 0.133 | 0.024 | TAOK3 | 0 | 3.84 × 10⁻⁶ |
| 12 | rs16948204 | Intronic | 117,180,440 | C:T | 0.120 | 0.134 | 0.079 | TAOK3 | 0 | 8.49 × 10⁻⁶ |
| 12 | rs7314987 | Intronic | 117,196,260 | T:C | 0.096 | 0.121 | 0.022 | TAOK3 | 0 | 1.11 × 10⁻⁶ |
| 12 | rs16948230 | Intronic | 117,199,274 | G:A | 0.120 | 0.134 | 0.079 | TAOK3 | 0 | 8.49 × 10⁻⁶ |
| 12 | rs2784 | Intronic | 117,233,933 | C:T | 0.096 | 0.123 | 0.021 | TAOK3 | 0 | 2.39 × 10⁻⁷ |
| 12 | rs7309671 | Intronic | 117,235,376 | T:C | 0.106 | 0.135 | 0.023 | TAOK3 | 0 | 1.52 × 10⁻⁶ |
| 12 | rs7312555 | Intronic | 117,336,308 | T:C | 0.111 | 0.144 | 0.015 | SUDS3 | 0 | 9.21 × 10⁻⁶ |
| 20 | rs6026576 | Intronic | 56,892,562 | A:G | 0.394 | 0.367 | 0.472 | GNAS1 | 0 | 7.79 × 10⁻⁶ |
Based on NCBI reference assembly build 36.3.
A1 (minor):A2 (major) alleles.
Minor allele frequency.
Minor allele frequency of European-American sample.
Minor allele frequency of African-American sample.
Distance to nearest gene.
In addition to TAOK3, SNPs listed in Table II are located in or nearby other genes, including MTA phosphorylase gene (MTAP), ARID (A-T Rich Interaction Domain) protein 5A (ARID5A), cyclin-dependent kinase inhibitor 2B (CDKN2B), guanine nucleotide binding protein 1 (GNAS1), and subunit of histone deacetylase-dependent SIN3A (SUDS3). None of these genes have been previously associated with brain oscillation features.
Stage II: Replication in Family-Based Sample
From the GWAS results and SNP annotation performed with WGAViewer ver. 1.25, SNPs were prioritized for follow-up genotyping according to association P-values, concordance with Hardy-Weinberg equilibrium, predicted functions, linkage disequilibrium context, and gene functions and expression patterns. Forty-two SNPs were genotyped in the family-based replication sample (N = 1,095). The corresponding theta ERO data set has a mean value of 3.99 ± 1.18 μV and range of 1.05 μV to 8.56 μV, with no evidence of kurtosis, and an estimated heritability of 0.56 (P = 3.7 × 10⁻²⁸) based on maximum likelihood variation decomposition implemented in SOLAR. The second stage association analysis produced six significant or near significant SNPs for the measured genotype test (no evidence of stratification or Hardy-Weinberg disequilibrium was detected for these particular markers), of which four exhibited genetic effect sizes (β coefficients) and directions (relative to the minor allele) that are consistent across the two stages. The MAFs and association results for the four SNPs are presented in Table III, along with combined P-values for the two stages using Fisher’s combined probability test [Fisher, 1925]. The lowest P-value observed for the family-based sample is 3.9 × 10⁻⁴ (Bonferroni-corrected 1.6 × 10⁻²) for rs7916403 located within intron 1 of the 5-hydroxytrptamine (serotonin) 7 receptor gene (HTR7) on chromosome 10q23, with a combined P-value score of 1.5 × 10⁻⁴ for the two stages. The association for the GWAS sample was notably stronger in the European-American subset (P = 9.97 × 10⁻⁴), suggesting potential population-specific ERO effects for this particular locus (see below for additional analyses). The other three significant SNPs from the follow-up association analysis are: rs4907240 downstream from ARID5A on chromosome 2q11; rs13831 located in the 3′ UTR of GNAS1 on chromosome 20q13; and non-synonymous rs2294015 of annexin A13 (ANXA13) on chromosome 8q24.
Table III.
Significant Associations for Theta ERO from Case-Control GWAS and Family-Based Replication
| Stage I: GWAS |
Stage II: Replication |
||||||||
|---|---|---|---|---|---|---|---|---|---|
| SNP | Gene | Minor Allele | MAF | Effect Size (β ± SE)a | P-Value | MAF | Effect Size (β ± SE)a | P-Value | Combined P-Valueb |
| rs4907240 | ARID5A | A | 0.227 | 0.254 ± 0.055 | 3.93 × 10⁻⁶ | 0.259 | 0.104 ± 0.055 | 5.75 × 10⁻² | 3.68 × 10⁻⁶ |
| rs13831 | GNAS1 | T | 0.240 | −0.209 ± 0.052 | 6.47 × 10⁻⁵ | 0.250 | −0.147 ± 0.053 | 5.95 × 10⁻³ | 6.07 × 10⁻⁶ |
| rs2294015 | ANXA13 | G | 0.334 | 0.211 ± 0.048 | 1.05 × 10⁻⁵ | 0.379 | 0.092 ± 0.048 | 5.84 × 10⁻² | 9.39 × 10⁻⁶ |
| rs7916403 | HTR7 | T | 0.492 | 0.096 ± 0.045 | 3.20 × 10⁻² | 0.474 | 0.167 ± 0.047 | 3.88 × 10⁻⁴ | 1.53 × 10⁻⁴ |
Genetic effect in the direction of minor allele.
Unadjusted P-values obtained from Fisher’s combined probability test [Fisher, 1925].
Conspicuously absent from Table III are the top-ranking TAOK3 markers from the GWAS, eight of which were genotyped but none achieving significance. The directions of genetic effect for all eight TAOK3 SNPs are the same as those obtained from the GWAS (i.e., minor alleles associated with theta ERO reductions); however, the largest effect size is 0.092 (SE 0.078) for rs7314987, approximately one-fourth of the regression coefficient estimated for the top GWAS SNP rs2784. The MAF values in the family-based sample (N = 1,095) are similar to those reported for the GWAS case-controls (N = 1,064), ranging from 0.11 to 0.13, suggesting comparable power for detecting association with the ERO phenotype. None of the markers exhibit significant population stratification or deviation from HWE. Thus, the observed discrepancy in associations across the two stages may simply represent a GWAS false positive for this particular string of markers within the TAOK3 LD block or stem from underlying differences in genetic substructure between the data sets that relate to the high-density affected family or case-control sample designs. If the smaller effect size estimate from the family sample is the more accurate one, the detection of TAOK3 in the GWAS sample was a low probability event, which would be difficult to replicate without a large sample size.
Association with Alcohol Dependence
Based on the reported theta ERO deficits among alcohol dependent and high-risk subjects with limited alcohol exposure, it has been hypothesized that these oscillatory deficient responses antecede the development of alcoholism and may serve as an effective endophenotype to the condition [Rangaswamy and Porjesz, 2008]. Thus, the four SNPs identified above as potential genetic determinants of theta EROs were further examined for their association to alcohol dependence in both the GWAS sample and the family-based replication data (Table IV). For the GWAS samples, the association analysis for affected status (with principal components, age and sex as covariates in additive genetic effects model) produced one significant result among the four SNPs – rs7916403 from serotonin receptor gene HTR7 (P = 8.0 × 10⁻³). The alleles of rs7916403 are T and G, with T having a minor allele frequency of 0.49 (see Table III). The odds ratio (OR) for the G allele is 1.24 [95% CI: 1.06 – 1.45], with an increased OR of 1.32 [95% CI: 1.02 – 1.71] when tested for a full recessive model (P = 0.036), suggesting a significant recessive mode of genetic influence on the development of alcoholism by the HTR7 risk allele. Concordantly, the mean theta ERO value for the G/G homozygotes is 3.51 ± 1.11 μV, revealing a near significant oscillatory deficit (P = 0.084) relative to the combined mean for the other two genotype classes (3.62 ± 1.12 μV).
Table IV.
Association with Diagnoses of Alcohol Dependence for Additive and Full Recessive Effects Models
| GWAS Sample |
Replication Sample |
||||||||
|---|---|---|---|---|---|---|---|---|---|
| SNP | Gene | Additive OR (95% CI)a |
P-Value | Recessive OR (95% CI)c |
P-Value | Additive OR (95% CI)a |
P-Value | Recessive OR (95% CI)c |
P-Value |
| rs4907240 | ARID5A | 0.959 (0.799-1.150) | 0.648 | – | – | 0.965 (0.780-1.194) | 0.742 | – | – |
| rs13831 | GNAS1 | 1.022 (0.856-1.221) | 0.810 | – | – | 1.135 (0.923-1.397) | 0.231 | – | – |
| rs2294015 | ANXA13 | 0.982 (0.835-1.155) | 0.824 | – | – | 0.952 (0.794-1.141) | 0.592 | – | – |
| rs7916403 | HTR7 | 1.237 (1.057-1.447)b | 0.00804 | 1.310 (1.025-1.674)b | 0.0312 | 1.127 (0.941-1.350) | 0.194 | 1.368 (1.011-1.849) | 0.0420 |
Odds ratio (OR) for the minor allele (unless noted otherwise) under a standard additive genetic effects model.
OR for G allele of rs7916403.
OR for a full recessive genetic effects model for the G allele of rs7916403 (i.e., two-way test of G/G homozygotes versus G/T heterozygotes and T/T homozygotes).
For the family-based samples, no significant evidence of association was found for any of the four SNPs in an additive genetic model (with covariates age and sex), including the rs7916403 G risk allele (frequency of 0.52), which produced an OR of 1.13 [95% CI: 0.94 – 1.35; P = 0.19] for alcohol dependence. However, consistent with the results obtained for the case-control samples, significant evidence for an increased risk with the number of G alleles was observed for rs7916403, with an OR of 1.37 [95% CI: 1.01 – 1.85] for a full recessive model (P = 0.042). The mean theta ERO value for the G/G homozygotes is 3.85 ± 1.06 μV, again revealing an oscillatory deficit (P = 0.013), relative to the combined mean of the other two genotypes (4.04 ± 1.21 μV).
Population-Specific Effects of rs7916403
To explore the presence of population-specific effects of rs7916403, association analyses were conducted on the European-American subset, the largest ethnic group in the study samples. For the GWAS sample (N = 771), the association between theta EROs and rs7916403 (P = 9.97 × 10⁻⁴) is stronger than what was observed for the total GWAS, with a β coefficient of −0.18 [95% CI: −0.073 – −0.29] in the direction of the G allele. For European-Americans in the family-based replication sample (N = 862), the HTR7 risk allele (G) was also found to be significantly associated with theta ERO (P = 0.025), with a genetic effect of −0.12 [95% CI: −0.11 – −0.22]. Additionally, diagnoses for alcohol dependence were examined separately for European-Americans, revealing a significant OR of 1.27 [95% CI: 1.06 – 1.52] for the G allele in the GWAS subset (P = 0.011). When testing rs7916403 under a recessive mode of genetic effect, an increased OR of 1.39 [95% CI: 1.07 – 1.81] was observed (P = 0.015). For the replication sample, no significant evidence of association with alcohol dependence was found, although the effects remained in the direction of the risk allele: OR of 1.17 [95% CI: 0.95 – 1.15] for an additive genetic effects model (P = 0.15); and OR of 1.36 [95% CI: 0.94 – 1.96] under a recessive model (P = 0.10).
Haplotype-Based Association Analysis of Serotonin Receptor Gene HTR7
According to NCBI Build 36.3, the HTR7 gene is positioned between bp 92,490,555 and 92,607,651 on chromosome 10, with its three splice variants encoding either 3 or 4 exon regions and varying in the length of their carboxy terminal ends. A total of 35 SNPs encompassing HTR7 and its adjacent upstream and downstream regions (within 20 kb) met the QC standards in the GWAS. Of these, 22 SNPs capture all observed alleles at r2 ≥ 0.8 as determined by the program Tagger [de Bakker et al., 2005]. Based on the D’ confidence interval algorithm, five LD blocks were identified within the HTR7 gene, with rs7916403 incorporated into a 5.8 kb block in intron 1 that includes SNPs rs11186309 and rs1935351. Omnibus tests (H–1 degrees of freedom) were conducted on this LD block, revealing significant joint-haplotype association with alcohol dependence (P = 0.0074). When correcting for rs7916403, the association with alcoholism largely disappears (P = 0.098). Three alternate haplotypes were observed at this particular LD block (rs7916403-rs11186309-rs1935351), with G-T-G (frequency 0.51) producing a significant OR of 1.24 for alcohol dependence (P = 0.0081). When controlling for the G-T-G haplotype, the significant omnibus association with alcoholism once again disappears (P = 0.098).
DISCUSSION
This paper presents the first genome-wide association study of an ERO phenotype – frontal theta oscillations (Fz electrode) to visual targets in a visual oddball paradigm during the P300 response time window. Theta EROs have been related to fronto-limbic interactions associated with a complex set of cognitive functions, including conscious awareness, attention, memory-related processes, and frontal inhibitory control, and has exhibited marked energy reductions in alcoholics and their offspring [Jones et al., 2006b; Rangaswamy et al., 2007]. Significant linkage and association has been previously reported for CHRM2 and GRM8 polymorphisms for the theta ERO endophenotype and diagnoses (DSM-IV and ICD-10) of alcohol dependence [Jones et al., 2004, 2006a; Chen et al., 2009], implicating both the cholinergic and glutamatergic neurotransmitter systems. None of the top GWAS hits in the present study come from these two genes, but some promising signals are observed, including rs1362178 (P = 0.0034) from GRM8 and rs17168817 (P = 0.033) from CHRM2. None of the most associated markers (P < 0.01; N = 10) identified in these earlier studies were captured by the Illumina HumanHap 1M microarray and thus they could not be evaluated in the GWAS. Of the 18 previously reported SNPs associated with theta ERO and/or diagnoses of alcohol dependence, only rs2299498 from GRM8 (Chen et al., 2009) exhibits nominal significance (P = 0.028) in this study. Although these findings for CHRM2 and GRM8 are modest, they are not unexpected. Associations between GRM8 and CHRM2 and theta EROs were discovered primarily through linkage analysis, a method designed to detect a different set of genetic effects than those of GWAS [Manolio et al., 2009; Psychiatric GWAS Consortium Coordinating Committee, 2009]. In particular, if the previously observed linkage signals came from the joint effects of multiple rare or uncommon variants in these genes, we would not expect to detect these genes in GWAS studies, which are designed to capture associations with common variants.
The results from the GWAS and follow-up analyses implicate several genes influencing theta EROs that were not detected by previous linkage and association studies (Table III). Based on combined P-values, the most significant marker to emerge is rs4907240 located downstream of ARID5A (P = 3.7 × 10⁻⁶), with effect sizes of 0.25 ± 0.06 μV and 0.10 ± 0.06 μV for the minor allele in the GWAS and replication, respectively. The protein encoded by ARID5A belongs to a family of diverse proteins with recognized roles in development, tissue-specific gene expression, and cellular growth regulation [Wilsker et al., 2002; Patsialou et al., 2005], although with no reported role in brain development or neuroelectrical activity. In contrast, the next top-ranked SNP, rs13831, is within the 3′ UTR of GNAS1 (estimated coefficients of −0.21 ± 0.05 μV and −0.15 ± 0.05 μV), a locus with a complex, imprinted expression pattern for multiple transcripts, including the G-protein alpha subunit (GSα) involved in the cellular actions of neurotransmitters, autocrine/paracrine factors, and hormones [Bastepe, 2007; Plagge et al., 2008], as well as neuroendocrine secretory protein 55 (NESP55) that is transcribed exclusively from the maternal allele [Weiss et al., 2000]. Behavioral studies of mice with a knockout of the NESP55 transcript have revealed increased reactivity to novel environments, indicating a role of maternally expressed NESP55 in controlling exploratory and risk-taking behaviors and, given its distribution throughout the brain, raising the possibility that other types of behavior are under its influence [Plagge et al., 2005].
The other two significant SNPs to emerge from the two-stage association analysis are rs2294015, a non-synonymous variant of ANXA13 that encodes a phospholipid-binding protein involved in cellular growth and signal transduction (coefficients of 0.21 ± 0.05 μV and 0.09 ± 0.05 μV), and intronic rs7916403 from serotonin receptor gene HTR7 (effect sizes of 0.10 ± 0.05 μV and 0.17 ± 0.05 μV for the T allele). All four implicated SNPs were tested for association with alcohol dependence, with only rs7916403 showing a significant relationship to the disease under a recessive mode of genetic influence, with estimated ORs of 1.32 (P = 0.036) and 1.37 (P = 0.042) in the two samples (similar OR scores were observed for the European-American subsets). Haplotype-based testing of a 5.8 kb LD block encompassing the HTR7 variant lends support to this finding, revealing a significant joint-association to alcohol dependence (P = 0.0074) that weakens when the effects of rs7916403 are controlled for (P = 0.098).
The association signals observed at HTR7 are compelling, as they indicate important genetic effects on both neuroelectrical activity and the risk of alcohol dependence. Although the HTR7 marker shows a stronger association with theta band EROs in the family sample, this does not suggest that the association is only relevant to affected families but that the neuroelectrical effect at this locus is more easily detected on a genetic background with a higher load of AD risk alleles. The HTR7 gene encodes a G-protein-coupled neurotransmitter receptor of the serotonergic system. Serotonin (5-HT) is one of the most widely used neurotransmitters in the brain, whose effects are produced through its interaction with 14 membrane-bound receptors, including the most recently identified receptor 5-HT7, and has been implicated in the etiology of numerous psychiatric disease states, including depression, social phobia, schizophrenia, obsessive-compulsive, migraine, and eating disorders [Naughton et al., 2000; Hoyer et al., 2002; Nichols and Nichols, 2008]. The distribution of 5-HT7 binding sites in discrete areas of the brain, such as the limbic system and thalamocortical regions, overlaps the areas of neuroelectrical activity of theta EROs and suggests a possible role in pathophysiology of affective disorders. Three isoforms have been identified in humans [5-HT7(a), 5-HT7(b), and 5-HT7(d)], encoding proteins varying in the length of their carboxy terminal ends [Heidmann et al., 1997], although no differences have been observed in their signal transduction or tissue distribution [Jasper et al., 1997; Heidmann et al., 1998]. The development of 5-HT7 antagonists [Thomas et al., 2003] and the generation of a Htr7 knockout mouse [Hedlund et al., 2003] have revealed a role for the receptor in the control of circadian rhythms and sleep, as well as in modulating hippocampal neuronal functions such as learning and memory [Hedlund and Sutcliffe, 2004; Roberts et al., 2004; Sprouse et al., 2004; Thomas and Hagan, 2004; Cifariello et al., 2008; Eriksson et al., 2008]. Pharmacologically, 5-HT7 receptors have a high affinity for a number of antidepressants and antipsychotics, such as clozapine and risperidone [Roth et al., 1994], underscoring their potential role in the neurophysiology of psychiatric disorders. However, to date, purported human disease relationships with 5-HT7 have been limited to schizophrenia [Ikeda et al., 2006].
Hence, the association between HTR7 and alcohol dependence represents a novel insight into the genetic underpinnings of the disorder. Alcohol dependence is considered to be part of a wider spectrum of disinhibitory disorders that include externalizing behavior and substance abuse, with many neurochemical factors and pathways contributing to co-occurring disinhibitory personality traits. Presently, several common genetic determinants for neural oscillations and alcohol dependence have been discovered in the GABAergic, cholinergic, and glutamatergic systems (GABRA2, CHRM2, and GRM8, respectively). Based on the results of the present study, as well as pharmacological research [Buhot et al., 2000], the serotonergic system may serve as a key modulator of these interactive neuroelectrical systems, involved in different “cognitive pathways”, such as memory and learning processes, with the hippocampus and frontal cortex serving as the main target structures [Frodl-Bauch et al., 1999; Cifariello et al., 2008]. Moreover, administration of 5-HT7 antagonists in adolescent rats has been shown to enhance behavioral impulsivity, while agonist-induced activation of endogenous 5-HT7 significantly increased neurite length in striatal neuron primary cultures, suggesting remodeling of neuronal plasticity in brain reward circuits [Leo et al., 2009]. However, previous studies on human brain oscillation measures and alcohol dependence have not found any evidence of genetic association involving serotonin receptors. However, in a pair of recent genome-wide linkage studies, a significant linkage peak (LOD = 3.3) was identified at chromosome 10q23.3 – 10q24.1 for alcohol dependence in African-Americans [Gelernter et al., 2009], as well as a suggestive signal (LOD = 2.6) at 10q23.1 – 10q25.1 for a quantitative measure of alcoholism and illicit drug dependence [Agrawal et al., 2008], a region that encompasses the HTR7 gene.
In conclusion, this two-stage GWAS has identified four genes that may contribute to the expression of event-related theta oscillations measured in the frontal region of the brain and are worthy of further investigation: ARID5A, GNAS1, ANXA13, and HTR7. Of these four, the serotonin receptor gene HTR7 also appears to play a role in the risk for alcohol dependence, with a significant association emerging in the case-control samples for intronic marker rs7916403. The risk allele for rs7916403 has an OR of 1.24 for an additive measured genotype model, although significant recessive effects for diagnoses of alcohol dependence were detected for both sample sets that notably parallel the theta ERO deficits observed among corresponding T/T homozygotes. Haplotype-based tests of HTR7 LD blocks lend support to these findings, revealing significant omnibus association with alcohol dependence, with important effects contributed by the rs7916403 variant. Therefore, the results of the study are compelling, implicating the serotonergic system in the genetic susceptibility of alcohol dependence, although further research is needed to fully determine the functional importance of 5-HT7 in the generation of theta EROs and its contribution to the biological basis of alcohol dependence.
Supplementary Material
Supplementary Figure. LD plot showing 5-HT7 haplotype blocks. The r2 plot is for 35 variants from the HTR7 locus, identifying five LD blocks as defined by the D’ confidence interval algorithm, with rs7916403 located within the third block.
ACKNOWLEDGMENTS
The Collaborative Study on the Genetics of Alcoholism (COGA), Principal Investigators B. Porjesz, V. Hesselbrock, H. Edenberg, and L. Bierut, includes ten different centers: University of Connecticut (V. Hesselbrock); Indiana University (H.J. Edenberg, J. Nurnberger Jr., T. Foroud); University of Iowa (S. Kuperman, J. Kramer); SUNY Downstate (B. Porjesz); Washington University in St. Louis (L. Bierut, A. Goate, J. Rice, K. Bucholz); University of California at San Diego (M. Schuckit); Howard University (R. Taylor); Rutgers University (J. Tischfield); Southwest Foundation (L. Almasy); and Virginia Commonwealth University (D. Dick). A. Parsian and M. Reilly are the NIAAA Staff Collaborators. We continue to be inspired by our memories of Henri Begleiter and Theodore Reich, founding PI and Co-PI of COGA, including Ting-Kai Li, currently a consultant with COGA, P. Michael Conneally, Raymond Crowe, and Wendy Reich, for their critical contributions.
This national collaborative study is supported by the NIH Grant U10AA008401 from the National Institute on Alcohol Abuse and Alcoholism (NIAAA) and the National Institute on Drug Abuse (NIDA). Dr. Mark Zlojutro receives support from the Cowles Postdoctoral Fellowship (SFBR 09-1328-013). SOLAR is supported by R01 MH59490 from the National Institutes of Mental Health. Funding support for GWAS genotyping, which was performed at the Johns Hopkins University Center for Inherited Disease Research, was provided by the National Institute on Alcohol Abuse and Alcoholism, the NIH GEI (U01HG004438), and the NIH contract “High throughput genotyping for studying the genetic contributions to human disease” (HHSN268200782096C). Family-based genotyping was performed using the facilities of the Center for Medical Genomics at Indiana University School of Medicine, which is supported in part by the Indiana Genomics Initiative of Indiana University (INGEN®); INGEN is supported in part by The Lilly Endowment, Inc.
ABBREVIATIONS
- 5-HT7
5-hydroxytrptamine (serotonin) 7 receptor
- ACN9
Protein ACN9 homolog
- ADHD
attention-deficit/hyperactivity disorder
- ANXA13
annexin A13
- ARID5A
A-T Rich Interaction Domain protein 5A
- bp
base pair
- CDKN2B
cyclin-dependent kinase inhibitor 2B
- CEU
HapMap European-American population (Utah residents)
- CHB
HapMap Han Chinese population (Beijing)
- CHRM2
muscarinic cholinergic receptor 2
- CIDR
Center for Inherited Disease Research
- COGA
Collaborative Study on the Genetics of Alcoholism
- dbGaP
database of Genotypes and Phenotypes
- DNA
deoxyribonucleic acid
- DSM-IIIR
Diagnostic and Statistical Manual of Mental Disorders, Revised Third Edition
- DSM-IV
Diagnostic and Statistical Manual of Mental Disorders, Fourth Edition
- EEG
electroencephalogram
- ERK
extracellular signal-regulated kinase
- ERO
event-related oscillation
- ERP
event-related potential
- ESPERR
evolutionary and sequence pattern extraction through reduced representations
- GABRA2
GABAA neurotransmitter receptor alpha-2
- GC
genomic-control
- GNAS1
guanine nucleotide binding protein 1
- GRM8
metabotropic glutamate receptor type 8
- GWAS
genome-wide association study
- HMO
health maintenance organization
- Hz
hertz
- IBS
identical by state
- ICD-10
International Classification of Diseases, Tenth Version
- JNK
jun N-terminal protein kinase
- JPT
HapMap Japanese population (Tokyo)
- LD
linkage disequilibrium
- LOD
logarithm of odds
- MAF
minor allele frequency
- MAP
mitogen-activated protein
- MAS
McCune-Albright syndrome
- MDS
multidimensional scaling analysis
- MG
measured genotype
- ms
millisecond
- MTAP
methylthioadenosine phosphorylase
- NCBI
National Center for Biotechnology Information
- NESP55
neuroendocrine secretory protein 55
- NIAAA
National Institute on Alcohol Abuse and Alcoholism
- NIDA
National Institute on Drug Abuse
- NIH
National Institutes of Health
- OR
odds ratio
- P300
positive voltage deflection at latency of approximately 300 milliseconds
- PC
principal component
- PHP
pseudohypoparathyroidism
- Q-Q
quantile-quantile
- QTDT
quantitative transmission disequilibrium test
- QTLD
quantitative trait linkage disequilibrium
- SFBR
Southwest Foundation for Biomedical Research
- SNP
single nucleotide polymorphism
- SSAGA
Semi-Structured Assessment for the Genetics of Alcoholism
- SUDS3
subunit of histone deacetylase-dependent SIN3A
- SUNY
State University of New York
- TAOK3
TAO kinase 3
- TFR
time-frequency representation
- TFROI
time-frequency region of interest
- UTR
untranslated region
- YRI
HapMap Yoruba Population (Ibadan, Nigeria)
REFERENCES
- Abecasis GR, Cookson WO, Cardon LR. Pedigree tests of transmission disequilibrium. European Journal of Human Genetics. 2000;8(7):545–51. doi: 10.1038/sj.ejhg.5200494. [DOI] [PubMed] [Google Scholar]
- Agrawal A, Hinrichs AL, Dunn G, Bertelsen S, Dick DM, Saccone SF, Saccone NL, Grucza RA, Wang JC, Cloninger CR. Linkage scan for quantitative traits identifies new regions of interest for substance dependence in the Collaborative Study on the Genetics of Alcoholism (COGA) sample. Drug and Alcohol Dependence. 2008;93(1-2):12–20. doi: 10.1016/j.drugalcdep.2007.08.015. others. [DOI] [PMC free article] [PubMed] [Google Scholar]
- Almasy L, Blangero J. Multipoint quantitative-trait linkage analysis in general pedigrees. American Journal of Human Genetics. 1998;62(5):1198–211. doi: 10.1086/301844. [DOI] [PMC free article] [PubMed] [Google Scholar]
- Almasy L, Porjesz B, Blangero J, Chorlian DB, O’Connor SJ, Kuperman S, Rohrbaugh J, Bauer LO, Reich T, Polich J. Heritability of event-related brain potentials in families with a history of alcoholism. American Journal of Medical Genetics. 1999;88(4):383–90. others. [PubMed] [Google Scholar]
- American Psychiatric Association . Diagnostic and Statistical Manual of Mental Disorders. Revised Third Edition American Psychiatric Association; Washington, D.C.: 1987. [Google Scholar]
- American Psychiatric Association . Diagnostic and Statistical Manual of Mental Disorders. Fourth Edition American Psychiatric Association; Washington, D.C.: 1994. [Google Scholar]
- Barrett JC, Fry B, Maller J, Daly MJ. Haploview: analysis and visualization of LD and haplotype maps. Bioinformatics. 2005;21(2):263–5. doi: 10.1093/bioinformatics/bth457. [DOI] [PubMed] [Google Scholar]
- Basar E, Basar-Eroglu C, Karakas S, Schurmann M. Are cognitive processes manifested in event-related gamma, alpha, theta and delta oscillations in the EEG? Neuroscience Letters. 1999;259(3):165–8. doi: 10.1016/s0304-3940(98)00934-3. [DOI] [PubMed] [Google Scholar]
- Basar E, Basar-Eroglu C, Karakas S, Schurmann M. Brain oscillations in perception and memory. International Journal of Psychophysiology. 2000;35(2-3):95–124. doi: 10.1016/s0167-8760(99)00047-1. [DOI] [PubMed] [Google Scholar]
- Basar E, Basar-Eroglu C, Karakas S, Schurmann M. Gamma, alpha, delta, and theta oscillations govern cognitive processes. International Journal of Psychophysiology. 2001a;39(2-3):241–8. doi: 10.1016/s0167-8760(00)00145-8. [DOI] [PubMed] [Google Scholar]
- Basar E, Schurmann M, Sakowitz O. The selectively distributed theta system: functions. International Journal of Psychophysiology. 2001b;39(2-3):197–212. doi: 10.1016/s0167-8760(00)00141-0. [DOI] [PubMed] [Google Scholar]
- Bastepe M. The GNAS Locus: Quintessential Complex Gene Encoding Gsalpha, XLalphas, and other Imprinted Transcripts. Curr Genomics. 2007;8(6):398–414. doi: 10.2174/138920207783406488. [DOI] [PMC free article] [PubMed] [Google Scholar]
- Begleiter H, Porjesz B. Genetics of human brain oscillations. International Journal of Psychophysiology. 2006;60(2):162–71. doi: 10.1016/j.ijpsycho.2005.12.013. [DOI] [PubMed] [Google Scholar]
- Begleiter H, Porjesz B, Wang W. Event-related brain potentials differentiate priming and recognition to familiar and unfamiliar faces. Electroencephalography and Clinical Neurophysiology. 1995;94(1):41–9. doi: 10.1016/0013-4694(94)00240-l. [DOI] [PubMed] [Google Scholar]
- Boerwinkle E, Chakraborty R, Sing CF. The use of measured genotype information in the analysis of quantitative phenotypes in man. I. Models and analytical methods. Annals of Human Genetics. 1986;50(Pt 2):181–94. doi: 10.1111/j.1469-1809.1986.tb01037.x. [DOI] [PubMed] [Google Scholar]
- Bucholz KK, Cadoret R, Cloninger CR, Dinwiddie SH, Hesselbrock VM, Nurnberger JI, Jr., Reich T, Schmidt I, Schuckit MA. A new, semi-structured psychiatric interview for use in genetic linkage studies: a report on the reliability of the SSAGA. Journal of Studies on Alcohol. 1994;55(2):149–58. doi: 10.15288/jsa.1994.55.149. [DOI] [PubMed] [Google Scholar]
- Buhot MC, Martin S, Segu L. Role of serotonin in memory impairment. Annals of Medicine. 2000;32(3):210–21. doi: 10.3109/07853890008998828. [DOI] [PubMed] [Google Scholar]
- Buzsaki G. Rhythms of the Brain. Oxford University Press; New York: 2006. [Google Scholar]
- Chen AC, Tang Y, Rangaswamy M, Wang JC, Almasy L, Foroud T, Edenberg HJ, Hesselbrock V, Nurnberger J, Jr., Kuperman S. Association of single nucleotide polymorphisms in a glutamate receptor gene (GRM8) with theta power of event-related oscillations and alcohol dependence. American Journal of Medical Genetics Part B: Neuropsychiatric Genetics. 2009;150B(3):359–68. doi: 10.1002/ajmg.b.30818. others. [DOI] [PMC free article] [PubMed] [Google Scholar]
- Cifariello A, Pompili A, Gasbarri A. 5-HT(7) receptors in the modulation of cognitive processes. Behavioural Brain Research. 2008;195(1):171–9. doi: 10.1016/j.bbr.2007.12.012. [DOI] [PubMed] [Google Scholar]
- de Bakker PIW, Yelensky R, Pe’er I, Gabriel SB, Daly MJ, Altshuler D. Efficiency and power in genetic association studies. Nature Genetics. 2005;37:1217–23. doi: 10.1038/ng1669. [DOI] [PubMed] [Google Scholar]
- Devlin B, Roeder K. Genomic control for association studies. Biometrics. 1999;55(4):997–1004. doi: 10.1111/j.0006-341x.1999.00997.x. [DOI] [PubMed] [Google Scholar]
- Dick DM, Agrawal A, Wang JC, Hinrichs A, Bertelsen S, Bucholz KK, Schuckit M, Kramer J, Nurnberger J, Jr., Tischfield J. Alcohol dependence with comorbid drug dependence: genetic and phenotypic associations suggest a more severe form of the disorder with stronger genetic contribution to risk. Addiction. 2007;102(7):1131–9. doi: 10.1111/j.1360-0443.2007.01871.x. others. [DOI] [PubMed] [Google Scholar]
- Doppelmayr M, Klimesch W, Schwaiger J, Auinger P, Winkler T. Theta synchronization in the human EEG and episodic retrieval. Neuroscience Letters. 1998;257(1):41–4. doi: 10.1016/s0304-3940(98)00805-2. [DOI] [PubMed] [Google Scholar]
- Edenberg HJ, Dick DM, Xuei X, Tian H, Almasy L, Bauer LO, Crowe RR, Goate A, Hesselbrock V, Jones K. Variations in GABRA2, encoding the alpha 2 subunit of the GABA(A) receptor, are associated with alcohol dependence and with brain oscillations. American Journal of Human Genetics. 2004;74(4):705–14. doi: 10.1086/383283. others. [DOI] [PMC free article] [PubMed] [Google Scholar]
- Edenberg HJ, Foroud T. The genetics of alcoholism: identifying specific genes through family studies. Addiction Biology. 2006;11(3-4):386–96. doi: 10.1111/j.1369-1600.2006.00035.x. [DOI] [PubMed] [Google Scholar]
- Edenberg HJ, Koller DL, Xuei X, Wetherill L, McClintick JN, Almasy L, Bierut LJ, Bucholz KK, Goate A, Aliev F. Genome-wide association study of alcohol dependence implicates a region on chromosome 11. Alcoholism: Clinical and Experimental Research. 2010 doi: 10.1111/j.1530-0277.2010.01156.x. others. in press. [DOI] [PMC free article] [PubMed] [Google Scholar]
- Eriksson TM, Golkar A, Ekstrom JC, Svenningsson P, Ogren SO. 5-HT7 receptor stimulation by 8-OH-DPAT counteracts the impairing effect of 5-HT(1A) receptor stimulation on contextual learning in mice. European Journal of Pharmacology. 2008;596(1-3):107–10. doi: 10.1016/j.ejphar.2008.08.026. [DOI] [PubMed] [Google Scholar]
- Feighner JP, Robins E, Guze SB, Woodruff RA, Jr., Winokur G, Munoz R. Diagnostic criteria for use in psychiatric research. Archives of General Psychiatry. 1972;26(1):57–63. doi: 10.1001/archpsyc.1972.01750190059011. [DOI] [PubMed] [Google Scholar]
- Fisher RA. Statistical Methods for Research Workers. Oliver & Loyd; Loyd: 1925. [Google Scholar]
- Ford JM. Schizophrenia: the broken P300 and beyond. Psychophysiology. 1999;36(6):667–82. [PubMed] [Google Scholar]
- Ford JM, Sullivan EV, Marsh L, White PM, Lim KO, Pfefferbaum A. The relationship between P300 amplitude and regional gray matter volumes depends upon the attentional system engaged. Electroencephalography and Clinical Neurophysiology. 1994;90(3):214–28. doi: 10.1016/0013-4694(94)90093-0. [DOI] [PubMed] [Google Scholar]
- Foroud T, Edenberg HJ, Goate A, Rice J, Flury L, Koller DL, Bierut LJ, Conneally PM, Nurnberger JI, Bucholz KK. Alcoholism susceptibility loci: confirmation studies in a replicate sample and further mapping. Alcoholism, Clinical and Experimental Research. 2000;24(7):933–45. others. [PubMed] [Google Scholar]
- Fries P. A mechanism for cognitive dynamics: neuronal communication through neuronal coherence. Trends Cogn Sci. 2005;9(10):474–80. doi: 10.1016/j.tics.2005.08.011. [DOI] [PubMed] [Google Scholar]
- Frodl-Bauch T, Bottlender R, Hegerl U. Neurochemical substrates and neuroanatomical generators of the event-related P300. Neuropsychobiology. 1999;40(2):86–94. doi: 10.1159/000026603. [DOI] [PubMed] [Google Scholar]
- Gabriel SB, Schaffner SF, Nguyen H, Moore JM, Roy J, Blumenstiel B, Higgins J, DeFelice M, Lochner A, Faggart M. The structure of haplotype blocks in the human genome. Science. 2002;296(5576):2225–9. doi: 10.1126/science.1069424. others. [DOI] [PubMed] [Google Scholar]
- Ge D, Goldstein D. WGAViewer User’s Guide: Whole Genome Association Annotation Software Package. Version 1.25 2007. p. 58. [Google Scholar]
- Gelernter J, Kranzler HR, Panhuysen C, Weiss RD, Brady K, Poling J, Farrer L. Dense genomewide linkage scan for alcohol dependence in African Americans: significant linkage on chromosome 10. Biological Psychiatry. 2009;65:111–15. doi: 10.1016/j.biopsych.2008.08.036. [DOI] [PMC free article] [PubMed] [Google Scholar]
- Gevins A, Smith ME, Leong H, McEvoy L, Whitfield S, Du R, Rush G. Monitoring working memory load during computer-based tasks with EEG pattern recognition methods. Human Factors. 1998;40(1):79–91. doi: 10.1518/001872098779480578. [DOI] [PubMed] [Google Scholar]
- Gruber WR, Klimesch W, Sauseng P, Doppelmayr M. Alpha phase synchronization predicts P1 and N1 latency and amplitude size. Cerebral Cortex. 2005;15(4):371–7. doi: 10.1093/cercor/bhh139. [DOI] [PubMed] [Google Scholar]
- Gunderson KL, Steemers FJ, Ren H, Ng P, Zhou L, Tsan C, Chang W, Bullis D, Musmacker J, King C. Whole-genome genotyping. Methods in Enzymology. 2006;410:359–76. doi: 10.1016/S0076-6879(06)10017-8. others. [DOI] [PubMed] [Google Scholar]
- Harada J, Foley M, Moskowitz MA, Waeber C. Sphingosine-1-phosphate induces proliferation and morphological changes of neural progenitor cells. Journal of Neurochemistry. 2004;88(4):1026–39. doi: 10.1046/j.1471-4159.2003.02219.x. [DOI] [PubMed] [Google Scholar]
- Havill LM, Dyer TD, Richardson DK, Mahaney MC, Blangero J. The quantitative trait linkage disequilibrium test: a more powerful alternative to the quantitative transmission disequilibrium test for use in the absence of population stratification. BMC Genet. 2005;6(Suppl 1):S91. doi: 10.1186/1471-2156-6-S1-S91. [DOI] [PMC free article] [PubMed] [Google Scholar]
- Hedlund PB, Danielson PE, Thomas EA, Slanina K, Carson MJ, Sutcliffe JG. No hypothermic response to serotonin in 5-HT7 receptor knockout mice. Proceedings of the National Academy of Sciences of the United States of America. 2003;100(3):1375–80. doi: 10.1073/pnas.0337340100. [DOI] [PMC free article] [PubMed] [Google Scholar]
- Hedlund PB, Sutcliffe JG. Functional, molecular and pharmacological advances in 5-HT7 receptor research. Trends in Pharmacological Sciences. 2004;25(9):481–6. doi: 10.1016/j.tips.2004.07.002. [DOI] [PubMed] [Google Scholar]
- Heidmann DE, Metcalf MA, Kohen R, Hamblin MW. Four 5-hydroxytryptamine7 (5-HT7) receptor isoforms in human and rat produced by alternative splicing: species differences due to altered intron-exon organization. Journal of Neurochemistry. 1997;68(4):1372–81. doi: 10.1046/j.1471-4159.1997.68041372.x. [DOI] [PubMed] [Google Scholar]
- Heidmann DE, Szot P, Kohen R, Hamblin MW. Function and distribution of three rat 5-hydroxytryptamine7 (5-HT7) receptor isoforms produced by alternative splicing. Neuropharmacology. 1998;37(12):1621–32. doi: 10.1016/s0028-3908(98)00070-7. [DOI] [PubMed] [Google Scholar]
- Hesselbrock M, Easton C, Bucholz KK, Schuckit M, Hesselbrock V. A validity study of the SSAGA--a comparison with the SCAN. Addiction. 1999;94(9):1361–70. doi: 10.1046/j.1360-0443.1999.94913618.x. [DOI] [PubMed] [Google Scholar]
- Hoyer D, Hannon JP, Martin GR. Molecular, pharmacological and functional diversity of 5-HT receptors. Pharmacology, Biochemistry and Behavior. 2002;71(4):533–54. doi: 10.1016/s0091-3057(01)00746-8. [DOI] [PubMed] [Google Scholar]
- Iacono WG, Malone SM, McGue M. Substance use disorders, externalizing psychopathology, and P300 event-related potential amplitude. International Journal of Psychophysiology. 2003;48(2):147–78. doi: 10.1016/s0167-8760(03)00052-7. [DOI] [PubMed] [Google Scholar]
- Ikeda M, Iwata N, Kitajima T, Suzuki T, Yamanouchi Y, Kinoshita Y, Ozaki N. Positive association of the serotonin 5-HT7 receptor gene with schizophrenia in a Japanese population. Neuropsychopharmacology. 2006;31(4):866–71. doi: 10.1038/sj.npp.1300901. [DOI] [PubMed] [Google Scholar]
- Jasper JR, Kosaka A, To ZP, Chang DJ, Eglen RM. Cloning, expression and pharmacology of a truncated splice variant of the human 5-HT7 receptor (h5-HT7b) British Journal of Pharmacology. 1997;122(1):126–32. doi: 10.1038/sj.bjp.0701336. [DOI] [PMC free article] [PubMed] [Google Scholar]
- Jones KA, Porjesz B, Almasy L, Bierut L, Dick D, Goate A, Hinrichs A, Rice JP, Wang JC, Bauer LO. A cholinergic receptor gene (CHRM2) affects event-related oscillations. Behavior Genetics. 2006a;36(5):627–39. doi: 10.1007/s10519-006-9075-6. others. [DOI] [PubMed] [Google Scholar]
- Jones KA, Porjesz B, Almasy L, Bierut L, Goate A, Wang JC, Dick DM, Hinrichs A, Kwon J, Rice JP. Linkage and linkage disequilibrium of evoked EEG oscillations with CHRM2 receptor gene polymorphisms: implications for human brain dynamics and cognition. International Journal of Psychophysiology. 2004;53(2):75–90. doi: 10.1016/j.ijpsycho.2004.02.004. others. [DOI] [PubMed] [Google Scholar]
- Jones KA, Porjesz B, Chorlian D, Rangaswamy M, Kamarajan C, Padmanabhapillai A, Stimus A, Begleiter H. S-transform time-frequency analysis of P300 reveals deficits in individuals diagnosed with alcoholism. Clinical Neurophysiology. 2006b;117(10):2128–43. doi: 10.1016/j.clinph.2006.02.028. [DOI] [PubMed] [Google Scholar]
- Kanzawa T, Iwado E, Aoki H, Iwamaru A, Hollingsworth EF, Sawaya R, Kondo S, Kondo Y. Ionizing radiation induces apoptosis and inhibits neuronal differentiation in rat neural stem cells via the c-Jun NH2-terminal kinase (JNK) pathway. Oncogene. 2006;25(26):3638–48. doi: 10.1038/sj.onc.1209414. [DOI] [PubMed] [Google Scholar]
- Karakas S, Erzengin OU, Basar E. The genesis of human event-related responses explained through the theory of oscillatory neural assemblies. Neuroscience Letters. 2000a;285(1):45–8. doi: 10.1016/s0304-3940(00)01022-3. [DOI] [PubMed] [Google Scholar]
- Karakas S, Erzengin OU, Basar E. A new strategy involving multiple cognitive paradigms demonstrates that ERP components are determined by the superposition of oscillatory responses. Clinical Neurophysiology. 2000b;111(10):1719–32. doi: 10.1016/s1388-2457(00)00418-1. [DOI] [PubMed] [Google Scholar]
- Katsanis J, Iacono WG, McGue MK, Carlson SR. P300 event-related potential heritability in monozygotic and dizygotic twins. Psychophysiology. 1997;34(1):47–58. doi: 10.1111/j.1469-8986.1997.tb02415.x. [DOI] [PubMed] [Google Scholar]
- Klimesch W, Doppelmayr M, Pachinger T, Ripper B. Brain oscillations and human memory: EEG correlates in the upper alpha and theta band. Neuroscience Letters. 1997;238(1-2):9–12. doi: 10.1016/s0304-3940(97)00771-4. [DOI] [PubMed] [Google Scholar]
- Klimesch W, Doppelmayr M, Pachinger T, Russegger H. Event-related desynchronization in the alpha band and the processing of semantic information. Brain Research Cognitive Brain Research. 1997b;6(2):83–94. doi: 10.1016/s0926-6410(97)00018-9. [DOI] [PubMed] [Google Scholar]
- Klimesch W, Doppelmayr M, Yonelinas A, Kroll NE, Lazzara M, Rohm D, Gruber W. Theta synchronization during episodic retrieval: neural correlates of conscious awareness. Brain Research Cognitive Brain Research. 2001;12(1):33–8. doi: 10.1016/s0926-6410(01)00024-6. [DOI] [PubMed] [Google Scholar]
- Klimesch W, Schimke H, Schwaiger J. Episodic and semantic memory: an analysis in the EEG theta and alpha band. Electroencephalography and Clinical Neurophysiology. 1994;91(6):428–41. doi: 10.1016/0013-4694(94)90164-3. [DOI] [PubMed] [Google Scholar]
- Lachaux JP, Chavez M, Lutz A. A simple measure of correlation across time, frequency and space between continuous brain signals. Journal of Neuroscience Methods. 2003;123(2):175–88. doi: 10.1016/s0165-0270(02)00358-8. [DOI] [PubMed] [Google Scholar]
- Lange K, Weeks D, Boehnke M. Programs for Pedigree Analysis: MENDEL, FISHER, and dGENE. Genetic Epidemiology. 1988;5(6):471–2. doi: 10.1002/gepi.1370050611. [DOI] [PubMed] [Google Scholar]
- Leo D, Adriani W, Cavaliere C, Cirillo G, Marco EM, Romano E, di Porzio U, Papa M, Perrone-Capano C, Laviola G. Methylphenidate to adolescent rats drives enduring changes of accumbal Htr7 expression: implications for impulsive behavior and neuronal morphology. Genes, Brain and Behavior. 2009;8(3):356–68. doi: 10.1111/j.1601-183X.2009.00486.x. [DOI] [PubMed] [Google Scholar]
- Llinas R, Ribary U. Coherent 40-Hz oscillation characterizes dream state in humans. Proceedings of the National Academy of Sciences of the United States of America. 1993;90(5):2078–81. doi: 10.1073/pnas.90.5.2078. [DOI] [PMC free article] [PubMed] [Google Scholar]
- Makeig S, Westerfield M, Jung TP, Enghoff S, Townsend J, Courchesne E, Sejnowski TJ. Dynamic brain sources of visual evoked responses. Science. 2002;295(5555):690–4. doi: 10.1126/science.1066168. [DOI] [PubMed] [Google Scholar]
- Manolio TA, Collins FS, Cox NJ, Goldstein DA, Hindorff LA, Hunter DJ, McCarthy MI, Ramos EM, Cardon LR, Chakravarti A. Finding the missing heritability of complex diseases. Nature. 2009;461(7265):747–53. doi: 10.1038/nature08494. others. [DOI] [PMC free article] [PubMed] [Google Scholar]
- McCarley RW, Shenton ME, O’Donnell BF, Faux SF, Kikinis R, Nestor PG, Jolesz FA. Auditory P300 abnormalities and left posterior superior temporal gyrus volume reduction in schizophrenia. Archives of General Psychiatry. 1993;50(3):190–7. doi: 10.1001/archpsyc.1993.01820150036003. [DOI] [PubMed] [Google Scholar]
- Naughton M, Mulrooney JB, Leonard BE. A review of the role of serotonin receptors in psychiatric disorders. Hum Psychopharmacol. 2000;15(6):397–415. doi: 10.1002/1099-1077(200008)15:6<397::AID-HUP212>3.0.CO;2-L. [DOI] [PubMed] [Google Scholar]
- Nichols DE, Nichols CD. Serotonin receptors. Chemical Reviews. 2008;108(5):1614–41. doi: 10.1021/cr078224o. [DOI] [PubMed] [Google Scholar]
- Nurnberger JI, Jr., Wiegand R, Bucholz K, O’Connor S, Meyer ET, Reich T, Rice J, Schuckit M, King L, Petti T. A family study of alcohol dependence: coaggregation of multiple disorders in relatives of alcohol-dependent probands. Archives of General Psychiatry. 2004;61(12):1246–56. doi: 10.1001/archpsyc.61.12.1246. others. [DOI] [PubMed] [Google Scholar]
- O’Connell JR, Weeks DE. PedCheck: a program for identification of genotype incompatibilities in linkage analysis. American Journal of Human Genetics. 1998;63(1):259–66. doi: 10.1086/301904. [DOI] [PMC free article] [PubMed] [Google Scholar]
- O’Connor S, Morzorati S, Christian JC, Li TK. Heritable features of the auditory oddball event-related potential: peaks, latencies, morphology and topography. Electroencephalography and Clinical Neurophysiology. 1994;92(2):115–25. doi: 10.1016/0168-5597(94)90052-3. [DOI] [PubMed] [Google Scholar]
- Padmanabhapillai A, Porjesz B, Ranganathan M, Jones KA, Chorlian DB, Tang Y, Kamarajan C, Rangaswamy M, Stimus A, Begleiter H. Suppression of early evoked gamma band response in male alcoholics during a visual oddball task. International Journal of Psychophysiology. 2006a;60(1):15–26. doi: 10.1016/j.ijpsycho.2005.03.026. [DOI] [PubMed] [Google Scholar]
- Padmanabhapillai A, Tang Y, Ranganathan M, Rangaswamy M, Jones KA, Chorlian DB, Kamarajan C, Stimus A, Kuperman S, Rohrbaugh J. Evoked gamma band response in male adolescent subjects at high risk for alcoholism during a visual oddball task. International Journal of Psychophysiology. 2006b;62(2):262–71. doi: 10.1016/j.ijpsycho.2006.05.012. others. [DOI] [PubMed] [Google Scholar]
- Patsialou A, Wilsker D, Moran E. DNA-binding properties of ARID family proteins. Nucleic Acids Res. 2005;33(1):66–80. doi: 10.1093/nar/gki145. [DOI] [PMC free article] [PubMed] [Google Scholar]
- Plagge A, Isles AR, Gordon E, Humby T, Dean W, Gritsch S, Fischer-Colbrie R, Wilkinson LS, Kelsey G. Imprinted Nesp55 influences behavioral reactivity to novel environments. Molecular and Cellular Biology. 2005;25(8):3019–26. doi: 10.1128/MCB.25.8.3019-3026.2005. [DOI] [PMC free article] [PubMed] [Google Scholar]
- Plagge A, Kelsey G, Germain-Lee EL. Physiological functions of the imprinted Gnas locus and its protein variants Galpha(s) and XLalpha(s) in human and mouse. Journal of Endocrinology. 2008;196(2):193–214. doi: 10.1677/JOE-07-0544. [DOI] [PubMed] [Google Scholar]
- Polich J. Updating P300: an integrative theory of P3a and P3b. Clinical Neurophysiology. 2007;118(10):2128–48. doi: 10.1016/j.clinph.2007.04.019. [DOI] [PMC free article] [PubMed] [Google Scholar]
- Polich J, Herbst KL. P300 as a clinical assay: rationale, evaluation, and findings. International Journal of Psychophysiology. 2000;38(1):3–19. doi: 10.1016/s0167-8760(00)00127-6. [DOI] [PubMed] [Google Scholar]
- Porjesz B, Begleiter H. Genetic basis of event-related potentials and their relationship to alcoholism and alcohol use. Journal of Clinical Neurophysiology. 1998;15(1):44–57. doi: 10.1097/00004691-199801000-00006. [DOI] [PubMed] [Google Scholar]
- Porjesz B, Begleiter H, Reich T, Van Eerdewegh P, Edenberg HJ, Foroud T, Goate A, Litke A, Chorlian DB, Stimus A. Amplitude of visual P3 event-related potential as a phenotypic marker for a predisposition to alcoholism: preliminary results from the COGA Project. Collaborative Study on the Genetics of Alcoholism. Alcoholism, Clinical and Experimental Research. 1998;22(6):1317–23. others. [PubMed] [Google Scholar]
- Porjesz B, Rangaswamy M, Kamarajan C, Jones KA, Padmanabhapillai A, Begleiter H. The utility of neurophysiological markers in the study of alcoholism. Clinical Neurophysiology. 2005;116(5):993–1018. doi: 10.1016/j.clinph.2004.12.016. [DOI] [PubMed] [Google Scholar]
- Price AL, Patterson NJ, Plenge RM, Weinblatt ME, Shadick NA, Reich D. Principal components analysis corrects for stratification in genome-wide association studies. Nature Genetics. 2006;38(8):904–9. doi: 10.1038/ng1847. [DOI] [PubMed] [Google Scholar]
- Psychiatric GWAS Consortium Coordinating Committee Genomewide Association Studies: History, Rationale, and Prospects for Psychiatric Disorders. American Journal of Psychiatry. 2009;166:540–56. doi: 10.1176/appi.ajp.2008.08091354. [DOI] [PMC free article] [PubMed] [Google Scholar]
- Purcell S, Neale B, Todd-Brown K, Thomas L, Ferreira MA, Bender D, Maller J, Sklar P, de Bakker PI, Daly MJ. PLINK: a tool set for whole-genome association and population-based linkage analyses. American Journal of Human Genetics. 2007a;81(3):559–75. doi: 10.1086/519795. others. [DOI] [PMC free article] [PubMed] [Google Scholar]
- Purcell S, Daly MJ, Sham PC. WHAP: haplotype-based association analysis. Bioinformatics. 2007b;23(2):255–6. doi: 10.1093/bioinformatics/btl580. [DOI] [PubMed] [Google Scholar]
- Rangaswamy M, Jones KA, Porjesz B, Chorlian DB, Padmanabhapillai A, Kamarajan C, Kuperman S, Rohrbaugh J, O’Connor SJ, Bauer LO. Delta and theta oscillations as risk markers in adolescent offspring of alcoholics. International Journal of Psychophysiology. 2007;63(1):3–15. doi: 10.1016/j.ijpsycho.2006.10.00. others. [DOI] [PMC free article] [PubMed] [Google Scholar]
- Rangaswamy M, Porjesz B. Uncovering genes for cognitive (dys)function and predisposition for alcoholism spectrum disorders: a review of human brain oscillations as effective endophenotypes. Brain Research. 2008;1235:153–71. doi: 10.1016/j.brainres.2008.06.053. [DOI] [PMC free article] [PubMed] [Google Scholar]
- Reich T, Edenberg HJ, Goate A, Williams JT, Rice JP, Van Eerdewegh P, Foroud T, Hesselbrock V, Schuckit MA, Bucholz K. Genome-wide search for genes affecting the risk for alcohol dependence. American Journal of Medical Genetics. 1998;81(3):207–15. others. [PubMed] [Google Scholar]
- Roberts AJ, Krucker T, Levy CL, Slanina KA, Sutcliffe JG, Hedlund PB. Mice lacking 5-HT receptors show specific impairments in contextual learning. European Journal of Neuroscience. 2004;19(7):1913–22. doi: 10.1111/j.1460-9568.2004.03288.x. [DOI] [PubMed] [Google Scholar]
- Roth BL, Craigo SC, Choudhary MS, Uluer A, Monsma FJ, Jr., Shen Y, Meltzer HY, Sibley DR. Binding of typical and atypical antipsychotic agents to 5-hydroxytryptamine-6 and 5-hydroxytryptamine-7 receptors. Journal of Pharmacology and Experimental Therapeutics. 1994;268(3):1403–10. [PubMed] [Google Scholar]
- Rueda D, Navarro B, Martinez-Serrano A, Guzman M, Galve-Roperh I. The endocannabinoid anandamide inhibits neuronal progenitor cell differentiation through attenuation of the Rap1/B-Raf/ERK pathway. Journal of Biological Chemistry. 2002;277(48):46645–50. doi: 10.1074/jbc.M206590200. [DOI] [PubMed] [Google Scholar]
- Schurmann M, Basar-Eroglu C, Basar E. Gamma responses in the EEG: elementary signals with multiple functional correlates. Neuroreport. 1997;8(2):531–4. doi: 10.1097/00001756-199701200-00030. [DOI] [PubMed] [Google Scholar]
- Schurmann M, Basar-Eroglu C, Kolev V, Basar E. Delta responses and cognitive processing: single-trial evaluations of human visual P300. International Journal of Psychophysiology. 2001;39(2-3):229–39. doi: 10.1016/s0167-8760(00)00144-6. [DOI] [PubMed] [Google Scholar]
- Sprouse J, Reynolds L, Li X, Braselton J, Schmidt A. 8-OH-DPAT as a 5-HT7 agonist: phase shifts of the circadian biological clock through increases in cAMP production. Neuropharmacology. 2004;46(1):52–62. doi: 10.1016/j.neuropharm.2003.08.007. [DOI] [PubMed] [Google Scholar]
- Stockwell RG. Why use the ST. In: Rodino L, Schulze B-W, Wong MW, editors. Pseudo-Differential Operators: Partial Differential Equations and Time-Frequency Analysis. American Mathematical Society and Fields Institute for Research in Mathematical Sciences; Providence, RI: 2007. [Google Scholar]
- Stockwell RG, Mansinha L, Lowe RP. Localization of the complex spectrum: the S-transform. IEEE Trans Signal Process. 1996;44:998–1001. [Google Scholar]
- Taylor J, Tyekucheva S, King DC, Hardison RC, Miller W, Chiaromonte F. ESPERR: learning strong and weak signals in genomic sequence alignments to identify functional elements. Genome Research. 2006;16(12):1596–604. doi: 10.1101/gr.4537706. [DOI] [PMC free article] [PubMed] [Google Scholar]
- Thomas DR, Hagan JJ. 5-HT7 receptors. Curr Drug Targets CNS Neurol Disord. 2004;3(1):81–90. doi: 10.2174/1568007043482633. [DOI] [PubMed] [Google Scholar]
- Thomas DR, Melotto S, Massagrande M, Gribble AD, Jeffrey P, Stevens AJ, Deeks NJ, Eddershaw PJ, Fenwick SH, Riley G. SB-656104-A, a novel selective 5-HT7 receptor antagonist, modulates REM sleep in rats. British Journal of Pharmacology. 2003;139(4):705–14. doi: 10.1038/sj.bjp.0705290. others. [DOI] [PMC free article] [PubMed] [Google Scholar]
- Tomberg C, Desmedt JE. Human perceptual processing: inhibition of transient prefrontal-parietal 40 Hz binding at P300 onset documented in non-averaged cognitive brain potentials. Neuroscience Letters. 1998;255(3):163–6. doi: 10.1016/s0304-3940(98)00740-x. [DOI] [PubMed] [Google Scholar]
- Tsuang MT, Faraone SV. The frustrating search for schizophrenia genes. American Journal of Medical Genetics. 2000;97(1):1–3. doi: 10.1002/(sici)1096-8628(200021)97:1<1::aid-ajmg1>3.0.co;2-p. [DOI] [PubMed] [Google Scholar]
- Turnay J, Lecona E, Fernandez-Lizarbe S, Guzman-Aranguez A, Fernandez MP, Olmo N, Lizarbe MA. Structure-function relationship in annexin A13, the founder member of the vertebrate family of annexins. Biochemical Journal. 2005;389(Pt 3):899–911. doi: 10.1042/BJ20041918. [DOI] [PMC free article] [PubMed] [Google Scholar]
- van Beijsterveldt CE, Boomsma DI. Genetics of the human electroencephalogram (EEG) and event-related brain potentials (ERPs): a review. Human Genetics. 1994;94(4):319–30. doi: 10.1007/BF00201587. [DOI] [PubMed] [Google Scholar]
- van Beijsterveldt CE, Molenaar PC, de Geus EJ, Boomsma DI. Heritability of human brain functioning as assessed by electroencephalography. American Journal of Human Genetics. 1996;58(3):562–73. [PMC free article] [PubMed] [Google Scholar]
- Verleger R. Event-related potentials and cognition: a critique of the context updating hypothesis and an alternative interpretation of P3. Behavioral and Brain Sciences. 1988;11:84. [Google Scholar]
- Wang JC, Hinrichs AL, Stock H, Budde J, Allen R, Bertelsen S, Kwon JM, Wu W, Dick DM, Rice J. Evidence of common and specific genetic effects: association of the muscarinic acetylcholine receptor M2 (CHRM2) gene with alcohol dependence and major depressive syndrome. Human Molecular Genetics. 2004;13(17):1903–11. doi: 10.1093/hmg/ddh194. others. [DOI] [PubMed] [Google Scholar]
- Weiss U, Ischia R, Eder S, Lovisetti-Scamihorn P, Bauer R, Fischer-Colbrie R. Neuroendocrine secretory protein 55 (NESP55): alternative splicing onto transcripts of the GNAS gene and posttranslational processing of a maternally expressed protein. Neuroendocrinology. 2000;71(3):177–86. doi: 10.1159/000054535. [DOI] [PubMed] [Google Scholar]
- Williams JT, Begleiter H, Porjesz B, Edenberg HJ, Foroud T, Reich T, Goate A, Van Eerdewegh P, Almasy L, Blangero J. Joint multipoint linkage analysis of multivariate qualitative and quantitative traits. II. Alcoholism and event-related potentials. American Journal of Human Genetics. 1999;65(4):1148–60. doi: 10.1086/302571. [DOI] [PMC free article] [PubMed] [Google Scholar]
- Wilsker D, Patsialou A, Dallas PB, Moran E. ARID proteins: a diverse family of DNA binding proteins implicated in the control of cell growth, differentiation, and development. Cell Growth and Differentiation. 2002;13(3):95–106. [PubMed] [Google Scholar]
- World Health Organization . The ICD-10 Classification of Mental and Behavioural Disorders: Diagnostic Criteria for Research. WHO; Geneva: 1993. [Google Scholar]
- Zhang W, Chen T, Wan T, He L, Li N, Yuan Z, Cao X. Cloning of DPK, a novel dendritic cell-derived protein kinase activating the ERK1/ERK2 and JNK/SAPK pathways. Biochemical and Biophysical Research Communications. 2000;274(3):872–9. doi: 10.1006/bbrc.2000.3244. [DOI] [PubMed] [Google Scholar]
Associated Data
This section collects any data citations, data availability statements, or supplementary materials included in this article.
Supplementary Materials
Supplementary Figure. LD plot showing 5-HT7 haplotype blocks. The r2 plot is for 35 variants from the HTR7 locus, identifying five LD blocks as defined by the D’ confidence interval algorithm, with rs7916403 located within the third block.