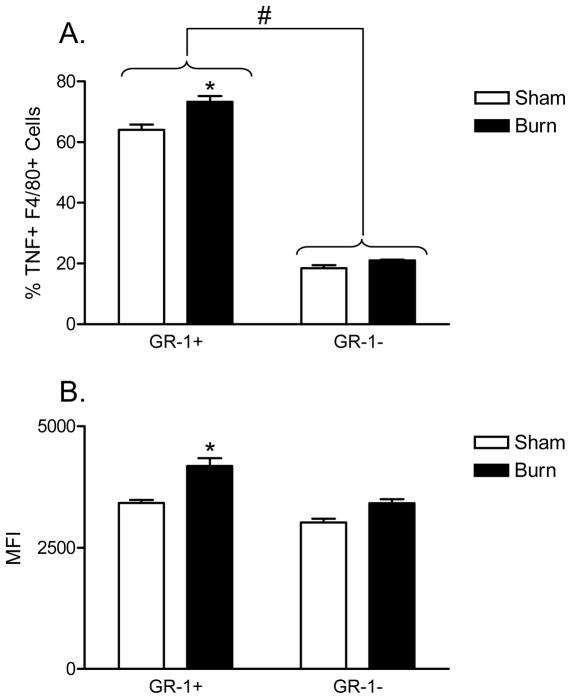
Figure 2. GR-1+ F4/80+ macrophages are principal producers of TNFα following burn injury with LPS stimulation at day 7 following injury.
Spleens from WT sham or burn injured mice were harvested at day 7 and splenocyte suspensions prepared. LPS, followed by Brefeldin A, was added to cultures to induce an in vitro two-hit effect. Cells were stained with fluorescently-labeled anti-GR-1, -F4/80, and intracellular -TNFα specific antibodies. The data plotted in (A) shows the percentage TNFα-expressing cells in GR-1+ versus GR-1− macrophages. The data plotted in (B) shows the MFI for TNFα staining in GR-1+ and GR-1− macrophages. There is a significantly higher percentage TNFα expression and expression levels (MFI) in GR-1+ F4/80+ macrophages from burn-injured mice as compared to GR-1+ F4/80+ sham (*p<0.01). There was no significant difference observed between sham or burn-injured mice in GR-1 F4/80+ macrophages (# p>0.05 ns). Overall, GR-1+ F4/80+ macrophages expressed higher levels of TNFα as compared withGR-1− F4/80+ macrophages (** p<0.001, One-Way ANOVA with Tukey’s multiple comparison). Data expressed as mean ± SEM of n=4 mice per group and are representative of 3 independent experiments.

