

Abstract
Localized delivery of therapeutic agents through the blood–brain barrier (BBB) is a clinically significant task that remains challenging. Ultrasound (US) application after intravenous administration of microbubbles has been shown to generate localized BBB opening in animal models, but the detailed mechanisms are not yet fully described. The current study investigates the effects of US-stimulated microbubbles on in vitro murine brain microvascular endothelial (bEnd.3) cells by monitoring sonoporation and changes in intracellular calcium concentration ([Ca2+]i) using real-time fluorescence and high-speed brightfield microscopy. Cells seeded in microchannels were exposed to a single US pulse (1.25 MHz, 10 cycles, 0.24 MPa peak negative pressure) in the presence of Definity™ microbubbles and extracellular calcium concentration [Ca2+]o = 0.9 mM. Disruption of the cell membrane was assessed using propidium iodide (PI) and change in the [Ca2+]i was measured using fura-2. Cells adjacent to a microbubble exhibited immediate [Ca2+]i changes after US pulse with and without PI uptake, and the [Ca2+]i changes were twice as large in cells with PI uptake. Cell viability assays showed that sonoporated cells could survive with modulation of [Ca2+]i and uptake of PI. Cells located near sonoporated cells were observed to exhibit changes in [Ca2+]i that were delayed from the time of US application and without PI uptake. These results demonstrate that US-stimulated microbubbles not only directly cause changes in [Ca2+]i in brain endothelial cells in addition to sonoporation, but also generate [Ca2+]i transients in cells not directly interacting with microbubbles, thereby affecting cells in larger regions beyond the cells in contact with microbubbles.
Keywords: Blood–brain barrier, Brain endothelial cells, Sonoporation, Ultrasound, Calcium imaging, Microbubble contrast agents, Fast-frame photography, Propidium iodide
INTRODUCTION
Delivery of therapeutic agents to targeted locations within the brain is critically important for effective treatment of neurological and neurodegenerative diseases. However, virtually all molecules with molecular weight higher than 400 Da, including many potent neurologically active substances and drugs, cannot reach the brain interstitium through the brain vasculature because of the blood–brain barrier (BBB) (Pardridge 2006). The impermeability of the BBB to these molecules results from the tight junctions that seal together adjacent brain endothelial cells and the highly-regulatory transport systems of the endothelial cell membranes (Abbott et al. 2006). Together these mechanisms maintain the ionic and volume regulation needed for proper synaptic and axonal signaling (Stewart and Tuor 1994), but also make the BBB the rate-limiting factor in drug delivery to the brain (Pardridge 2005). Hence the development of safe and efficient techniques to locally open the BBB and allow passage of otherwise non-permeable therapeutic agents to the brain interstitium could make significant impact in treating neurological diseases.
Different approaches have been exploited to achieve therapeutic concentration of drugs in the brain across the BBB, including the development of more hydrophobic drug analogs or linkage of an active compound to a specific carrier (Pardridge 2002) and intra-arterial injection of hyperosmotic mannitol to reversibly disrupt the BBB (Doolittle et al. 1998; Gumerlock et al. 1992; Kroll and Neuwelt 1998; Neuwelt et al. 1980; Rapoport et al. 1972; Roman-Goldstein et al. 1994; Zunkeler et al. 1996). However, these methods can cause disruptions within the entire tissue volume supplied by the injected arterial branch, thereby potentially causing unnecessary damage in locations other than the desired region of treatment.
In contrast, the application of focused ultrasound (US) following intravenous administration of microbubble ultrasound contrast agents (UCAs) has been demonstrated to generate localized BBB opening in animal models (Hynynen et al. 2005; Hynynen et al. 2001; Kinoshita et al. 2006a; Kinoshita et al. 2006b; McDannold et al. 2008; Sheikov et al. 2006; Sheikov et al. 2008; Sheikov et al. 2004), presenting an attractive and advantageous strategy for targeted delivery of therapeutics into the brain (Choi et al. 2007; Hynynen et al. 2005; McDannold et al. 2008; Ng and Liu 2002; Tachibana and Tachibana 2001). However, detailed understanding of the mechanisms and safety of US BBB disruption remain to be fully elucidated and demonstrated before the technique can be developed into a clinical strategy. In particular, the detail effects of US-driven microbubbles on the endothelial cells in the brain microvasculature system have not been available because of the lack of adequate techniques to study these inherently dynamic and micron- or submicron-scale interactions and processes in vivo.
Disruption of the cell membrane is one of the primary consequences generated by US-driven bubble activities and has been exploited for intracellular delivery of drugs and genes. US can also generate calcium transients (i.e. changes of intracellular calcium concentration ([Ca2+]i)) (Juffermans et al. 2006; Kumon et al. 2007; Tsukamoto et al. 2008), which include increase and recovery of [Ca2+]i, temporal [Ca2+]i oscillations, and spatial waves of [Ca2+]i changes. Calcium waves result in delayed [Ca2+]i changes in cells hundreds of microns away from the cells that directly interact with microbubbles tens of seconds after US application (Kumon et al. 2009).
These findings regarding US-induced [Ca2+]i can have significant implications because Ca2+ is an important second messenger and is involved in regulating many cellular processes and functions such as gene transcription, cell proliferation, fertilization, metabolism, cell migration, wound response, and phagocytosis in various types of cells (Berridge et al. 2003; Petty 2006). It is known that [Ca2+]i activities affect cell–cell contact (Gumbiner 1996), electrical resistance (Nigam et al. 1992; Shasby and Shasby 1986), ZO-1 tight junction protein migration from intracellular sites to the plasma membrane (Stuart et al. 1994), and tight junction assembly (Stuart et al. 1996) in epithelial and endothelial cells. In particular, regulation of [Ca2+]i plays a critical role in disrupting tight junctions between endothelial cells and BBB permeability (Abbott 1998; Bradbury 1993; Brown and Davis 2002; Hariri 1994; Olesen 1989; Revest et al. 1991). Studies of cultured brain endothelial cells have demonstrated that some vasoactive agents (e.g., histamine, bradykinin, endothelin) as well as certain nucleotides (e.g. adenosine triphosphate (ATP), adenosine diphosphate (ADP), uridine triphosphate (UTP)) that increase BBB permeability also cause elevation of [Ca2+]i (Abbott 1998; Abbott 2000; Paemeleire et al. 1999; Revest et al. 1991). Decreasing [Ca2+]i changes ZO-1/actin binding and alters the subcellular localization of occludin, while increasing [Ca2+]i from intracellular stores interferes with tight junction formation (Stuart et al. 1996). These results suggest that regulation of [Ca2+]i in brain microvascular endothelial cells is critical in mediating the BBB permeability. We are not aware of other studies that have examined the detailed bioeffects of US-driven microbubble activities in brain microvascular endothelial cells, despite the clear importance of the brain endothelial [Ca2+]i in controlling the BBB. Post-US ultrastructure examination (Sheikov et al. 2008) show that US exposure in the rat brain microvessels causes a disintegration of the tight junction molecular complexes of the cerebral microvascular endothelium, indicating the possible molecular mechanisms involved in US-induced BBB disruption. However no detail and dynamic information is currently available. Therefore the goal of our research is to investigate whether US-generated [Ca2+]i play an important role in US-induced BBB disruption. The current study aims to first characterize the change of [Ca2+]i produced by acoustic cavitation in brain microvascular endothelial cells in a controlled in vitro setting using fast-speed imaging and multi-wavelength, real-time fluorescence microscopy.
MATERIALS AND METHODS
Cell culture
bEnd.3 cells (American Type Culture Collection, Manassas, VA, USA), an immortalized mouse cell line generated from brain capillary endothelial cells (Montesano et al. 1990), were grown in the culture medium of Dulbecco’s modified Eagle’s medium (DMEM; Gibco Invitrogen, Carlsbad, CA) high glucose with 4.5 g/L D-glucose, L-glutamine and 110 mg/L sodium pyruvate, 10% fetal bovine serum (FBS), 100 U/mL penicillin, and 100 μg/mL streptomycin. Cells were maintained in a humidified cell culture incubator at 37°C and atmosphere of 5% CO2/95% air. The bEnd.3 cells in this study were within the passage range 24–32. For all experiments, cells were trypsinized and seeded into the inner-upper surface of a microchannel of height 800 μm and width 5 mm (μ-Slide I0.8 Luer, Ibidi GmbH, Munich, Germany) at a density of 5×10⁴ cells/ml in 200 μL of complete culture medium. Cells seeded into the channel were incubated under standard conditions before the experiments.
Microbubbles
Definity™ (Lantheus Medical Imaging, Billerca, MA) is a distribution of encapsulated microbubbles, each with a C3F8 gas core encapsulated by an outer phospholipid shell. Immediately after activation following the manufacturer’s protocol, the suspension contains approximately 1.2×10¹⁰ microbubbles/mL with mean diameter range of 1.1 μm–3.3 μm. For the current experiments, the solution was diluted with Dulbecco’s Phosphate-Buffered Saline solution (DPBS; 14040, Gibco Invitrogen, Carlsbad, CA) to have a final concentration of 106 microbubbles/mL. The bubble containing solution was injected into the microchannel. The microbubbles rose to the top of the channel by their natural buoyancy and came into contact with the cells. The experiments were conducted in an environment without flow.
Experimental setup
As shown in Fig. 1A, the cell-seeded microchannel was placed on a 37°C heating stage on an inverted microscope (Eclipse Ti-U, Nikon, Melville, NY). A 1.25 MHz planar circular transducer of 0.635 cm diameter (Advanced Devices, Wakefield, MA) was driven by a function generator (33250A, Agilent Technologies, Palo Alto, CA) and a 75 W power amplifier (75A250, Amplifier Research, Souderton, PA). The US pressure generated by the transducer was calibrated in free field using a 40 μm calibrated needle hydrophone (Precision Acoustics HPM04/1, UK). The transducer was positioned at an angle of approximately 45°, with its active surface submerged in water at a distance of 7 mm (natural focus) from the cells on the inner-upper surface of the microchannel to minimize standing-wave effects (inset in Fig. 1A). A spatial negative peak pressure of 0.24 MPa was used in our experiments. The effect of attenuation by the thin polycarbonate microchannel surface (~1.0 mm) is ignored. US-driven microbubble activities were captured using a high-speed camera (Fastcam SA1, Photron, San Diego, CA), which was mounted to the inverted microscope (Fig. 1A) and operated at 20,000 frames/s.
Figure 1.

Experimental system and procedure for imaging of sonoporation and [Ca2+]i using fast speed bright field videomicroscopy and real-time multi-wavelength fluorescence imaging. (A) Schematic diagram of experimental setup. The brain microvascular endothelial (bEnd.3) cells were seeded on the inner-upper surface of the microchannel and the solution containing microbubble US contrast agents and PI was filled through the inlet port of the microchannel. (B) Schematic diagram of the experimental protocol.
Fluorescence imaging
Real-time fluorescence imaging was performed using a monochromator (DeltaRAM X™, PTI, Birmingham, NJ) with 5 nm bandpass to repeatedly filter light from a 75 W xenon lamp at the various wavelengths of described below. The excitation light was directed through a 20× Super Fluor (MRF00200, Nikon, Melville, NY; NA 0.75) to the specimen and the light subsequently emitted from the cells was passed through a polychroic filter (73000v2, Chroma, Rockingham, VT) with passbands in the green and red. The resulting series of 16 bit photomicrographs were acquired with a cooled CCD camera (QuantEM, Photometrics, Tucson, AZ) at 512 × 512 resolution. The image acquisition and analysis from this camera were performed using the software package Easy Ratio Pro (PTI, Birmingham, NJ) and Image J 1.42 (The National Institutes of Health, Bethesda, MD). Image post-processing was performed using MetaFluor Analyst (Molecular Devices, Downingtown, PA) to obtain calibrated calcium images.
Measurement of US-induced change of [Ca2+]i
The method to measure changes in [Ca2+]i in this study is conceptually similar to the method described previously (Kumon et al. 2009). Briefly, bEnd.3 cells in the microchannel were loaded with complete culture medium containing 5 μM fura-2AM (Invitrogen, Carlsbad, CA) dissolved in DMSO with addition of 0.05% v/v of 10% w/v Pluronic F-127 (Invitrogen, Carlsbad, CA). After incubation for 60 minutes at 37°C, excess dye was removed by washing the cells three times with DPBS. To measure the [Ca2+]i, the ratio of intensities at 340 and 380 nm were measured with the CCD camera and calculated according to (Grynkiewicz et al. 1985)
| (1) |
where Kd = 265 nM, β = 8.44, Rmin = 0.01877, and Rmax = 1.418 were obtained by using a fura-2AM calibration kit (Invitrogen, Carlsbad, CA) without cells.
Assessment of US-induced cell membrane poration
Poration of cell membrane by US was assessed by intracellular uptake of the intercalating agent propidium iodide (PI) (Sigma Aldrich, St. Louis, MO) that is impermeable to intact cell membrane. After the cells were loaded with fura-2, PI was added to the extracellular solution to achieve a final concentration of 120 μM before US application. Poration of the cell membrane due to US was detected from PI fluorescence (emission at 610 nm with 539 nm excitation) that occurred after PI entered the cell cytoplasm and bound to intracellular nucleic acids. While pronounced PI fluorescence often indicates cell death with permanently damaged membrane, here transient and limited changes of PI fluorescence were also used as a marker for reversible cell membrane permeation. Cell viability was assessed using the Trypan blue assay.
Experimental protocol
The experimental protocol for monitoring US-driven microbubble activities and their corresponding effects on bEnd.3 cells is depicted in Fig. 1B. First, 0.05% v/v Definity™ and 120 μM PI were added in DPBS with extracellular calcium concentration [Ca2+]o = 0.9 mM after the cells were loaded with Fura-2AM. (The in vivo extracellular calcium concentration in the brain is in the range of 0.88 to 1.2 mM (Puka-Sundvall et al. 1994; Stokes et al. 1983)). An initial brightfield image was taken to confirm that a microbubble was in close proximity to a cell in the field of view. Second, fluorescence images were recorded while cells were excited sequentially at 340 nm, 380 nm, and 539 nm for 25 seconds. Third, a short period of brightfield imaging was performed during which a 1.25 MHz US tone burst (10 cycles or 8 μs duration, 0.24 MPa spatial negative peak pressure) was applied at t = 0 s. Fourth, fluorescence image recording continued up to t = 250 s to measure changes in [Ca2+]i and PI intensity. In some cases, to better observe the immediate [Ca2+]i changes and PI uptake induced by US, fluorescence imaging was continued from step 2 to 4 without interruption of brightfield imaging of microbubble dynamics.
Statistical analyses
The data obtained in the studies were expressed as mean ± standard deviation (SD). The results were analyzed for statistical significance of detected differences between groups using the unpaired Student’s t-test (Version 16, SPSS, Chicago, IL). The 2-sided P value was determined, testing the null hypothesisthat the two population means are equal. The reported P-values for the t-tests were performed assuming equal variance between groups, except where Levene’s test indicated likelihood of unequal variance (P < 0.05). P values less than 0.05 were considered to be statistically significant.
RESULTS
Control experiments
In the control experiments (n = 20) with no microbubbles or no US, cells had no PI uptake and no [Ca2+]i responses. Only those cells that were immediately adjacent to microbubbles exhibited changes in PI fluorescence or [Ca2+]i due to US application.
US-induced cell membrane poration and spatiotemporal change of [Ca2+]i
All of the cells that showed uptake of PI due to interactions with US-stimulated microbubbles exhibited changes in [Ca2+]i immediately (within the limit of the imaging frame rate) after the US burst. Figure 2 shows the typical results of PI uptake along with [Ca2+]i changes in a cell with an adjacent US-stimulated microbubble. The initial brightfield image (Fig. 2A) shows that a microbubble (inside the dotted white square box) was located on the membrane of Cell 2, while no microbubbles were located near Cells 1 and 3. The main bodies of Cells 1–3 are indicated by the dotted white line. High-speed brightfield images show that the microbubble adjacent to Cell 2 was fragmented into two smaller bubbles due to the US pulse (Fig. 2B). Figures 2C and 2D show the spatiotemporal response of the cells in terms of PI uptake and [Ca2+]i changes, respectively. The absence of PI intensity in the three cells before US application (top image in Fig. 2C) indicates their viability and intact membrane. Subsequent images in Fig. 2C show the PI uptake at 10, 15, 30 and 180 s after US application. The influx of PI into Cell 2 occurred from the membrane location near the microbubble and was followed by spreading out to larger areas within the cell during the 180 s after US application, while Cells 1 and 3 were unaffected in PI fluorescence intensity. The corresponding [Ca2+]i images show that all three cells had similar levels of [Ca2+]i (blue) before US application (Fig. 2D). At 10 s after US application, the [Ca2+]i was elevated in Cell 2 (red) which has PI uptakes (Fig. 2C). The [Ca2+]i increase appears also to first occur near the location of the microbubble and then spreads intracellularly. However, in the two cells without PI uptake, Cell 3 showed [Ca2+]i elevation (green) while Cell 1 did not (blue). After 180 s, the [Ca2+]i of Cell 3 recovered to its pre-US steady levels (blue), while Cell 2 remained elevated (green).
Figure 2.

US driven-microbubble activities produce membrane disruption and [Ca2+]i changes in a bEnd.3 cell. (A) Brightfield image before US application showing a microbubble located on the membane of Cell 2. (B) Enlarged high-speed images before, during, and after US exposure (50 μs time interval) showing the US-driven microbubble fragmented into smaller bubbles by a single US pulse of 10 cycles at 1.25 MHz and 0.24 MPa. (C) Time-lapse images of PI fluorescence. (D) Time-lapse images of [Ca2+]i. The circle outlines the microbubble on the membrane. The times are relative time after US application. The color bars in (C) and (D) indicate the PI intensity in arbitrary units and [Ca2+]i in nM, respectively. The scale bars in (A), (C) and (D) indicate 25 μm.
The time-dependent mean PI fluorescence intensity and [Ca2+]i in the regions of interest representing Cells 1, 2 and 3 in Fig. 2C and 2D are shown in Figs. 3A and 3B respectively. Fluorescence measurements were absent during brightfield imaging of microbubbles immediately before, during, and immediately after US exposure for a total of ~10 s, as indicated in the figures. Figure 3A clearly shows a significant increase of PI intensity in Cell 2 which reached a steady value (~300 A.U.) ~60 s after US application, indicating intracellular PI delivery via sonoporation. The [Ca2+]i also increased significantly in Cell 2, reaching its maximum at 19 s after US exposure before eventually decreasing to a value higher than its initial steady level (Fig. 3B). Without PI influx, Cell 3 exhibited an increased [Ca2+]i value that is approximately only one-third of the maximum in sonoporated Cell 2, before returning to its [Ca2+]i value prior to US exposure. Cell 1 showed no change in PI or [Ca2+]i.
Figure 3.

Temporal plots of mean PI fluorescence intensity and [Ca2+]i in cells with and without sonoporation. (A) Mean PI fluorescence intensity and (B) mean [Ca2+]i as a function of time for Cells 1 (with membrane disruption), 2 and 3 (without membrane disruption) within the regions of interest shown in Figs. 2C and D. The break indicates the period when light was directed to the high speed camera.
Similar [Ca2+]i transients and PI intensity change such as those seen in Cells 2 of Figs. 2 and 3 were observed in a total of 24 different cells during 7 independent experiments. In each case, a single microbubble was adjacent to each cell’s membrane, and high-speed brightfield imaging clearly showed a change in the bubble after the US pulse.
[Ca2+]i changes with and without membrane disruption
While the cells with membrane poration (as indicated by uptake of PI) showed an immediate change of [Ca2+]i induced by US-driven microbubbles, some cells exhibited an immediate change in [Ca2+]i without influx of PI. Of the 24 cell–microbubble pairs examined that showed immediate [Ca2+]i change, 14 cells exhibited uptake of PI while 10 cells did not. Figure 4 shows that the mean values of [Ca2+]i increase for cells with PI uptake are statistically different (P < 0.05) at each time point and about twice as high as the values of [Ca2+]i in cells without PI uptake. The recovery half-life, defined as the time required for the [Ca2+]i to decreased to half of its maximum value, was also statistically different (P < 0.05) between cells with (57.3 ± 25.6 s, n = 14) and without PI uptake (27.6 ± 8.13 s, n = 10).
Figure 4.
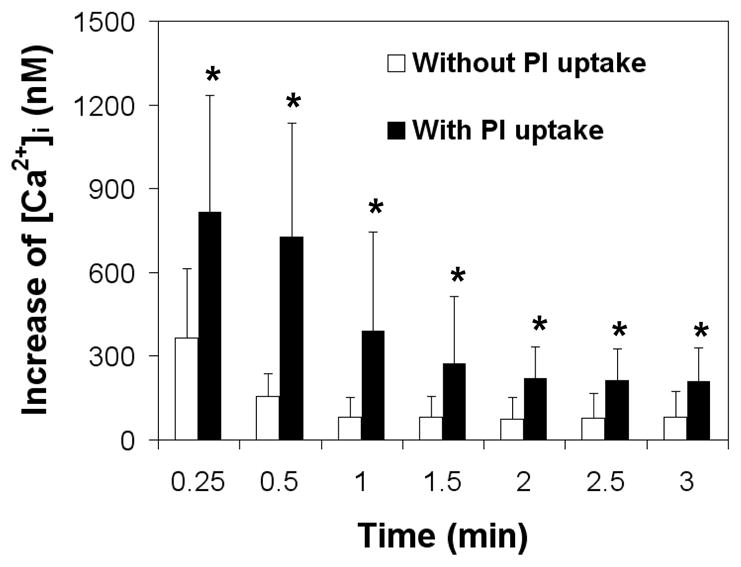
Different changes in Mean [Ca2+]i after sonoporation (1.25 MHz, 10 cycles, 0.24 MPa peak negative pressure) for cells with PI uptake (n = 14) and without PI uptake (n = 10). All the cells exhibited immediate change of [Ca2+]i after US application. The asterisk indicates P < 0.05 for a Student’s t-test between cells with and without PI uptake cells at each time point.
US-driven microbubble activities
Although detail process of the bubble oscillation and collapse was not captured due to the limited frame rate of bright field imaging (20K frames/s) used in this study, images captured immediately (50 μs) after the US burst show the effects of the US burst on the microbubbles adjacent to cells, In all the cases included in this experiment, the microbubbles either fragmented into smaller bubbles (e.g. Fig. 2B) or were seen to reduce to a smaller size after the US burst, indicating that the shell of the encapsulated microbubbles may have ruptured. The microbubbles responsible for the cells with PI uptake had a larger change (P = 0.07) in diameter (0.86 ± 0.4 μm, n = 14) than the microbubbles associated with the cells that had no PI uptake (0.48 ± 0.4 μm, n = 10). All of these cells had an immediate change in [Ca2+]i.
Cell viability after PI uptake via sonoporation
Figures 5 and 6 show different spatiotemporal changes and spatial-averaged intensity changes, respectively, in PI uptake and [Ca2+]i in a reversibly sonoporated cell (Cell 1 in Figs. 5A and 5B) and an irreversibly damaged cell (Cell 2 in Figs. 5C and 5D). Cell 1 survived after poration (cell viability confirmed by Trypan blue assay) and exhibited limited PI uptake (Fig. 5A and Fig. 6A) while Cell 2 was dying or dead with much more pronounced and essentially monotonically-increasing PI uptake (Fig. 5C and Fig. 6A). Cell death was confirmed by Trypan blue assay. For reference, a nearby cell that was dead before US application (Fig. 5E) had a high PI intensity as expected, with the PI concentrated mostly in the nucleus (note different color scale compared to cells in Fig. 5A and C). The [Ca2+]i levels in Figs. 5B, 5D, and 6B show a rise and recovery to a steady level in the recovered cell (Cell 1), in contrast with the approximately monotonic [Ca2+]i increase in non-recovered Cell 2. It is interesting to note the difference of spatiotemporal behaviors of [Ca2+]i and PI in Fig. 5C and D. The changes in [Ca2+]i appear to occur much faster than changes in PI intensity; the [Ca2+]i reaches its maximum by ~60 s (Fig. 6B), while the PI intensity continues to diffuse from the entry site even at 240 s.
Figure 5.

Spatiotemporal changes of PI fluorescence and [Ca2+]i in surviving and non-surviving cells affected by US (1.25 MHz, 10 cycles, 0.24 MPa). (A, B) PI and [Ca2+]i in a reversibly sonoporated cell, (C, D) PI and [Ca2+]i in an irreversibly damaged cell, (E) a cell that was dead before US. The pre-US PI images in (A), (C), and (E) are superimposed on the brightfield image taken prior to the start of fluorescence imaging. The color bar in each column indicates PI fluorescence intensity in arbitrary units and the [Ca2+]i in nM. The scale bar indicates 25 μm.
Figure 6.

Plots of mean PI intensity and [Ca2+]i showing difference for surviving and non-surviving cells. (A) Mean PI intensity and (B) mean [Ca2+]i vs. time for Cells 1, 2 and the dead cell for the regions of interest in Fig. 5 outlined by the dotted white lines on the main body of the cells.
The [Ca2+]i increase for the cells that remained viable after sonoporation is 816 ± 418 nM (N=14) before recovering to a steady value that was slightly higher than the initial level in several minutes and eventually returned to baseline (often > 10 minutes). The increase in PI fluorescence was observed to initiate and spread from the location of the microbubble. In many cases, PI intensity eventually reached a steady level, indicating permeation followed by membrane resealing (Deng et al. 2004) and consistent with continued cell viability. In other cases, the PI intensity increased monotonically, indicating permanent damage to the membrane (cell death confirmed by Trypan blue assay).
Calcium wave and delayed change in [Ca2+]i in cells without poration
In addition to the immediate onset of [Ca2+]i change in the cells with membrane poration as indicated by influx of PI, delayed [Ca2+]i modulation after US exposure was also detected in cells that were near these sonoporated cells but not adjacent to microbubbles themselves. Figures 7 and 8 show the spatiotemporal evolution of the PI uptake (Fig. 7A) and the changes in [Ca2+]i (Fig. 7B) in a group of cells, as well as the corresponding time traces for the mean fluorescence intensity within the regions of interest of 6 cells outlined in Fig. 7B (Fig. 8A and 8B). Prior to the application of US, no cells exhibited PI fluorescence and all the cells showed normal [Ca2+]i levels. As shown in Figs. 7A and B, Cell 1 exhibited an influx of PI and an immediate change in [Ca2+]i, indicating the occurrence of sonoporation of the cell. Subsequently, the nearby Cells 2–6 showed an increase in [Ca2+]i with delays of 5–9 s, but exhibited no sign of PI delivery, suggesting the origination of a calcium wave from the vicinity of the sonoporated Cell 1. The wave speed was estimated in the range of 12–15 μm/s. The [Ca2+]i in Cell 1 did not return to its pre-US level until 60 s after US, while the [Ca2+]i in all of the other cells returned to their initial steady level during this time interval.
Figure 7.
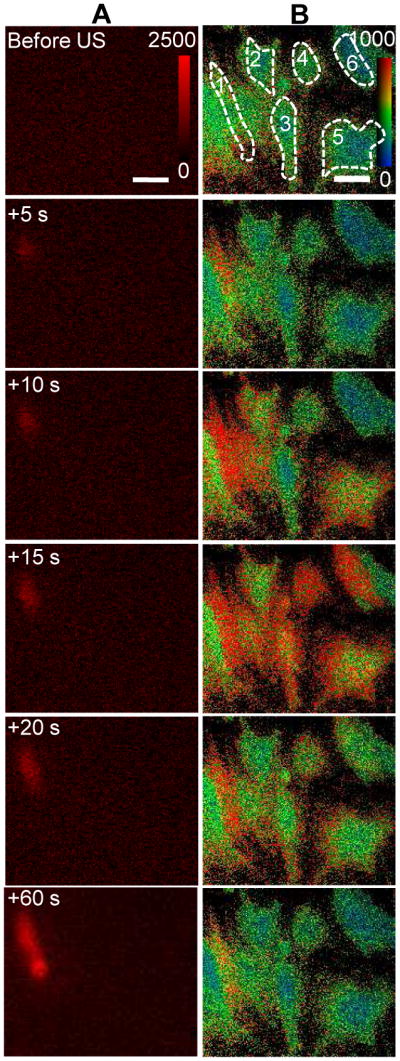
Calcium waves in b.End3 cells. (A) Time-lapse images of PI fluorescence showing Cell 1 with membrane disruption, (B) [Ca2+]i changes in Cell 1 with membrane disruption and the surrounding cells without membrane disruption. US tone burst is 1.25 MHz, 10 cycles, and 0.24 MPa peak negative pressure. The color bars in each column indicates the PI fluorescence intensity in arbitrary units and the [Ca2+]i in nM.
Figure 8.

Plots of PI fluorescence intensity and [Ca2+]i showing immediate and delayed changes of [Ca2+]i in b.End3 cells. (A) Mean PI fluorescence as a function of time for Cells 1–6 where Cell 1 had irreversible membrane disruption, (B) mean [Ca2+]i as a function of time for Cells 1–6, showing the immediate change in calcium (Cell 1) and delayed calcium change (Cells 2–6). The regions of interest for Cell 1–6 are shown in the Fig. 7B.
DISCUSSION
Mechanisms for US-induced [Ca2+]i changes in brain endothelial cells
Our results show that cells with PI uptake always exhibited immediate changes in [Ca2+]i. In these cases, at least some of the [Ca2+]i increase is attributable to the transport of Ca2+ through the membrane disruption along with the PI molecules. Previous studies, albeit under different US conditions, have shown that diffusion-based transport occurs through non-specific pores and is determined by the difference of calcium concentration inside and outside of the cell (Honda et al. 2004; Juffermans et al. 2006; Kumon et al. 2009). The observation of the high local [Ca2+]i value in the vicinity of the microbubble right after US application and the subsequent diffusion of Ca2+ to other areas of the cell (e.g., Cell 2 in Fig. 2D) is consistent with the diffusion of PI from the same vicinity. However, the more rapid changes in [Ca2+]i (e.g. Fig. 6B, Cell 1) than PI suggest differences in diffusion and binding kinetics, and may also suggest Ca2+ release from intracellular stores such as the endoplasmic reticulum (ER), mitochondria, or buffering proteins.
Our results also show that the immediate changes of [Ca2+]i generated by US-driven microbubbles can occur without PI uptake in brain endothelial cells. This indicate that US-driven microbubbles may be directly inducing [Ca2+]i changes without poration of the cell membrane. (The absence of PI fluorescence may indicate small disruption resulting in small amount of PI transported into the cells that was undetectable under the current experimental setup.)
Although direct evidence needs to be obtained in further studies, results from many other studies support the hypothesis of calcium release from internal stores. Changes of [Ca2+]i can be initiated via various biochemical, biophysical or biomechanical mechanisms, and sustained and regulated by the intracellular stores. In endothelial cells, mechanical stretching of the cell membrane causes elevation of [Ca2+]i initially by the activation of stretch-activated channels (SACs) and subsequently by Ca2+ release from intracellular stores (Naruse and Sokabe 1993).
Tran et al. have shown that oscillating microbubbles in the vicinity of a cell induced a mechanical pressure on the cell membrane, resulting in the activation of stretch SACs (Tran et al. 2008; Tran et al. 2007). Hence activation of mechanosensitive Ca2+ channels may be a possible explanation for changes in [Ca2+]i without influx of PI in brain endothelial cells. SAC activation may also contribute to [Ca2+]i changes when PI uptake does occur, although possibly to a lesser extent than the transport through relatively larger non-specific pores (~0.1 to 1 μm) (Joel et al. 2002; Prentice et al. 2005; Schlicher et al. 2006; Yanga et al. 2008; Zhao et al. 2008; Zhou et al. 2009). Therefore, the transient [Ca2+]i increase we observed may be a combination of Ca2+ influx through cell membrane disruption, Ca2+-permeable channels, and Ca2+ release from intracellular Ca2+ stores, induced by the mechanical impacts (e.g. shear stress) of US-driven bubble activities (rapid oscillation and/or collapse).
Delayed [Ca2+]i modulation without PI uptake after US exposure in cells that were near sonoporated cells but not adjacent to microbubbles (Figs. 7 and 8) is unlikely the direct result of cell membrane pores. Instead, these [Ca2+]i transients or “calcium waves” as observed previously in Chinese hamster ovary (CHO) cells (Kumon et al. 2009; Kumon et al. 2007) and in brain endothelial cells with mechanical stimulation (Paemeleire et al. 1999), could be propagated by both intercellular or extracellular messengers such as inositol triphosphate (IP3) and adenosine triphosphate from cell to cell through gap junctions (Boitano et al. 1992; Sanderson 1996; Sanderson et al. 1994) and ATP (Cotrina et al. 1998; Osipchuk and Cahalan 1992; Sauer et al. 2000). It is possible that damage to cells may release extracellular messengers which subsequently initiate calcium waves in the surrounding brain endothelial cells.
The observed immediate changes of [Ca2+]i generated by US-driven microbubbles occur without PI uptake in b.End3 cells, in contrast to results obtained in rat cardiomyoblast (H9c2) cells (Fan et al. 2010), for which [Ca2+]i changes only occurred with membrane disruption. SACs have been found in brain capillary endothelial cells and are permeable to Ca2+ (Popp et al. 1992) while nonspecific channel in H9c2 cells was stretch inactivated (Sipido and Marban 1991).
Significance of the findings
The study complements and expands upon previous work (Kumon et al. 2007; Kumon et al. 2009; Fan et al. 2010). The change of [Ca2+]i in brain microvascular endothelial cells occur with or without membrane disruption, which has not been observed in previous study using rat cardiomyoblast (H9c2) cells (Fan et al. 2010), indicating difference to US in terms of [Ca2+]i activities. The increased values of [Ca2+]i in our study are similar in range to the observed elevation in the [Ca2+]i of brain endothelial cells treated by bradykinin, histamine, mannitol and ATP which are known to increase the permeability of the BBB (Abbott 1998; Abbott 2000; Revest et al. 1991), about 180 to 1000 nM (Paemeleire et al. 1999). Our results provide foundation for further studies to investigate the role of US-generated [Ca2+]i activities in BBB disruption in order to reveal mechanistic insights to guide the development of safe US technology for drug delivery into the brain via the BBB through the vascular route.
Limitation of the study
This study has several limitations which suggest directions for future work. The brain endothelial cells were cultured in static condition. However, blood flow in the brain microvasculature generates shear stress on the endothelial cells (Desai et al. 2002), which affects homeostasis and pathophysiology of the cerebral microvasculature (Krizanac-Bengez et al. 2004). Difference in calcium wave by mechanical stimulation was found between primary and passaged cultures (Paemeleire et al. 1999). Thus the exact in vivo [Ca2+]i response to US-stimulated microbubbles could be different from in vitro results. Due to the limited imaging frame rate (20 K frames/s) used in this study, exact bubble dynamics (e.g. inertial cavitation vs. stable cavitation) could not be determined and their effect not quantified. This study uses US parameters to ensure high cell viability and the effects of various US conditions are not included. While basic characteristics of the phenomena are expected to remain similar, higher US pressure and longer duration can cause cell death and low US impact may not produce detectable effects.
CONCLUSION
US-driven Definity™ microbubbles can generate immediate [Ca2+]i changes in brain microvascular endothelial cells that are in direct contact with the microbubbles, which occurs with and without apparent cell membrane disruption. Delayed [Ca2+]i transients are also observed in cells located away from the cells that are directly impacted by US-driven microbubbles. Additional work is needed to determine whether the [Ca2+]i transients induced by US-stimulated microbubbles play significant role in the US-induced increase of BBB permeability.
Acknowledgments
This work was supported in part by the U. S. National Institutes of Health (R01CA116592 to C. X. Deng).
References
- Abbott NJ. Role of intracellular calcium in regulation of brain endothelial permeability. In: Pardridge WM, editor. Introduction to the blood-brain barrier: Methodology, biology and pathology. New York: Cambridge University Press; 1998. pp. 345–51. [Google Scholar]
- Abbott NJ. Inflammatory mediators and modulation of blood-brain barrier permeability. Cell Mol Neurobiol. 2000;20:131–47. doi: 10.1023/A:1007074420772. [DOI] [PMC free article] [PubMed] [Google Scholar]
- Abbott NJ, Rönnbäck L, Hansson E. Astrocyte–endothelial interactions at the blood–brain barrier. Nature Reviews Neuroscience. 2006;7:41–53. doi: 10.1038/nrn1824. [DOI] [PubMed] [Google Scholar]
- Berridge MJ, Bootman MD, Roderick HL. Calcium signalling: dynamics, homeostasis and remodelling. Nat Rev Mol Cell Biol. 2003;4:517–29. doi: 10.1038/nrm1155. [DOI] [PubMed] [Google Scholar]
- Boitano S, Dirksen E, Sanderson M. Intercellular propagation of calcium waves mediated by inositol trisphosphate. Science. 1992;258:292–5. doi: 10.1126/science.1411526. [DOI] [PubMed] [Google Scholar]
- Bradbury MW. The blood-brain barrier. Experimental Physiology. 1993;78:453–72. doi: 10.1113/expphysiol.1993.sp003698. [DOI] [PubMed] [Google Scholar]
- Brown RC, Davis TP. Calcium modulation of adherens and tight junction function: A potential mechanism for blood-brain barrier disruption after stroke. Stroke. 2002;33:1706–11. doi: 10.1161/01.str.0000016405.06729.83. [DOI] [PubMed] [Google Scholar]
- Choi JJ, Pernot M, Small SA, Konofagou EE. Noninvasive, transcranial and localized opening of the blood-brain barrier using focused ultrasound in mice. Ultrasound Med Biol. 2007;33:95–104. doi: 10.1016/j.ultrasmedbio.2006.07.018. [DOI] [PubMed] [Google Scholar]
- Cotrina ML, Lin JHC, Nedergaard M. Cytoskeletal assembly and ATP release regulate astrocytic calcium signaling. J Neurosci. 1998;18:8794–804. doi: 10.1523/JNEUROSCI.18-21-08794.1998. [DOI] [PMC free article] [PubMed] [Google Scholar]
- Deng C, Sieling F, Pan H, Cui J. Ultrasound-induced cell membrane porosity. Ultrasound Med Biol. 2004;30:519–26. doi: 10.1016/j.ultrasmedbio.2004.01.005. [DOI] [PubMed] [Google Scholar]
- Desai SY, Marroni M, Cucullo L, Krizanac-Bengez L, Mayberg MR, Hossain MT, Grant GG, Janigro D. Mechanisms of endothelial survival under shear stress. Endothelium. 2002;9:89–102. doi: 10.1080/10623320212004. [DOI] [PubMed] [Google Scholar]
- Doolittle ND, Petrillo A, Bell S, Cummings P, Eriksen S. Blood-brain barrier disruption for the treatment of malignant brain tumors: The National Program. J Neurosci Nurs. 1998;30:81–90. doi: 10.1097/01376517-199804000-00002. [DOI] [PubMed] [Google Scholar]
- Fan Z, Kumon RE, Park J, Deng CX. Intracellular delivery and calcium transients generated in sonoporation facilitated by microbubbles. Journal of Controlled Release. 2010;142:31–9. doi: 10.1016/j.jconrel.2009.09.031. [DOI] [PMC free article] [PubMed] [Google Scholar]
- Grynkiewicz G, Poenie M, Tsien RY. A new generation of Ca2+ indicators with greatly improved fluorescence properties. J Biol Chem. 1985;260:3440–50. [PubMed] [Google Scholar]
- Gumbiner BM. Cell adhesion: the molecular basis of tissue architecture and morphogenesis. Cell. 1996;84:345–57. doi: 10.1016/s0092-8674(00)81279-9. [DOI] [PubMed] [Google Scholar]
- Gumerlock MK, Belshe BD, Madsen R, Watts C. Osmotic blood-brain barrier disruption and chemotherapy in the treatment of high grade malignant glioma: patient series and literature review. J Neurooncol. 1992;12:33–46. doi: 10.1007/BF00172455. [DOI] [PubMed] [Google Scholar]
- Hariri R. Cerebral oedema. Neurosurg Clin North Am. 1994;5:687–706. [PubMed] [Google Scholar]
- Honda H, Kondo T, Zhao Q-L, Feril LB, Kitagawa H. Role of intracellular calcium ions and reactive oxygen species in apoptosis induced by ultrasound. Ultrasound in Medicine & Biology. 2004;30:683–92. doi: 10.1016/j.ultrasmedbio.2004.02.008. [DOI] [PubMed] [Google Scholar]
- Hynynen K, McDannold N, Sheikov NA, Jolesz FA, Vykhodtseva N. Local and reversible blood-brain barrier disruption by noninvasive focused ultrasound at frequencies suitable for trans-skull sonications. Neuroimage. 2005;24:12–20. doi: 10.1016/j.neuroimage.2004.06.046. [DOI] [PubMed] [Google Scholar]
- Hynynen K, McDannold N, Vykhodtseva N, Jolesz FA. Noninvasive MR imaging-guided focal opening of the blood-brain barrier in rabbits. Radiology. 2001;220:640–6. doi: 10.1148/radiol.2202001804. [DOI] [PubMed] [Google Scholar]
- Joel PR, Xiane C, Jen-Fu C, Yang J, Junru W. Optical and atomic force microscopic studies on sonoporation. The Journal of the Acoustical Society of America. 2002;111:1161–4. doi: 10.1121/1.1448340. [DOI] [PubMed] [Google Scholar]
- Juffermans LJ, Dijkmans PA, Musters RJ, Visser CA, Kamp O. Transient permeabilization of cell membranes by ultrasound-exposed microbubbles is related to formation of hydrogen peroxide. Am J Physiol Heart Circ Physiol. 2006;291:H1595–601. doi: 10.1152/ajpheart.01120.2005. [DOI] [PubMed] [Google Scholar]
- Kinoshita M, McDannold N, Jolesz FA, Hynynen K. Noninvasive localized delivery of Herceptin to the mouse brain by MRI-guided focused ultrasound-induced blood-brain barrier disruption. Proc Natl Acad Sci U S A. 2006a;103:11719–23. doi: 10.1073/pnas.0604318103. [DOI] [PMC free article] [PubMed] [Google Scholar]
- Kinoshita M, McDannold N, Jolesz FA, Hynynen K. Targeted delivery of antibodies through the blood-brain barrier by MRI-guided focused ultrasound. Biochem Biophys Res Commun. 2006b;340:1085–90. doi: 10.1016/j.bbrc.2005.12.112. [DOI] [PubMed] [Google Scholar]
- Krizanac-Bengez L, Mayberg MR, Janigro D. The cerebral vasculature as a therapeutic target for neurological disorders and the role of shear stress in vascular homeostatis and pathophysiology. Neurol Res. 2004;26:846–53. doi: 10.1179/016164104X3789. [DOI] [PubMed] [Google Scholar]
- Kroll RA, Neuwelt EA. Outwitting the blood-brain barrier for therapeutic purposes: osmotic opening and other means. Neurosurgery. 1998;42:1083–99. doi: 10.1097/00006123-199805000-00082. discussion 99–100. [DOI] [PubMed] [Google Scholar]
- Kumon RE, Aehle M, Sabens D, Parikh P, Han YW, Kourennyi D, Deng CX. Spatiotemporal effects of sonoporation measured by real-time calcium imaging. Ultrasound Med Biol. 2009;35:494–506. doi: 10.1016/j.ultrasmedbio.2008.09.003. [DOI] [PMC free article] [PubMed] [Google Scholar]
- Kumon RE, Aehle M, Sabens D, Parikh P, Kourennyi D, Deng CX. Ultrasound-induced calcium oscillations and waves in Chinese hamster ovary cells in the presence of microbubbles. Biophys J. 2007;93:L29–31. doi: 10.1529/biophysj.107.113365. [DOI] [PMC free article] [PubMed] [Google Scholar]
- McDannold N, Vykhodtseva N, Hynynen K. Blood-brain barrier disruption induced by focused ultrasound and circulating preformed microbubbles appears to be characterized by the mechanical index. Ultrasound Med Biol. 2008;34:834–40. doi: 10.1016/j.ultrasmedbio.2007.10.016. [DOI] [PMC free article] [PubMed] [Google Scholar]
- Montesano R, Pepper MS, Mohle-Steinlein U, Risau W, Wagner EF, Orci L. Increased proteolytic activity is responsible for the aberrant morphogenetic behavior of endothelial cells expressing the middle T oncogene. Cell. 1990;62:435–45. doi: 10.1016/0092-8674(90)90009-4. [DOI] [PubMed] [Google Scholar]
- Naruse K, Sokabe M. Involvement of stretch-activated ion channels in Ca2+ mobilization to mechanical stretch in endothelial cells. Am J Physiol Cell Physiol. 1993;264:C1037–44. doi: 10.1152/ajpcell.1993.264.4.C1037. [DOI] [PubMed] [Google Scholar]
- Neuwelt EA, Frenkel EP, Diehl J, Vu LH, Rapoport S, Hill S. Reversible osmotic blood-brain barrier disruption in humans: implications for the chemotherapy of malignant brain tumors. Neurosurgery. 1980;7:44–52. doi: 10.1227/00006123-198007000-00007. [DOI] [PubMed] [Google Scholar]
- Ng KY, Liu Y. Therapeutic ultrasound: its application in drug delivery. Med Res Rev. 2002;22:204–23. doi: 10.1002/med.10004. [DOI] [PubMed] [Google Scholar]
- Nigam SK, Rodriguez-Boulan E, Silver RB. Changes in intracellular calcium during the development of epithelial polarity and junctions. Proc Natl Acad Sci U S A. 1992;89:6162–6. doi: 10.1073/pnas.89.13.6162. [DOI] [PMC free article] [PubMed] [Google Scholar]
- Olesen S. An electrophysiological study of microvascular permeability and its modulation by chemical mediators. Acta Physiol Scand. 1989;136 (Suppl 579):1–28. [PubMed] [Google Scholar]
- Osipchuk Y, Cahalan M. Cell-to-cell spread of calcium signals mediated by ATP receptores in mast cells. Nature. 1992;359:241–4. doi: 10.1038/359241a0. [DOI] [PubMed] [Google Scholar]
- Paemeleire K, de Hemptinne A, Leybaert L. Chemically, mechanically, and hyperosmolarity-induced calcium responses of rat cortical capillary endothelial cells in culture. Experimental Brain Research. 1999;126:473–81. doi: 10.1007/s002210050755. [DOI] [PubMed] [Google Scholar]
- Pardridge WM. Drug and gene delivery to the brain: the vascular route. Neuron. 2002;36:555–8. doi: 10.1016/s0896-6273(02)01054-1. [DOI] [PubMed] [Google Scholar]
- Pardridge WM. The Blood-Brain Barrier: Bottleneck in brain drug development. NeuroRx. 2005;2:3–14. doi: 10.1602/neurorx.2.1.3. [DOI] [PMC free article] [PubMed] [Google Scholar]
- Pardridge WM. Introduction to the blood-brain barrier: methodology, biology and pathology. Cambridge University Press; 2006. [Google Scholar]
- Petty HR. Spatiotemporal chemical dynamics in living cells: from information trafficking to cell physiology. Biosystems. 2006;83:217–24. doi: 10.1016/j.biosystems.2005.05.018. [DOI] [PubMed] [Google Scholar]
- Popp R, Hoyer J, Meyer J, Galla HJ, Gögelein H. Stretch-activated non-selective cation channels in the antiluminal membrane of porcine cerebral capillaries. J Physiol. 1992;454:435–49. doi: 10.1113/jphysiol.1992.sp019272. [DOI] [PMC free article] [PubMed] [Google Scholar]
- Prentice P, Cuschieri A, Dholakia K, Prausnitz M, Campbell P. Membrane disruption by optically controlled microbubble cavitation. Nature Physics. 2005;1:107–10. [Google Scholar]
- Puka-Sundvall M, Hagberg H, Andin P. Changes in extracellular calcium concentration in the immature rat cerebral cortex during anoxia are not influenced by MK-801. Developmental Brain Research. 1994;77:146–50. doi: 10.1016/0165-3806(94)90223-2. [DOI] [PubMed] [Google Scholar]
- Rapoport SI, Bachman DS, Thompson HK. Chronic effects of osmotic opening of the blood-brain barrier in the monkey. Science. 1972;176:1243–5. doi: 10.1126/science.176.4040.1243. [DOI] [PubMed] [Google Scholar]
- Revest P, Abbott N, Gillespie J. Receptor-mediated changes in intracellular [Ca2+] in cultured rat brain capillary endothelial cells. Brain Res. 1991;549:159–61. doi: 10.1016/0006-8993(91)90614-2. [DOI] [PubMed] [Google Scholar]
- Roman-Goldstein S, Clunie DA, Stevens J, Hogan R, Monard J, Ramsey F, Neuwelt EA. Osmotic blood-brain barrier disruption: CT and radionuclide imaging. AJNR Am J Neuroradiol. 1994;15:581–90. [PMC free article] [PubMed] [Google Scholar]
- Sanderson M. Intercellular waves of communication. Nes Physiol Sci. 1996;11:262–9. [Google Scholar]
- Sanderson M, Charles A, Boitano S, Dirksen E. Mechanisms and function of intercellular calcium signaling. Mol Cell Endocrinol. 1994;98:173–87. doi: 10.1016/0303-7207(94)90136-8. [DOI] [PubMed] [Google Scholar]
- Schlicher RK, Radhakrishna H, Tolentino TP, Apkarian RP, Zarnitsyn V, Prausnitz MR. Mechanism of intracellular delivery by acoustic cavitation. Ultrasound in Medicine & Biology. 2006;32:915–24. doi: 10.1016/j.ultrasmedbio.2006.02.1416. [DOI] [PubMed] [Google Scholar]
- Shasby DM, Shasby SS. Effects of calcium on transendothelial albumin transfer and electrical resistance. J Appl Physiol. 1986;60:71–9. doi: 10.1152/jappl.1986.60.1.71. [DOI] [PubMed] [Google Scholar]
- Sheikov N, McDannold N, Jolesz F, Zhang YZ, Tam K, Hynynen K. Brain arterioles show more active vesicular transport of blood-borne tracer molecules than capillaries and venules after focused ultrasound-evoked opening of the blood-brain barrier. Ultrasound Med Biol. 2006;32:1399–409. doi: 10.1016/j.ultrasmedbio.2006.05.015. [DOI] [PubMed] [Google Scholar]
- Sheikov N, McDannold N, Sharma S, Hynynen K. Effect of focused ultrasound applied with an ultrasound contrast agent on the tight junctional integrity of the brain microvascular endothelium. Ultrasound Med Biol. 2008;34:1093–104. doi: 10.1016/j.ultrasmedbio.2007.12.015. [DOI] [PMC free article] [PubMed] [Google Scholar]
- Sheikov N, McDannold N, Vykhodtseva N, Jolesz F, Hynynen K. Cellular mechanisms of the blood-brain barrier opening induced by ultrasound in presence of microbubbles. Ultrasound Med Biol. 2004;30:979–89. doi: 10.1016/j.ultrasmedbio.2004.04.010. [DOI] [PubMed] [Google Scholar]
- Stewart PA, Tuor UI. Blood-eye barriers in the rat: correlation of ultrastructure with function. J Comp Neurol. 1994;340:566–76. doi: 10.1002/cne.903400409. [DOI] [PubMed] [Google Scholar]
- Stokes BT, Fox P, Hollinden G. Extracellular calcium activity in the injured spinal cord. Experimental Neurology. 1983;80:561–72. doi: 10.1016/0014-4886(83)90307-2. [DOI] [PubMed] [Google Scholar]
- Stuart RO, Sun A, Bush KT, Nigam SK. Dependence of epithelial intercellular junction biogenesis on thapsigargin-sensitive intracellular calcium stores. J Biol Chem. 1996;271:13636–41. doi: 10.1074/jbc.271.23.13636. [DOI] [PubMed] [Google Scholar]
- Stuart RO, Sun A, Panichas M, Hebert SC, Brenner BM, Nigam SK. Critical role for intracellular calcium in tight junction biogenesis. J Cell Physiol. 1994;159:423–33. doi: 10.1002/jcp.1041590306. [DOI] [PubMed] [Google Scholar]
- Tachibana K, Tachibana S. The use of ultrasound for drug delivery. Echocardiography. 2001;18:323–8. doi: 10.1046/j.1540-8175.2001.00323.x. [DOI] [PubMed] [Google Scholar]
- Tran TA, Le Guennec JY, Bougnoux P, Tranquart F, Bouakaz A. Characterization of cell membrane response to ultrasound activated microbubbles. Ultrasonics, Ferroelectrics and Frequency Control, IEEE Transactions on. 2008;55:43–9. doi: 10.1109/TUFFC.2008.615. [DOI] [PubMed] [Google Scholar]
- Tran TA, Roger S, Le Guennec JY, Tranquart F, Bouakaz A. Effect of ultrasound-activated microbubbles on the cell electrophysiological properties. Ultrasound in Medicine & Biology. 2007;33:158–63. doi: 10.1016/j.ultrasmedbio.2006.07.029. [DOI] [PubMed] [Google Scholar]
- Tsukamoto A, Yasui N, Watanabe Y, Furukawa K, Ushida T. Real-time imaging of interaction between microbubble and cell under therapeutic ultrasound radiation. In: Hierlemann A, editor. Sixth IASTED International Conference. Innsbruck, Austria: Acta Press; 2008. pp. 334–7. [Google Scholar]
- Yanga F, Gua N, Chenb D, Xic X, Zhangc D, Lia Y, Wu J. Experimental study on cell self-sealing during sonoporation. Journal of Controlled Release. 2008;131:205–10. doi: 10.1016/j.jconrel.2008.07.038. [DOI] [PubMed] [Google Scholar]
- Zhao Y-Z, Luo Y-K, Lu C-T, Xu J-F, Tang J, Zhang M, Zhang Y, Liang H-D. Phospholipids-based microbubbles sonoporation pore size and reseal of cell membrane cultured in vitro. Journal of Drug Targeting. 2008;16:18–25. doi: 10.1080/10611860701637792. [DOI] [PubMed] [Google Scholar]
- Zhou Y, Kumon RE, Cui J, Deng CX. The Size of Sonoporation Pores on the Cell Membrane. Ultrasound Med Biol. 2009 doi: 10.1016/j.ultrasmedbio.2009.05.012. (in press) [DOI] [PMC free article] [PubMed] [Google Scholar]
- Zunkeler B, Carson RE, Olson J, Blasberg RG, DeVroom H, Lutz RJ, Saris SC, Wright DC, Kammerer W, Patronas NJ, Dedrick RL, Herscovitch P, Oldfield EH. Quantification and pharmacokinetics of blood-brain barrier disruption in humans. J Neurosurg. 1996;85:1056–65. doi: 10.3171/jns.1996.85.6.1056. [DOI] [PubMed] [Google Scholar]