Abstract
The effect of the 1918 influenza pandemic on other diseases is a neglected topic in historical epidemiology. This paper takes up the hypothesis that the influenza pandemic affected the long-term decline of tuberculosis though selective mortality, such that many people with tuberculosis were killed in 1918, depressing subsequent tuberculosis mortality and transmission. Regularly-collected vital statistics data on mortality of influenza and tuberculosis in the US are presented and analyzed demographically. The available population-level data fail to contradict the selection hypothesis. More work is needed to understand fully the role of multiple morbidities in the 1918 influenza pandemic.
Keywords: mortality, demography, 1918 pandemic, influenza, tuberculosis, age, period, cohort, Lexis surface, selection
1. Background and Introduction
“During 1918 and 1919 there was a sharp upward trend to the curve [of tuberculosis death rates], followed in a year, or at most two years, by a marked downward direction of the curve — much steeper in its descent than that preceding 1917–1918. … The pandemic of influenza of 1918–19 carried off, in a brief period, a large number of tuberculosis subjects that would otherwise have lived on and their deaths been so distributed through later years as not materially to have disturbed the uniform downward direction of the tuberculosis curve that precede the period of the great pandemic.”
We hypothesize that the 1918 influenza pandemic hastened the decline of tuberculosis in the United States. The proposed mechanism is a harvesting effect whereby many people with tuberculosis were killed during the increased mortality of 1918, thus reducing tuberculosis mortality and transmission in later years. This phenomenon was described by Abbott (1922) (quoted above), and independently rediscovered by Noymer and Garenne (2000). This paper is an elaboration of that work. Routinely-collected US vital statistics data on cause-specific mortality by age and sex for the first half of the twentieth century are presented. These data are analyzed to show that the most salient patterns of cause-, sex-, age-, and period-specific mortality are highly consistent with the proposed harvesting or selection mechanism. The available demographic data support the selection hypothesis in the US, but that more work is needed, especially along the lines of collecting representative individual-level data.
The selective mortality hypothesis does not hold that tuberculosis alone was responsible for the severe mortality of the 1918 influenza pandemic. Annual winter influenza epidemics and high tuberculosis prevalence were present throughout the early twentieth century. Having both together did not create the unusual properties of the 1918 pandemic. The selective mortality hypothesis concerns the consequences of the pandemic for other diseases, especially tuberculosis, not the causes of the unusual severity of the 1918 pandemic.
The selective mortality hypothesis views the 1918 influenza pandemic as a pivot point in the decline of tuberculosis in the US. Tuberculosis mortality was in decline in the US since at least the mid-nineteenth century. The overall decline was greatly accelerated by the 1918 pandemic, but the process would have continued, albeit more slowly, even if the 1918 pandemic had not occurred. One reason the selection hypothesis is noteworthy, and merits the elaboration herein, is that the contemporary literature on the decline of tuberculosis in the US (see for example Comstock 1975) does not mention the 1918 influenza pandemic (the above quotation being an exception). This paper specifically deals with tuberculosis. All-cause mortality, as it relates to the selection hypothesis, is discussed in Noymer (2010), and in the references therein.
2. Data and methods
Data in this paper come from a compendium of cause-specific death rates for the United States for the first half of the twentieth century (U.S. Department of Health, Education, and Welfare, 1956). These data are for the death registration area of the US; overseas military deaths are excluded (Grove and Hetzel 1968). The tuberculosis data are for all forms of the disease, and all data are for calendar years. Seasonal- and trend-adjusted ‘excess’ mortality is often used when analyzing influenza mortality, but not tuberculosis, so in order to compare like with like, calendar-year data are used for both diseases. The method of analysis is exploratory data analysis (Tukey 1977). A Lexis surface is a graphical device cross-classifying vital rates (mortality in this case) by age and period (Arthur and Vaupel 1984, and see online supplement). These are presented for tuberculosis mortality, by sex. All rates are per 100,000.
3. Results
3.1. Overlap of tuberculosis and influenza in 1918
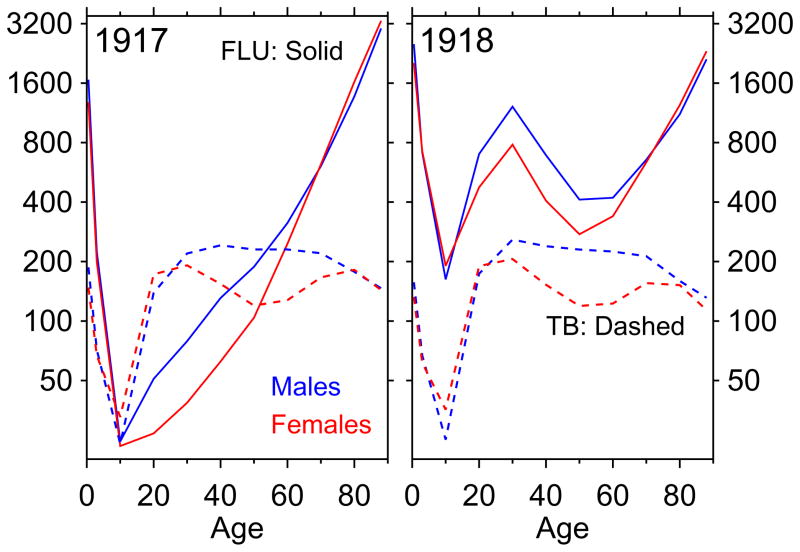
Figure 1 shows age-mortality profiles. The left panel shows calendar year 1917. The solid lines (one per sex) are the age-mortality profile (age on horizontal axis, death rate on vertical axis, log scale) for influenza and pneumonia, and the dashed lines are for tuberculosis. The right panel is the same graph for 1918, showing clearly the pandemic. Tuberculosis is a chronic disease, a slow killer. The age-mortality profiles in figure 1 for tuberculosis represent the tip of the iceberg of the population with active tuberculosis at any given time, and of an even larger iceberg including latents (Styblo, 1991).
Figure 1.
Tuberculosis (“TB”) and influenza and pneumonia (“FLU”) death rates, for calendar years 1917 and 1918. Death rates per 100,000.
The most important part of figure 1 is ages 20–35, or the middle of each panel. In the pre-pandemic period, tuberculosis death rates at these ages greatly exceeded those for pneumonia and influenza (recall the log scale of the vertical axis). It makes no sense, before the pandemic, to speak of influenza harvesting many of the tuberculous, because at the most important ages (by population) where tuberculosis death rates were highest, pneumonia and influenza killed many fewer people than tuberculosis itself. In calendar year 1918, due to the pandemic, pneumonia and influenza death rates greatly exceeded those for tuberculosis. Even assuming independent competing risks (i.e., no predisposition to die from influenza among the tuberculous), given the tremendous age overlap between pandemic influenza mortality and tuberculosis morbidity/mortality, Abbott (1922) must be right that the pandemic “carried off … a large number of tuberculosis subjects”.
3.2. Tuberculosis age-mortality profiles: 1918 and 1919
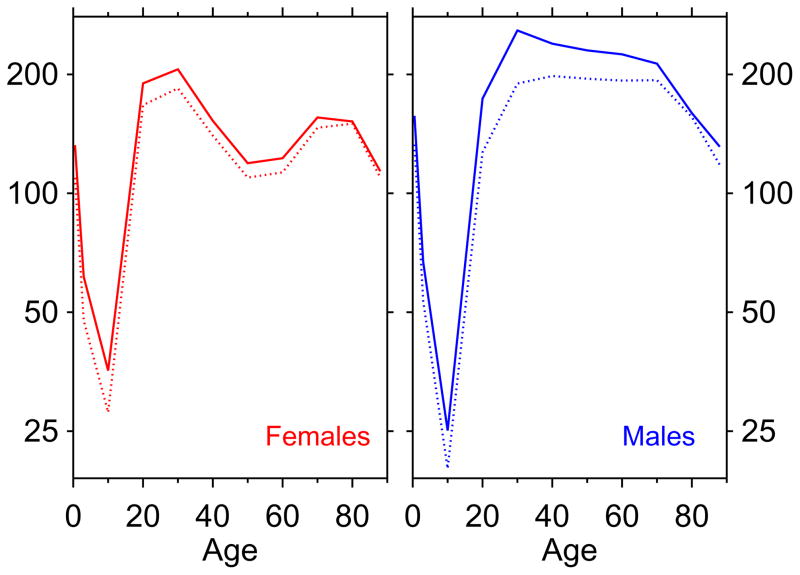
Figure 2 plots age-mortality profiles for tuberculosis, for years 1918 and 1919. Each panel is one sex. The upper, solid, age-mortality profile is the 1918 age-mortality profile for tuberculosis, and the lower, dotted, profile is the 1919 age-mortality profile for tuberculosis. The region in-between the two nested profiles represents the magnitude of the tuberculosis mortality decline from 1918 to 1919. The volume of the irregular polygon bounded by the two curves gives the first-year impact of the selection effect. The pull-down in mortality overlaps very well with the age-mortality profile of the selector (i.e., pneumonia and influenza death rates in 1918). Specifically, we see that tuberculosis death rates decline very little except at ages where the 1918 influenza had unusual mortality (cf. figure 1). Another way to look at the 1918–19 pull-down is table 1, which gives the raw data of figure 2. This shows that males, who had higher death rates for tuberculosis above age 25 and who had higher pandemic influenza mortality (figure 1), showed a much greater retreat in tuberculosis mortality.
Figure 2.
Tuberculosis age-mortality profiles, 1918 (top curve, solid) and 1919 (nested curve, dashed) illustrating drops in tuberculosis mortality. Death rates per 100,000.
Table 1.
Data from figure 2; see text for discussion.
| Age | |||||||||||
|---|---|---|---|---|---|---|---|---|---|---|---|
| <1 | 1–4 | 5–14 | 15–24 | 25–34 | 35–44 | 45–54 | 55–64 | 65–74 | 75–84 | ≥85 | |
| M, 1918 | 157.1 | 67.0 | 25.1 | 173.6 | 258.3 | 239.2 | 230.0 | 224.8 | 212.9 | 159.6 | 131.2 |
| M, 1919 | 132.8 | 53.4 | 20.1 | 127.0 | 189.6 | 198.1 | 195.0 | 192.9 | 193.3 | 156.0 | 118.0 |
| Δ18–19 | 24.3 | 13.6 | 5 | 46.6 | 68.7 | 41.1 | 35 | 31.9 | 19.6 | 3.6 | 13.2 |
| F, 1918 | 132.4 | 61.5 | 35.6 | 189.8 | 206.0 | 152.6 | 119.2 | 122.7 | 155.6 | 152.0 | 113.7 |
| F, 1919 | 109.5 | 47.7 | 27.9 | 167.2 | 184.4 | 140.0 | 109.6 | 113.0 | 146.6 | 150.0 | 109.6 |
| Δ18–19 | 22.9 | 13.8 | 7.7 | 22.6 | 21.6 | 12.6 | 9.6 | 9.7 | 9 | 2 | 4.1 |
3.3. Lexis surfaces of tuberculosis mortality
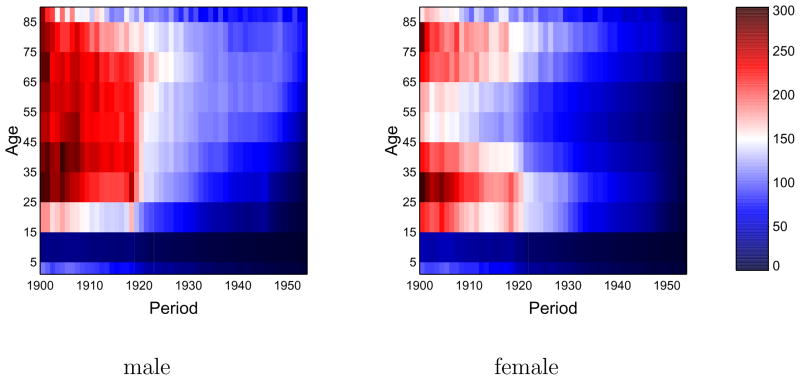
Figure 3 presents Lexis surfaces (by sex) of tuberculosis death rates. Color codes for mortality rate, according to the legend at right. The lowest rates are saturated blue, the highest rates are saturated red, with a continuum in-between; the scale is the same for both sexes.
Figure 3.
Lexis surfaces (age × period false-color diagrams) of tuberculosis death rates, age 1 to 85+, years 1900–53. Left: males; right: females. Legend at right (death rates per 100,000).
Age and period and cohort effects can all be seen in figure 3. Age effects manifest as horizontal patterns, exhibited most clearly in the 5–14 year age group, which, for both sexes, has the lowest tuberculosis death rates. Cohort effects are seen as diagonal bands (see online supplement), which, given the discreteness of the age bins, show up as a “staircase” pattern, most distinctively in the lower right quadrant of the male surface. This pattern is thought to reflect declining patterns of cohort exposure to Mycobacterium tuberculosis. The most striking feature of the Lexis surface is not the staircase pattern but the sharp demarcation, at 1920, between the red and the white/blue regions, especially in the male surface. This period (vertical) effect is coincident with the pandemic, and the more modest effect among females aligns with the lower magnitude of pandemic mortality among females (figure 1).
4. Discussion
The selective mortality hypothesis is proposed to account for a link between the 1918 influenza pandemic, and a downward pivot in tuberculosis death rates that occurred in the United States, starting in 1919. The available demographic data on mortality support the hypothesis.
There is still much that can be learned about this phenomenon. As noted above and in Noymer (2009), it may be simply a question of independent competing risks. In other words, there need not be any special biological interaction between the two diseases (“active selection”), just age-overlap. (“passive selection”). Exactly how many tuberculosis deaths would be required as a harvesting to produce the mortality declines that were observed would be a potentially ripe subject for modeling (such as in Blower et al. 1995; Porco and Blower 1998), as it would require assumptions about latency reactivation rates among other things.
The review of contemporary pathology data by Morens et al. (2008) did not find tuberculosis as a prominent co-morbidity in 1918 influenza victims. One explanation for this may be that the spike in tuberculosis deaths coded as such on death certificates (as noted by Abbott, and visible in figure 3) produced enough deaths to create the selection effect. These deaths would not then have been autopsied as influenza victims. Again, modeling could possibly help here. Also, the interaction may have been social, not biological. Tuberculosis was a disease that skewed toward the poor, and crowding among this group may also have enhanced influenza transmission.
There are other possibilities, such as that tiny pinhead-sized granulomas in tuberculosis latents (the basic biology of which we continue to learn about, e.g., Via et al. 2008), may have seeded the lungs for post-influenza secondary non-tuberculosis bacterial infection. If reactivation rates were high enough, then killing latents could have a similar effect as killing those with active tuberculosis. The data presented herein do not permit more than speculation about this, but the point is to illustrate that there are nuances left to explore.
Supplementary Material
Footnotes
Publisher's Disclaimer: This is a PDF file of an unedited manuscript that has been accepted for publication. As a service to our customers we are providing this early version of the manuscript. The manuscript will undergo copyediting, typesetting, and review of the resulting proof before it is published in its final citable form. Please note that during the production process errors may be discovered which could affect the content, and all legal disclaimers that apply to the journal pertain.
References
- Abbott AC. The death rate from tuberculosis [letter] Science. 1922;56 (1449):387–388. doi: 10.1126/science.56.1449.387-a. [DOI] [PubMed] [Google Scholar]
- Arthur WB, Vaupel JW. Some general relationships in population dynamics. Population Index. 1984;50 (2):214–226. [PubMed] [Google Scholar]
- Blower SM, McLean AR, Porco TC, Small PM, Hopewell PC, Sanchez MA, Moss AR. The intrinsic transmission dynamics of tuberculosis epidemics. Nature Medicine. 1995;1 (8):815–821. doi: 10.1038/nm0895-815. [DOI] [PubMed] [Google Scholar]
- Comstock GW. Frost revisited: The modern epidemiology of tuberculosis. American Journal of Epidemiology. 1975;101 (5):363–382. doi: 10.1093/oxfordjournals.aje.a112105. [DOI] [PubMed] [Google Scholar]
- Grove RD, Hetzel AM. Vital statistics rates in the United States, 1940–1960. United States Department of Health, Education, and Welfare: National Center for Health Statistics; Washington DC: 1968. [Google Scholar]
- Morens DM, Taubenberger JK, Fauci AS. Predominant role of bacterial pneumonia as a cause of death in pandemic influenza: Implications for pandemic influenza preparedness. Journal of Infectious Diseases. 2008;198 (7):962–970. doi: 10.1086/591708. [DOI] [PMC free article] [PubMed] [Google Scholar]
- Noymer A. Testing the influenza-tuberculosis selective mortality hypothesis with Union Army data. Social Science & Medicine. 2009;68 (9):1599–1608. doi: 10.1016/j.socscimed.2009.02.021. [DOI] [PMC free article] [PubMed] [Google Scholar]
- Noymer A. The 1918 influenza pandemic affected sex differentials in mortality: Comment on Sawchuk. American Journal of Physical Anthropology. 2010;143 (4):499–500. doi: 10.1002/ajpa.21405. [DOI] [PubMed] [Google Scholar]
- Noymer A, Garenne M. The 1918 influenza epidemic’s effects on sex differentials in mortality in the United States. Population and Development Review. 2000;26 (3):565–581. doi: 10.1111/j.1728-4457.2000.00565.x. [DOI] [PMC free article] [PubMed] [Google Scholar]
- Porco TC, Blower SM. Quantifying the intrinsic transmission dynamics of tuberculosis. Theoretical Population Biology. 1998;54 (2):117–132. doi: 10.1006/tpbi.1998.1366. [DOI] [PubMed] [Google Scholar]
- Styblo K. Epidemiology of tuberculosis. Vol. 24 of KNCV Selected papers. Royal Netherlands Tuberculosis Association; The Hague: 1991. [Google Scholar]
- Tukey JW. Exploratory data analysis. Addison-Wesley, Reading; Massachusetts: 1977. [Google Scholar]
- U.S. Department of Health, Education, and Welfare. United States, 1900–1953: Selected causes. Vital Statistics – Special Reports 1–31. National Office of Vital Statistics; Washington DC: 1956. Death rates by age, race, and sex. [Google Scholar]
- Via LE, Lin L, Ray SM, Carrillo J, Allen SS, Eum SY, Taylor K, Klein E, Manjunatha U, Gonzales J, Lee EG, Park SK, Raleigh JA, Cho SN, McMurray DN, Flynn JL, Barry CE., III Tuberculous granulomas are hypoxic in guinea pigs, rabbits, and nonhuman primates. Infection and Immunity. 2008;76 (6):2333–2340. doi: 10.1128/IAI.01515-07. [DOI] [PMC free article] [PubMed] [Google Scholar]
Associated Data
This section collects any data citations, data availability statements, or supplementary materials included in this article.


