

Abstract
One of the hallmarks of diffusion NMR and MRI is its ability to employ restricted diffusion to probe compartments much smaller than the excited volume or the MRI voxel, respectively, and extract microstructural information from them. Indeed, the single-pulsed-field-gradient (s-PFG) MR methodologies are employed with great success to probe microstructures in various disciplines ranging from chemistry to neuroscience. However, s-PFG MR also suffers from inherent shortcomings, especially when specimens are characterized by orientation or size distributions. In such cases, the microstructural information available from s-PFG experiments is limited or lost. The double-PFG (d-PFG) MR methodology, an extension of s-PFG MR, has attracted attention owing to recent theoretical studies predicting that it can overcome some inherent limitations of s-PFG MR. In this review, we survey the microstructural features that can be obtained from conventional s-PFG methods in the different q-regimes, as well as the limitations of these methodologies. The experimental aspects of the d-PFG methodology are then presented, along with an overview of its theoretical underpinnings and a general framework for relating the MR signal decay and material microstructure. We will describe the new microstructural features that can be obtained using the d-PFG MR framework. We then discuss recent studies that validated the new theoretical framework using phantoms in which the ground-truth is well known a priori, a crucial step prior to application of d-PFG in neuronal tissue. The experimental findings are in excellent agreement with the theoretical predictions and reveal, inter alia, zero-crossings of the signal decay, enhanced sensitivity towards size distributions, and angular dependencies of the signal decay from which accurate microstructural parameters such as compartment size, and even shape can be extracted. Finally, we show some initial findings in d-PFG imaging. This review lays the foundation for future studies, in which accurate and novel microstructural information could be extracted from complex biological specimens, eventually leading to new contrasts in MRI.
Keywords: double, pulsed field gradient, PFG, double-PFG, d-PFG, NMR, MRI, diffusion, microstructure, diffusion-diffraction, spin echo, PGSE, d-PGSE, porous media, restricted, orientation, pore shape, pore size, distribution, wavevector, compartment shape, microscopic anisotropy
Introduction
As early as 1950 Hahn (1) observed the effects of diffusion on the NMR signal. The potential of harnessing NMR as a methodology for measuring the diffusion coefficient of NMR observable nuclei was recognized soon thereafter by Carr and Purcell (2), and the subsequent development of pulsed-field-gradient (PFG) NMR by Stejskal and Tanner (3) provided a feasible means for measuring the diffusion coefficient completely non-invasively and with great precision. Indeed, diffusion NMR has become the most important tool for characterizing diffusion systems in many scientific disciplines ranging from chemistry to medicine.
Numerous comprehensive and authoritative reviews have been published on various diffusion MR methodologies and applications (4–14). This review will focus on the double-PFG (d-PFG) MR methodology as a probe for new and important microstructural features. First, the microstructural information available from restricted diffusion as detected by conventional single-PFG (s-PFG) methods will be briefly described, along with their limitations. The d-PFG methodology will then be introduced, and the various experimental aspects of the method will be discussed. The potential of d-PFG to extract new microstructural information from complex specimens (arising from recent theoretical advances) will also be presented. Subsequently, studies which were designed to validate the theoretical findings and to assess the accuracy of the microstructural information that can be extracted using d-PFG methodology will be reviewed. Finally, some experimental aspects and initial applications of d-PFG MRI will be presented, and future prospects of the methodology will be provided. It should be noted that this review will focus primarily on experimental aspects of d-PFG; for a review of the theoretical aspects of the methodology see (15).
Single-PFG as a probe for microstructural features
Magnetic resonance imaging (MRI) provides one of the most diverse modalities for characterizing biological tissues, and especially central nervous system (CNS) tissues. Distinct morphological, pathological, and even functional properties can be gleaned using MRI owing to its many contrast mechanisms and its high spatial and temporal resolution. Diffusion MRI has become one of the most important techniques for studying neuronal tissues, since restricted diffusion can be employed to report on size scales which are much smaller than the MRI voxel. In fact, restricted diffusion can be used as a reporter for processes on the cellular level, an important attribute for many applications. For example, diffusion MRI reveals the pathological condition in acute cerebral ischemia where T2 and T1 imaging offer little information on the condition (16–18); another important application of diffusion MRI in neuroscience is its ability to provide microstructural information, especially in white matter, which allows tractography of the fiber bundles (7,19).
The methodology that was by far the most widely employed in diffusion NMR and MRI research is the single-PFG (s-PFG) methodology (3), which employs a pair of diffusion sensitizing PFGs (or wave-vectors) of magnitude and direction G and duration δ, which are separated by a diffusion period Δ. This “diffusion block” can be inserted within a spin echo (SE) or stimulated echo (STE) sequence yielding s-PGSE and s-PGSTE experiments, respectively (Figure 1A and 1B). The physical basis of the NMR signal decay in the presence of diffusion has been previously reviewed (4,20). Briefly, the first PFG encodes the spins according to their positions resulting in a spatially dependent acquired phase, while the second PFG, applied in an opposite sense is used to refocus the acquired phase. Stationary molecules acquire zero net phase, and the MR signal does not attenuate; on the contrary, diffusing molecules acquire some finite random net phase, which leads to phase dispersion and signal attenuation (4,20).
Figure 1.
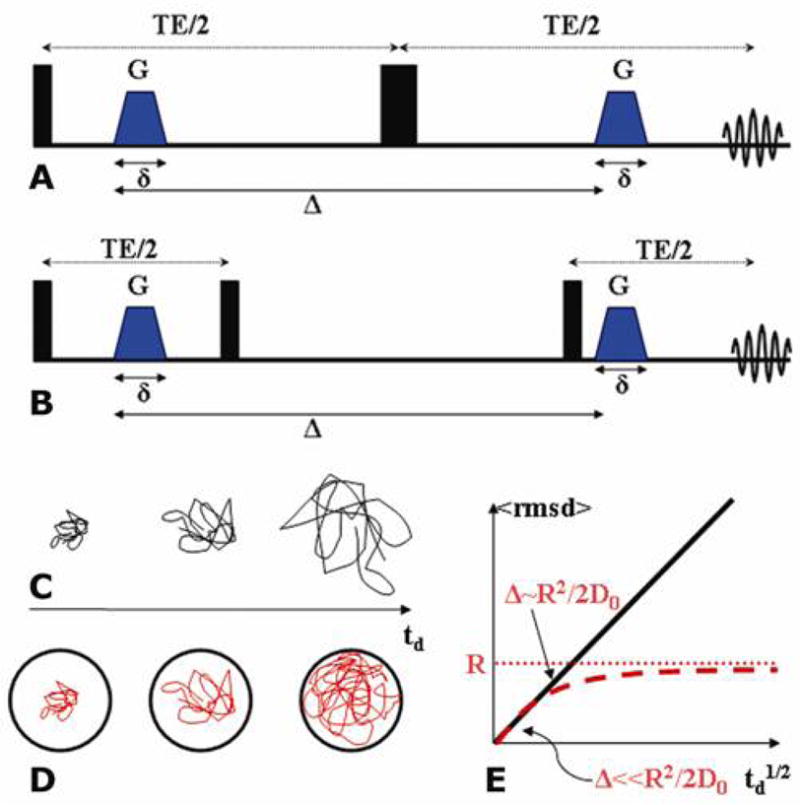
s-PFG sequences and diffusion modes. (A) The s-PGSE sequence. (B) The s-PGSTE sequence. (C) Schematic representation of free diffusion for different diffusion periods. (D) Schematic representation of diffusion in a confining geometry for different diffusion periods. (E) Schematic representation of the rmsd for varying diffusion periods for free (black line) and restricted (red dashed line) diffusion. The red dotted line represents the compartment size R and D0 is the diffusion coefficient.
For freely diffusing spins in isotropic systems (i.e., no confinement or barriers to motion, Figure 1C), the normalized signal attenuation E(q) obeys the expression:
where q is defined as the wave-vector q=(2π)−1γδG, γ is the gyromagnetic ratio, and the b-value is defined as b=4π2|q|2td where td is the effective diffusion time, in case of rectangular gradients td=Δ-δ/3. In such free diffusion systems the displacement distribution is Gaussian. A logarithmic plot of E(b) against the b-values yields a linear correlation from which the diffusion coefficient, D, can be extracted. The diffusion coefficient is time-independent, e.g. for each diffusion period Δ the same value of D will be extracted. The root mean squared displacement (rmsd) of the diffusing moiety can be obtained by Einstein’s relation: (rmsd)2=2nDtd (where n=1, 2 and 3 for 1, and 3 dimensional diffusion processes, respectively). For free diffusion, the plot of rmsd vs. td1/2 yields a linear correlation (Figure 1E, black line). Since there are no boundaries, a measurement along any direction will yield the same rmsd. This can be regarded as a free isotropic diffusion profile.
A completely different profile is obtained when impermeable barriers are introduced to the sample, forming a compartment in which restricted diffusion can take place (Figure 1D). Here, the signal decay loses its linearity with respect to the b-value when heavier diffusion weighting is applied; therefore, only an apparent diffusion coefficient (ADC) can be extracted from low b-values, while for heavier diffusion weighting a completely different treatment of the signal decay is necessary (vide infra). The manner of signal attenuation arising from restricted diffusion depends both on the diffusion period and, in cases of anisotropic compartments, on the direction in which the measurement is performed (21). The time dependence of the ADC arises from the fraction of molecules that sample the boundaries of the compartment at a given diffusion time and for short diffusion periods (Δ≪R2/2D0 where D0 is the diffusion coefficient of the species and R is the radius of the compartment), the rmsd increases linearly when plotted against Δ1/2, due to the very small fraction of molecules that experience the confining boundaries (Figure 1E, red broken line). However, as Δ is prolonged, the boundaries of the compartments are gradually sampled by more and more molecules, and when Δ~R2/2D0, the rmsd levels off asymptotically towards the size of the compartment (Figure 1E, broken red line. The horizontal dotted line represents the compartment size). Note that in case of non-spherical compartments, the direction of measurement is also important: for open cylinders, for instance, diffusion along the main axis of the cylinder will exhibit a free diffusion profile while diffusion along the direction perpendicular to the main axis will exhibit a restricted diffusion profile (Figure 1E).
This sensitivity of the signal decay towards environmental effects, coupled with the ability to probe diffusion on many length scales by prolongation of the diffusion period is what makes diffusion NMR such a remarkable probe for microstructural features. Although biological tissues and especially neuronal tissues are highly complex, in certain cases they adhere to the principles outlined above; therefore, important microstructural features can be extracted from diffusion measurements on such specimens.
In the following sections we will focus on low and high q-regimes, and on the different microstructural features that can be extracted in the two regimes.
The low-q regime and DTI
Consider an array of cylindrical compartments coherently packed with their principal axis along the z-direction. The anisotropy of the cylinders can be inferred from inspecting the ADCs in the x- and z-directions, obtained from s-PFG measurements at low q-values where the signal can still be approximated to represent Gaussian diffusion. In this case, ADCx<ADCz(=D0) will be obtained since diffusion is restricted in the x-direction and free in the z-direction. Note that such a result will be obtained only for Δ sufficiently long to probe the boundaries; we therefore purposefully make the distinction between low q-values and low b-values for restricted diffusion (a low b-value may comprise a combination of extremely short Δ and stronger gradients, yielding isotropy (ADCx=ADCz(=D0)) for a cylindrical compartment).
While the idea that the ADC should actually be treated as a tensor quantity was understood by many, Basser et al. (19) proposed the mathematical framework and experimental design to measure this quantity, which led to diffusion tensor imaging (DTI). In DTI, the diffusion tensor components can be extracted from diffusion measurements in (at least) six spatial directions using low q-values and with Δ sufficiently long to probe the boundaries of the compartment. Since the principal diffusivities of the tensor are invariant to rotation, they represent intrinsic quantifiable parameters. They can be used to derive yet other parameters that quantify anisotropy of the compartments such as fractional anisotropy (FA) or relative anisotropy (RA). Utilizing the principal directions, the orientation of the compartments in space can also be inferred from DTI. DTI has been highly exploited in biomedicine, enabling, inter alia, a remarkable new contrast between white matter (WM) and other CNS components such as grey matter (GM) and cerebrospinal fluid (CSF), and offering the possibility of fiber tracking (for comprehensive reviews on DTI see (6,7,12,22)). Through its treatment of diffusion at low q-values, DTI offers a remarkable tool for studying and quantifying directional information of microstructures, albeit not offering measures of compartment size.
The high-q regime: Diffusion-diffraction minima and the q-space approach
The diffusion tensor analysis requires that DTI use only the low-q part of the signal decay since it assumes Gaussian diffusion, and a single diffusing component. However, since DTI analysis is only valid in the low-q regime, microstructural information such as the size of the compartments is inherently lost. It is a well-established fact the signal decay arising from restricted diffusion in confined compartments is non-mono-exponential at higher q-values (10,13,23–25), and that in the case of biological tissues, more than a single diffusing component exist. Importantly, this non-monotonicity of the signal decay offers the possibility of extracting different microstructural parameters from those DTI offers.
Diffusion-diffraction minima
When the specimen contains compartments of the same size and a diffusion measurement is conducted such that high q-values are reached in the restricted direction and Δ is sufficiently long to probe the restricting boundaries, diffusion-diffraction troughs may be observed in the E(q) plots (26). Importantly, the size of the compartment can be derived from the diffusion-diffraction troughs (26,27) when the pore geometry is known, and for non-spherical (i.e., anisotropic) compartments the diffraction-like patterns have a strong dependence on the rotational angle between the principal axis of the compartment and the orientation of the gradients, affording microstructural information about compartment directionality (28,29). In recent years, the theoretical background for such phenomena has been advanced for various geometries (27,30–32), and these NMR diffusion-diffraction troughs were observed experimentally in systems which are characterized by compartments with relatively monodisperse sizes such as narrowly-distributed emulsions (33), water filled microcapillaries (28,29,34,35), red blood cells (RBCs) (36,37), and even solvent diffusing in polymer cavities (38). The effect of numerous experimental parameters on the shape and location of the diffusion-diffraction troughs were studied on well-controlled systems in which the “ground-truth” is known a priori and the findings could be accounted for theoretically (28,29,34). In cases where the diffusion-diffraction troughs disappear due to susceptibility effects induced by inhomogeneities of the sample, it has been shown that by using radiofrequency (RF) gradients (38) or bi-polar gradients (35) one can recover the diffraction-like features, and therefore extract the relevant microstructural information from the sample.
It is important to note that observation of diffusion-diffraction troughs is critical in the sense that it bears a signature for restricted diffusion, a property which is not always easily inferred in s-PFG (vide infra).
Q-space approach
Compared to DTI, the diffusion-diffraction troughs can offer new microstructural information about the compartments, namely the compartmental dimension. However, diffusion-diffraction minima are generally not observed in most biological diffusion systems (see “limitations of s-PFG methodology” section), and in such a case the signal decays smoothly (but non-mono-exponentially) with increasing q-values (10,25). In such cases, the q-space approach offers yet another possibility of inferring compartmental dimensions. In the q-space approach, one makes use of the Fourier relationship between E(q) (measured at high q-values) and the diffusion propagator P̃ (39). When E(q) data are Fourier transformed, the displacement probabilities can be obtained and used in extracting the averaged rmsd of the diffusing moiety. In completely free and unconfined systems the displacement probability is characterized by a mono-Gaussian function (since the propagator is in fact Gaussian). In complex specimens such as neuronal tissue, the E(q) signal decay is often approximated by a decay of two components (fast and slow), which are manifested as a superposition of two probability distribution functions (PDFs) upon the Fourier transform of E(q). In some cases, these two PDFs were approximated by a bi-Gaussian function (10,24,25,40). The rmsd of the fast and slow components extracted from the bi-Gaussian function can then be used to characterize different microstructural features of the sample such as different length scales in the tissue, although it remains extremely difficult to assign these components to specific cellular compartments, and such a model assumes Gaussian diffusion even for the restricted component. Another useful property of the q-space approach in these cases is that the fast diffusing components of the signal decay can be suppressed by using very long Δ, and slowly diffusing components can be accentuated. For example, the slow component extracted from excised optic nerve was shown to provide a good estimate of the mean axon sizes, as well as an accurate means of extracting the directionality of the fiber (41,42). The q-space approach, reviewed in this issue (43) has been shown to indeed provide complementary microstructural information to DTI, and was used in a variety of applications such as studies of myelin deficient rats (44,45) detection of multiple sclerosis (MS) (24,46), and even differentiation between vascular dementia and Alzheimer’s disease (47). A recent study by Ong et al. (48) that employed extremely strong gradients in excised spinal cord provided a striking example of the potential usefulness of characterizing sizes: in that study, excellent contrast between distinct morphological regions which correspond to regions of varying average diameters in histology was achieved, and the microstructural information obtained by the q-space approach far exceeded in its breadth those available from DTI (48). Other studies measuring the compartment sizes offered improved sensitivity to morphological features in normal tissue (49,50), and to pathology in neuropathological conditions, such as spinal cords of experimental allergic encephalomyelitis (EAE) rats, as well as in myelin deficient rats (44). Such studies provide a “virtual histology” of a specimen under investigation. Therefore, the q-space approaches offer different microstructural information as compared to DTI, namely the relative compartment sizes in which restricted diffusion takes place.
Figure 2 schematically illustrates the different microstructural information that can be retrieved from the different q-regimes from a neuronal-like structure. Figure 2A shows an illustration of two adjacent MR voxels (depicted in yellow), each containing a pack of perfect parallel impermeable cylinders which have similar inner diameters, namely 5 and 6 μm, representing two different adjacent white matter bundles. Figure 2B shows simulations for E(q) data in both z- and x-directions from the low q-regime, assuming that Δ is sufficiently long to probe the boundaries and δ is negligible, i.e., the short gradient pulse (SGP) approximation is fulfilled. The dashed line points to the q-value in which a typical DTI experiment is carried out (corresponding to b=1000 sec/mm2 with Δ=40 ms). As shown in Figure 2B, at low q-values diffusion in the x-direction is almost identical for the two cylinders; however, in the z-direction, spins are unhindered, enabling larger phase accumulation and consequent stronger attenuation of the signal (Figure 2B). The reason that the signal decay in the x-direction is so similar between the two different packs is a result of the long length scale which is probed at low q-values. However, when higher q-values are reached, the diffusion-diffraction troughs can be observed at q=2037 and 2437 cm−1 for cylinders with an inner diameter of 6 and 5 μm, respectively (Figure 2C), affording a way to resolve the size of each cylinder.
Figure 2.

Complementary microstructural information available from DTI and q-space methodologies in the different q-regimes. (A) Schematic representation of two MRI voxels (yellow) passing through two ensembles of cylinders with ID=5 and 6 μm (blue and red respectively). (B) Simulated E(q) plots for low q-values for diffusion in the z-direction (free) and for each ensemble of cylinders in the x-direction (restricted). The simulations assume the short gradient pulse approximation with Δ=40 ms, sufficiently long to probe the boundaries in the restricted direction. At low q-values, the two ensembles produce almost identical signal decay and are almost indistinguishable from one another. (C) Simulated E(q) plots for high q-values for diffusion in the z-direction (free) and for each ensemble of cylinders in the x-direction (restricted). Note the diffusion-diffraction minima for each ensemble. The diffusion-diffraction minima occur at q=2437 and q=2037 cm−1 for ID=5 and 6 μm respectively. (D) Schematic representation of microstructural information as depicted by DTI – for both MRI voxels, an anisotropy is observed at low q-values as depicted by the FA values; however, the voxels convey identical information due to the inability of DTI to resolve sizes at low q-values. (E) Schematic representation of microstructural information as depicted by the q-space approach– each MRI voxel will have a different intensity since q-space can resolve the sizes from the diffusion-diffraction minima.
The microstructural information available from the DTI measurement reveals the orientation of the cylinders for both voxels (since diffusion in the x- and z-directions are different), truthfully depicting the ensemble anisotropy present in both voxels, as could be, for example, manifested in FA maps (Figure 2D); however, two such voxels would be almost indistinguishable from one another since the information about the size of the compartment is unavailable at low-q values. In contrast, the microstructural information from q-space analysis of the data indeed reveals the sizes of the compartments: therefore, contrast can be achieved between the two voxels (Figure 2E). Thus, different and complementary microstructural information is gathered from the two methodologies.
Limitations of the s-PFG methodology
Although the s-PFG methodology can be exploited in a variety of applications, it has its limitations, some which are inherent to the methodology and some of which are technological, that preclude important microstructural information from being obtained. The inherent limitations of s-PFG arise from introduction of distributions (either orientation or size) in the specimen:
In the high q-regime, the diffusion-diffraction troughs, along with the vast microstructural information that they can convey, are easily lost due to size distributions. Most realistic diffusion systems such as axons in white matter, but also emulsions and rocks, are in fact almost always characterized by size distributions. Therefore, in almost every “real” application of q-space spectroscopy or imaging, the diffusion-diffractions minima are lost, and one must resort to the q-space approach, which may yield an averaged and somewhat relative compartment size.
Specimens which are characterized by locally anisotropic compartments that are randomly oriented will exhibit overall isotropy when measured in s-PFG methods (i.e., diffusion measured in any orientation will generate an identical signal decay, which will yield equivalent eigenvalues in DTI). Importantly, such structures may be present in grey matter, where neurons and dendrites are randomly aligned in space. In such cases, DTI measurements will yield zero anisotropy (due to averaging of directors in all directions), thereby losing important microstructural information. Interestingly, in such cases, it can be difficult to infer the presence of restricted diffusion, since diffusion-diffraction minima are lost, along with the microstructural information obtained therefrom.
Figure 3 presents different scenarios for restricted diffusion, along with the microstructural information that can be obtained in each case using the s-PFG methodology. An illustration of an ensemble of monodisperse spherical pores is shown in Figure 3A. At low q-values, DTI will produce equal eigenvalues, and an isotropic profile will be obtained. The ADC that can be extracted may be lower than that of free water, but that in itself does not necessarily imply restricted diffusion. However, at high q-values, the diffusion-diffraction troughs are observed in all directions, which means that the presence of restricted diffusion can be ascertained, and both the size of the compartment and the fact that it is spherical can be obtained. Figure 3B shows an ensemble of coherently placed cylinders. Here, the anisotropy of the compartment can be extracted by both DTI and q-space analysis, while the latter also offers the compartment size. When size distributions are introduced to the compartments (Figure 3C), DTI will still be able to convey the anisotropy of the cylinders; however, at the high q-regime, the diffusion-diffraction minima will be lost due to the size distribution, and the size of the compartment will no longer be available from the diffusion-diffraction troughs. When a size distribution is introduced to spherical compartments (Figure 3D) an isotropic profile will be obtained from DTI, from which it may be difficult to infer restricted diffusion in the spherical compartment; however, one may infer the presence of the restricted diffusion from non-mono-exponential signal decay at the high q-regime. Note that the diffusion-diffraction minima are absent in such a case, but using the FT of the signal decay, one may infer relative sizes in the specimen from the PDF. Figures 3E and 3F show randomly oriented cylindrical and ellipsoid compartments, respectively. Such compartments are locally anisotropic but macroscopically isotropic. For both cases, neither DTI nor high-q experiments will convey meaningful microstructural information; DTI will extract an isotropic profile, and the diffusion-diffraction minima will be lost from the high-q signal decay; neither method is able to distinguish between randomly oriented ellipsoids and randomly oriented cylinders, or provide microstructural information characterizing the compartments such as eccentricity in ellipsoids or length/diameter ratios in cylinders.
Figure 3.

Restricted diffusion in various compartmental scenarios, the microstructural parameters that are available from s-PFG and the types of anisotropies present. (A) A schematic representation an ensemble of monodisperse spherical compartments. Generally, it may be very difficult to infer on restricted diffusion in such cases using DTI. At higher q-values, the diffusion-diffraction minima will appear in all directions, conveying that this system is indeed characterized by restricted diffusion. The diffusion-diffraction minima also enable inference on the spherical nature of the compartments. In this case, microscopic anisotropy (μA) exists, arising from the boundaries of the compartments. (B) A schematic representation of monodisperse cylindrical compartments coherently aligned in a certain direction. Note that since the compartments are cylindrical and non permeable, compartment shape anisotropy (CSA) also exists, as does μA; since the cylinders are coherently packed, EA exists in this scenario as well. DTI parameters will be able to convey the ensemble anisotropy of the sample. The diffusion-diffraction minima will appear in the restricted direction, from which the size of the monodisperse microcapillaries will be extractable. (C) A schematic representation of coherently packed cylindrical compartments characterized by a size distribution. The same types of anisotropy are present as in (B); DTI parameters will be able to extract the ensemble anisotropy of the sample. The diffusion-diffraction minima, however, are lost, along with the important microstructural information they produce. (D) A schematic representation of spherical compartments characterized by a size distribution. In this case, the diffusion-diffraction minima are lost, and the presence of restricted diffusion will be hard to infer. As in (A), only μA exists for this sample, as it is spherical. (E) A schematic representation of randomly oriented compartments of cylindrical shape. (F) A schematic representation of randomly oriented ellipsoids. In both (E) and (F), the s-PFG methodologies will not be able to extract meaningful microstructural information. In both (E) and (F), both μA and CSA exist, but s-PFG methods cannot distinguish between the two. The compartment shape anisotropy in (E) is different from (F) since the compartments are cylindrical and ellipsoid respectively.
It should be noted that three distinct mechanisms of anisotropy were recently introduced by Özarslan (51) to describe the scenarios presented above: (1) microscopic anisotropy (μA) that arises from the boundaries of restricted compartments, even when they are spherical; (2) compartment shape anisotropy (CSA) that arises from the shape of the compartments, and (3) ensemble anisotropy (EA), which arises from the coherence of packing of anisotropic pores. Note that s-PFG methods are most useful to measure anisotropy when EA is present in the specimen. Other s-PFG limitations are mostly technological and indicate the need for strong gradient systems:
The first diffusion-diffraction trough of monodisperse compartments occurs at the q-value that corresponds to the reciprocal of the size of compartment (corrected to a geometrical factor). Therefore, the smaller the compartmental size, the higher the q-value of the diffusion-diffraction trough. Since the SGP condition must be met for the diffusion-diffractions to have sharp minima at the accurate q-value, the s-PFG methodology suffers from a need for extremely strong gradient amplitudes that require adequate hardware. Even when diffusion-diffractions are not observed, such as in most biological tissues, rocks, emulsions, and other porous media (typically characterized by sizes smaller than 5 μm), very high q-values must be reached to accurately carry out the q-space approach, and very strong gradients are needed, since it is favorable to remain in the SGP regime. This need for very strong gradients therefore, in fact, limits the applicability of the s-PFG methodology despite the important microstructural information that can be obtained.
In the high-q regime, the signal-to-noise (SNR) ratio is low due to the strong diffusion weighting. Coupled with the need for measuring several q-values and possibly even in several spatial directions, the q-space methodology is relatively time consuming. Moreover, where diffusion-diffraction patterns are not observed, extraction of sizes from the q-space approach is amenable to averaging of the sizes sampled by the diffusing species, and does not convey information that would yield properties of the size distribution itself.
In the following sections, we will review the d-PFG methodologies, and the possibilities they offer for overcoming some of the inherent limitations of s-PFG.
The d-PFG methodology as a probe for microstructures
Methodology
The d-PFG methodology employs two diffusion sensitizing gradient pairs, G1 and G2 with durations, δ1 and δ2, respectively, that are separated by a mixing time, tm. Two diffusion periods, namely Δ1 and Δ2, exist in the interval between each gradient pair. The corresponding q vectors for the two encoding blocks can be considered as |q|=|q1|=|q2|, where qi=(2π)−1γδGi. The double-PGSE (d-PGSE) sequence is shown in Figure 4A, specifying all of the experimental parameters. A variant of d-PGSE is shown in Figure 4B, in which the two inner gradients (the second G1 and the first G2) are superposed, so that tm is effectively zero—a desirable condition for several applications (vide infra). Note that in these sequences, the diffusion periods occur when magnetization is in the X–Y plane, rendering the sequence vulnerable to T2 and T2* relaxation. To avoid this artifact, the 180° RF pulses can be decomposed to pairs of 90° pulses, which then allow z-storage of the magnetization during different intervals, yielding double-PGSTE (d-PGSTE) sequences. Two variants of d-PGSTE, one in which a finite tm exists and one in which tm is zero are shown in Figures 4C and 4D respectively. These variants enable z-storage of magnetization during the diffusion periods. Other variants of the d-PFG methodology exist, such as the seven 90° pulse sequence which allows for prolongation of the mixing time while the magnetization is in the z-direction, as well as other variants (52). It should also be noted that as a natural extension to the s-PFG and d-PFG methodologies, multiple-PFG (m-PFG) experiments can be devised, in which further diffusion blocks are added (53).
Figure 4.

d-PFG sequences and orientation schemes (A) d-PGSE with finite mixing time. (B) d-PGSE with tm=0 ms where the middle gradients are superimposed. (C) d-PGSTE with finite mixing time. (D) d-PGSTE with tm=0 ms where the middle gradients are superimposed. (E) Definition of the angle ψ between the two gradient pairs. The angles θ and ϕ are also defined. (F) The d-PFG angular experiment. Generally, G1 can be set in any direction and the angle ψ is varied between the gradient pairs. In the variant shown in (F) G1 is set in the x-direction, with θ=90° and the orientation of G2 is varied along the angel ϕ (i.e., in the X–Y plane).
The d-PFG methodology offers many degrees of freedom, namely the orientations and strength of each of the individual gradients, as well as the diffusion periods that can be separately varied, and the mixing time. An important feature of d-PFG is the variable angle between the gradient pairs G1 and G2, denoted ψ (Figure 4E) (vide infra). Figure 4E also defines the azimuthal and polar angles θ and ϕ, respectively. These many degrees of freedom offered by d-PFG enable many different acquisition schemes. First, one can fix the diffusion periods as equal (Δ1=Δ2) and gather E(q) data by increasing both of the q-values (usually concomitantly) with a fixed angle ψ between the gradients. When anisotropic compartments are probed, it is convenient to denote special cases of angle pairs: for example, an experiment conducted with G1 in the x-direction and with the angles: θ=90° and ϕ=0° between the gradient pairs can be denoted d-PFGxx; the indices represent that G1 and G2 are collinear and both in the x-direction. Similarly, the special cases with G1 in the x-direction and θ=90° and ϕ=90° or with G1 in the z-direction and θ=90° and ϕ=0° can be denoted d-PFGxy and d-PFGzx, respectively: such experiments can be referred to as orthogonal experiments. Many combinations of such experiments can be carried out by varying the diffusion periods (concomitantly or independently), or the mixing time for each pair of directions.
A second and very different type of acquisition scheme involves the d-PFG angular experiment. In such experiments, the diffusion periods and tm are fixed, and the angle ψ between the gradients is varied for a certain q-value. For anisotropic, cylindrical compartments with their principal axis aligned in the z-direction, it is instructive to consider a measurement in the X–Y plane, i.e., G1 is set in the x-direction with θ=90° and ϕ=0° and the orientation of G2 is varied between ϕ=0° and 360° in the X–Y plane (Figure 4F). Such angular dependencies can also be repeated with varying diffusion periods or mixing times, and for multiple q-values.
Other acquisition schemes exist such as the two-dimensional (2D) d-PFG, where the diffusion periods are fixed, and for each value of q1 the whole spectrum of q2 is acquired; in such cases, a 2D diffusion-diffusion correlation map can be obtained for different values of diffusion periods and/or mixing times (54).
Early d-PFG experiments and theory
As mentioned earlier, one of the limitations of s-PFG occurs when anisotropic compartments are randomly distributed such that macroscopically they appear isotropic in s-PFG measurements due to the averaging of directors within the MR voxel (as depicted in Figures 3E, F). In fact, in such cases it may be extremely difficult to even infer the presence of restricted diffusion, and s-PFG methodologies can extract microstructural information only in coherently placed compartments (Figures 3A and B). In 1990, Cory et al. used the seven 90° pulse d-PGSTE variant to probe diffusion and spin transport in randomly oriented eccentric yeast cells (55). In this study, Cory et al. compared displacement profiles (obtained from Fourier transform of E(q) data) from two different d-PFG experiments: one in which G1 and G2 were collinear, and one in which G1 was orthogonal to G2 (d-PGSTExx and d-PGSTExy respectively). It was demonstrated that the displacement profile in a d-PGSTExx experiment was different than that of d-PGSTExy (55). Thus, Cory et al. were able to infer from d-PFG experiments that the yeast were microscopically anisotropic. On the contrary, s-PFG acquisitions along any direction yielded the same displacement profiles, which could lead one to the erroneous inference that cells are spherical; therefore the accurate microstructural information was absent in s-PFG measurements due to the random orientation of yeast and averaging of propagators in each dimension. The novelty of the methodology introduced by Cory et al. was in using the d-PFG collinear and orthogonal measurements to infer the eccentricity of the randomly oriented yeast cells, a microstructural property that is completely lost in s-PFG.
The reason for the above different signal decays in collinear and orthogonal d-PFG experiments were later elucidated in a theoretical study of the signal decay in d-PFG conducted by Mitra in 1995 (56). Mitra theoretically studied an ensemble of pores using the d-PGSE sequence in the low q-regime under idealized conditions of δ→0, Δ→∞, and tm→0 or tm→∞, and found that when the angle ψ between G1 and G2 is varied (as in the experiment depicted in Figure 4F), the signal decay follows a bell-shaped function, even when the pores are spherical. This observed anisotropy in spherical pores implied a new mechanism for anisotropy, namely microscopic anisotropy, which is induced by the boundaries of the confining geometry (vide infra). In an outstanding theoretical insight, Mitra predicted that this angular dependence can be used to detect anisotropy that arises from the boundaries of the restricting geometry, even in randomly oriented anisotropic compartments (Figures 3E, F) (56). Mitra’s study predicted that for tm→0, the angular dependence of the signal decay will hold for any compartment shape, including spherical compartments. In that study, Mitra presented a way to differentiate between the situation shown in Figure 3A (spherical pores) and Figures 3E and F (randomly oriented non-spherical compartments): At tm→∞, the angular dependence was predicted to be preserved only for randomly oriented compartments that are non-spherical; i.e., the signal decay exhibits anisotropy due to compartment shape, (later coined compartment shape anisotropy (CSA)). In fact, Mitra’s theory (56) suggested a new tool for obtaining a signature for restricted diffusion even in randomly oriented compartments at the low q-regime, an extremely desirable property for many applications, especially of clinical relevance.
Cheng and Cory were able to delineate eccentricities in different types of yeast cells at long mixing times (57), by again comparing the displacement profiles from collinear and orthogonal high q-value d-PFG experiments (which correspond to just two values of ψ in the angular dependence of the signal decay). In another study, Callaghan and Komlosh used the same methodology (namely observing the difference between the signal decays of collinear and orthogonal d-PGSE experiments) to study the signal decay in lyotropic liquid crystals, which can be approximated by microscopic cylindrical compartment domains randomly distributed within the crystals (58). This methodology was later further extended to a grey matter phantom and then to monkey grey matter (59), and to spinal cord d-PFG weighted imaging (60). Note that in all of the above studies, s-PFG measurements yielded isotropic signal decay, due to the macroscopic isotropy of the specimens (vide infra). The d-PFG, therefore, offered microstructural information that could not be accessed by s-PFG measurements. Note that in the above studies, the full angular dependence was not studied, but collinear and orthogonal d-PFG measurements were compared as a means for inferring the local properties of the randomly oriented compartments. Other d-PFG methodologies, in which different experimental and analytical schemes are employed were used in a range of different applications which are beyond the scope of this review: d-PFG variants were shown to be able to suppress solvent signal (61) and convection artifacts (62) in diffusion measurements. Different variants of d-PFG can be used in two-dimensional acquisition schemes to infer on correlation of flow and dispersion phenomena (63,64), and on molecular migration and exchange in porous media (54,65–68).
Several recent studies used Mitra’s theory to analyze the angular dependence in d-PFG imaging experiments conducted on several specimens (69–71) (vide infra) and in Monte Carlo simulations of d-PFG in restricted pores (72–75). In the following section, a brief theoretical description of the theory pertaining to d-PFG experiments, from Mitra’s first study to the recent developments in the theory.
Theory
In this section, we shall briefly review the theoretical developments that aim to predict the diffusion-attenuated MR signal in double-PFG experiments. The theory developed to account for the wealth of features provided by the double-PFG acquisitions is already overwhelming. Therefore, here we briefly summarize the milestones pertaining to the effects of restricted diffusion in a mostly qualitative fashion. The reader is urged to resort to the cited references for a more detailed picture. We would like to note that a more quantitative and comprehensive review focusing on the theoretical aspects of the double-PFG MR will be published elsewhere (15).
As mentioned above, double-PFG MR was introduced by Cory et al. (55) as an extension of the two-pulse Stejskal-Tanner experiment. Although the authors provided no theoretical treatment, this work provided the essential insight that the eccentricity of anisotropic compartments could be characterized via such sequences.
The existing theoretical works can be cast into three classes based on the experiment being performed: the angular, radial and arbitrary acquisitions.
Theory of angular d-PFG
In angular double-PFG, the angle between the gradients is varied while keeping their magnitude fixed. The influence of restricted diffusion on angular double-PFG MR acquisitions was systematically studied for the first time by Mitra (56). The main goal of Mitra’s work was to lay the foundation for the interpretation of such experiments. In this seminal work, a Taylor series expansion of the double-PFG signal was considered, and a number of simplifying assumptions were made in the timing parameters. Specifically, the duration between the gradients of each PFG block was assumed to be long, while the gradient pulses were assumed to be infinitesimally short. In addition, Mitra considered two limiting cases for the mixing time. All these assumptions can be summarized in mathematical terms as follows:
DΔ ≫ a2, where ‘a’ is the characteristic dimension of the compartment.
Dδ ≪ a2, or the so-called “short gradient pulse” (SGP) regime.
γδGa = 2πqa≪1 Note that this condition is implied because the theory is based on a Taylor series representation of the MR signal.
(i) Dtm ≫ a2 or (ii) Dtm ≪ a2
Mitra predicted that, at long mixing times (condition (i)), the signal obtained for spherical pores is not expected to have any angular dependence. However, for ellipsoidal pores, an angular dependence was predicted in the fourth order term of the Taylor expansion. Clearly, this suggests that ellipsoidal pores can be distinguished from spherical pores supporting the view in Ref. (55). Although an angular dependence was predicted, the functional form of that dependence was not provided in (56).
Subsequently, Cheng and Cory (57) tackled the same regime and showed that for a specimen comprising a randomly oriented collection of spheroidal pores (ellipsoids of revolution), the quadratic term of the signal attenuation is indeed the same when the two gradients of the double-PFG sequence were applied along parallel or perpendicular directions. Moreover, the difference between the signal attenuations was predicted to be
| (1) |
where ψ is the angle between the gradients of the two encoding blocks, and the semi-major radii of the spheroid are denoted by b and c. Finally, a is the longest is the longest end-to-end distance inside the pore, which is larger than b and c for the case of spheroids.
More recently, the same long mixing time regime was considered by Özarslan in Ref. (51), and, inter alia, the full angular form of the signal profile was derived for randomly oriented spheroids as well as capped cylinders. In both cases, the fourth-order term was shown to be characterized by a cos(2ψ) dependence. These findings are consistent with Mitra’s findings as well as Cheng and Cory’s (Eq. 1), and make it possible to characterize the eccentricity (compartment shape anisotropy, CSA) of the compartments from double-PFG MR data wherein ψ values are sampled in arbitrary fashion. Moreover, in (51) a sophisticated framework was employed (vide infra) through which the CSA can be characterized via double-PFG acquisitions with completely arbitrary parameters thus obviating all of the conditions listed above.
The main contribution of Ref. (56) is the prediction for the opposite case of short mixing times (condition (ii)). Mitra showed that when the mixing time vanishes, even the second order term of the signal decay will have an angular dependence as can be seen in the relationship
| (2) |
where <r2> is a quantity related to the mean-squared radius of gyration of the pores.
As recognized by Mitra, this is a remarkable finding that provides a signature for restricted diffusion at very low gradient strengths - a requirement critical for most clinical applications. Moreover, since such an angular dependence is not expected for multi-Gaussian diffusion processes, observing the angular dependence of the MR signal enables one to distinguish such processes from restricted diffusion. The subsequent development by Özarslan and Basser (76) provided a number of crucial results related to such experiments. First, the signal attenuation for free diffusion in double-PFG acquisitions with completely arbitrary experimental parameters was derived. It was shown that for the experiment illustrated in Figure 4A or C, in which a finite mixing time exists, no angular dependence is expected. On the other hand, when the two gradients at the center are superposed (as in Figures 4B or D), there is some angular dependence of the signal. However, this angular dependence appears in the opposite sense to that for restricted diffusion, hence it does not compromise the specificity of the angular patterns. Moreover, such an inverted angular dependence for free diffusion is predicted only when the pulse durations are comparable to pulse separations, i.e. δ~Δ.
Before discussing the treatment of restricted diffusion in Ref. (76) it it is worthwhile to point out that restriction induces diffusion anisotropy even when the shape of the compartment is isotropic. This fact is clearly demonstrated in Ref. (77), wherein it was shown how the anisotropy induced by macroscopic boundaries can be captured by single-PFG acquisitions, which is possible only when the image voxel is larger than the pore size. This is the kind of anisotropy prevalent in the magnetization density profile within the pore space. When the pore size is smaller than the voxel size, the single-PFG acquisitions lose their sensitivity to such anisotropy. The angular dependence in double-PFG acquisitions with short mixing times, as demonstrated in Eq. 2, is a consequence of the anisotropy within the pore space as well. Therefore, Özarslan and Basser referred to such anisotropy as microscopic anisotropy (μA) (51) to make the distinction from the anisotropy due to the shape of the compartments clear.
To solve the problem for restricted diffusion, Özarslan and Basser employed a novel idea. In this approach, a completely general MR gradient waveform was envisioned to be composed of a train of impulses as was previously proposed in Ref (78). Unlike this work, however, in Ref. (76), the authors considered the limit as the intervals between the consecutive impulses shrank, and the number of impulses approached infinity. This scheme, akin to the path integral methods in different areas of physics, enabled the analytical evaluation of the second order term in the MR signal intensity for diffusion taking place between parallel plates, and within infinite cylinders and spheres.
Although the results are valid for any pulse sequence Özarslan and Basser applied the formalism to double-PFG acquisitions, which led to a series of important results. First, Eq. 2 was generalized to arbitrary timing parameters of the sequence. Second, it was shown how the orientation of the cylindrical fibers (when ensemble anisotropy is present) can be estimated along with the fiber diameter - a potentially important result for the characterization of white-matter when the fiber direction is not known a-priori. In this work, a general treatment of ensemble anisotropy was also presented, and explicit results for randomly distributed pores were derived. It was shown how these results for the randomly distributed pores can be envisioned to be a “component” of specimens exhibiting ensemble anisotropy.
Last but not least, it was shown in Ref. (76) that at very long diffusion times, and for very long cylinders, there is a different regime that one must be aware of. Under such conditions, the quadratic term of the signal may have an angular dependence resembling the cos(2ψ)-type dependence due to the CSA effects as discussed above. Surprisingly though, a similar angular dependence emerges in the quadratic term. Since spheres are not predicted to yield such angular dependence in the quadratic term of the Taylor series, it can again be attributed to CSA.
Theory of radial d-PFG
So far we have described the theory for double-PFG experiments with fixed gradient strength when the angle between the two gradients is varied. In 2007, Özarslan and Basser considered the case of multiple-PFG acquisitions with constant gradient orientation, and when the magnitude of the gradients was varied concomitantly (53). This is the same kind of experiments that are typically performed to observe diffraction-like features in s-PFG MR acquisitions (26). However, it was shown in Ref. (53) that the diffraction-like features are significantly different in multiple-PFG acquisitions with an even number of gradient pulse pairs. The most important difference is that the signal, rather than rebounding from the horizontal axis, crosses it and acquires negative values. The first zero-crossing occurs at half the q-value at which the single-PFG signal minimum occurs. The most important implication of the zero-crossing is its robustness to the heterogeneity in the sample. For example, when a population of compartments with different sizes is considered, the signal minimum in single-PFG acquisitions was predicted to disappear quickly. However, because of the cancelations of the positive and negative signals in polydisperse specimens, the zero-crossing is not lost in double-PFG experiments (53). A similar situation occurs in the presence of orientational dispersion (51). As was shown in the zero-crossing is retained even when the pores are oriented along completely random directions.
After presenting the proof-of-concept for Mitra’s limiting cases outlined above, in Ref. (53) the authors provided simulations for differing number of diffusion gradient pulse pairs, and different levels of polydispersity. It was shown that when an odd number of pulse pairs are employed the robustness to heterogeneity is lost. The effects of variations in the experimental parameters were demonstrated using the matrix formulation (79,30) of the multiple propagator approach that employs the discretization of an arbitrary gradient waveform (78) as mentioned above.
A generalized method for a unified theory
Although the important contributions by Mitra (56) and Cheng and Cory (57) provided the framework and the essential ideas for the characterization of restricted diffusion, the assumptions regarding the experimental parameters make it difficult to employ these techniques in real life problems. The main difficulty is that the conditions listed above relate the experimental parameters to geometric quantities - the same ones one is trying to extract from the data. As such, these quantities cannot be known a priori, making it difficult to design an experiment that is guaranteed to be valid for the particular specimen. Moreover, the heterogeneity within the specimen (e.g., pore size distribution) may make it impossible to fulfill all of these conditions for all pores within the specimen. In image acquisitions, the pore dimensions are expected to vary from voxel to voxel - a desirable situation to create image contrast. So, the simplifying assumptions listed above will most likely be violated in some voxels and not the others leading to an ambiguity in the observed contrast.
The theory based on the analytical evaluation of the quadratic term of the MR signal attenuation provided in Ref. (51) enabled the generalization of Mitra’s main finding to experiments with arbitrary timing parameters. The only remaining condition, namely, the low-q requirement, was overcome in Ref (80) by acquiring data at several small q-values and fitting the data at a particular angle to a function of the form
| (3) |
Subsequently, the U(ψ) profile was fitted to the theory in (76) to extract the pore dimensions via double-PFG acquisitions with arbitrary timing parameters. This approach is similar to what is done in Ref. (57) who used such an expansion for only two values of ψ.
Although the above scheme can be employed to overcome the limitation of the theory regarding the q-values, is typically not desirable because it requires data at several q-values. Perhaps more importantly, as demonstrated in (81), the same small q-regime may be ‘contaminated’ by the presence of a freely diffusing component making the features from restricted diffusion difficult to extract. Clearly, a more general theory that can accommodate all timing parameters along with arbitrary q-values would be helpful. Although the matrix product version (79,30) of the multiple propagator approach (78) could be used to that end, the results would be only approximate due to the discretization of the gradient waveform, and accurate estimations would be computationally expensive.
A more feasible theoretical development was recently introduced in (82) The technique employed by the authors involves the generalization of the multiple correlation (MCF) framework introduced by Grebenkov (83,84). In the MCF framework, a pseudo quantum mechanical approach taken by Robertson (85) in the 1960s was refined to quantify the signal for restricted diffusion in well-defined pore shapes. The MCF approach, in its original form, provided exact expressions for piecewise constant gradient waveforms, and approximate results for others as long as the gradient orientation was held constant throughout the pulse sequence.
This assumption of the MCF framework made it impossible to utilize it for general double-PFG acquisitions where the angle between the two gradients is varied. By employing relatively sophisticated concepts such as operator algebra and the Wigner-Eckart theorem (86) Ref. (82) provided the necessary generalization that extended the framework to completely arbitrary gradient waveforms. The resulting technique can be used to characterize the microstructural features from radial as well as angular double-PFG, hence unifying the two approaches. Note that similar to that in (76), this unified framework makes it possible to acquire data by varying the timing parameters, such as gradient durations, diffusion periods and mixing times as well. Moreover, the extension in Ref. (82) is useful not only in angular double-PFG acquisitions but also in quantifying the effects of imaging gradients in arbitrary MR acquisitions as gradients in all three directions have to be applied in three-dimensional k-space imaging. Therefore, by accounting for the effects of imaging gradients, the theory in (82) is expected to yield accurate estimations of the microstructural features even in multiple-PFG image acquisitions with completely arbitrary parameters.
To summarize, the recent theoretical advances presented the following striking features that pertain to obtaining new microstructural information:
In the high q-regime, when restricted diffusion is considered in monodisperse pores, and d-PFG is conducted in the restricted direction, the theory predicts zero-crossings of the signal decay, which have an extraordinary sensitivity to variations in the experimental parameters such as the mixing time and the diffusion times. Moreover, it was proposed that while diffusion-diffraction troughs in s-PFG vanish due to size distributions, the zero-crossings would persist and report on the lost microstructural information, offering a theoretical solution to one of the most severe limitations of s-PFG.
The angular dependence d-PFG experiment can be used to obtain accurate compartmental dimension from small compartments even at low q-values and at realistic experimental settings, thus obviating the need to reach high q-values in which diffusion-diffraction troughs are observed; all non-idealized experimental parameters such as finite mixing times, varying diffusion periods, gradient durations, and compartment orientation can be accounted for using the new analysis scheme.
A breadth of novel microstructural information can be extracted even when anisotropic compartments are randomly oriented. The theoretical framework enables extraction of μA at tm=0 even in randomly oriented compartments or even indeed in spherical pores (Figures 3A, E, F) while CSA parameters can be extracted at finite mixing times, offering a new way to characterize randomly oriented locally anisotropic compartments.
This advance in the theory significantly broadens the experimental possibilities for obtaining accurate microstructural information, especially in those regimes where s-PFG methods are limited. The novel parameters provided by the theory, which cannot be measured using s-PFG methodologies, are expected to play an important role in characterizing grey matter and other regions in the brain.
Experimental findings and validation of the theory on restricted diffusion phantoms
The theoretical advances discussed in the above section offered a general framework from which many microstructural features could be, in principle, obtained from d-PFG experiments under realistic experimental conditions. However, the validity of these theoretical predictions, as well as the accuracy and robustness of the method needed to be experimentally assessed prior to application in biological tissues. In a series of recent studies, phantoms for restricted diffusion were used to test the new theoretical framework. In such phantoms, microstructural parameters such as the nominal compartment dimension, geometry, and orientation within the magnet are well defined; therefore, the ground-truth of the phantom is known a priori, an important advantage for challenging a new theory. These phantoms, consisting of water-filled microcapillaries, were previously extensively studied using the s-PFG methodology (28,29,34,35), and proved useful in characterizing the effects of various experimental parameters on the signal decay. Notably, when monodisperse microcapillaries are used, the diffusion-diffraction minima are observed and the microstructural information such as the size and orientation of the microcapillaries can be accurately extracted and compared to the nominal size of the microcapillaries. Full experimental details regarding the construction of these phantoms can be found in (28,29,34,35). Briefly, microcapillaries are filled several days prior to each experiment and are densely packed in a 4 mm glass sleeve. The sleeve is then placed in a 5 mm NMR tube with the principal axis of the microcapillaries along the z-direction (the direction of the main magnetic field). In each section, a brief description of the phantom that was used will be presented.
Observation of zero-crossings and the effect of experimental parameters
The theory for d-PFG signal decay in coherently placed monodisperse compartments included predictions of zero-crossings of the signal that are analogous to the diffusion-diffraction minima in s-PFG experiments (53). The theoretical study in (53) predicted that for such an array of compartments, the zero-crossings of the signal will occur in d-PFG experiments at a q-value equaling half of the location of the diffusion-diffraction troughs in s-PFG experiments. Recently, these zero-crossings were observed experimentally for the first time and the influence of various experimental parameters on their location was studied (87).
The diffusion-diffraction patterns arising from diffusion of water in microcapillaries with an inner diameter (ID) of 25±1 μm in a s-PFG experiment conducted in the x-direction in the long Δ and short δ limits can be seen in Figure 5A. The diffusion-diffraction minima can be easily discerned. Figure 5B shows the E(q) plot extracted from the data (black squares), along with the theoretical fitting to the data (black solid lines). The diffusion-diffraction troughs occur at q=468, 895, and 1320 cm−1 respectively (data is shown only up to q=1800 cm−1 to enable easy comparison with d-PFG results). It should be noted that the size can be either extracted directly from the diffusion-diffraction troughs yielding a size of 26.0, 27.3, and 27.7 μm respectively, or from fitting the data to the theory above, yielding a size of 25.63±0.03 μm. The accuracy of the extracted size from diffusion-diffraction minima is limited by the resolution in the q-axis and, for small compartments, by the diffusion during the gradient pulse (violation of the SGP approximation). However, the theoretical framework can account for these effects and the extracted size is in excellent agreement with the nominal size.
Figure 5.

Stackplots and E(q) plots of s- and d-PFG experiments. (A) The stackplot from a s-PFG experiment conducted on microcapillaries with ID=25±1 μm with Δ/δ=150/3 ms. The diffusion-diffraction minima can be easily observed. (B) Experimental (symbols) and theoretical fittings (lines) for single- and double-PFG (black squares and red circles respectively). Note that d-PFG negative experimental data and negative theoretical fitting are plotted as absolute values (hollow red circles and dashed red line respectively). The data of d-PFG is plotted against 2q for d-PFG, to enable easy comparison with s-PFG. (C) The stackplot of a d-PFG experiment conducted on the same microcapillaries with Δ1=Δ2/δ1=δ2=δ3=150/3 and with tm=0 ms. Note the actual zero-crossings of the signal, after which the phase of the signal is inverted with respect to the initial phase.
The signal decay from a corresponding d-PGSExx experiment is shown in Figure 5C. Here, the zero-crossing of the signal is apparent. Note that after the zero-crossing the signal is in fact negative (i.e., the peak is inverted relative to its initial phase). Figure 5B shows the E(q) plot that was extracted from the experiment. The positive experimental points are plotted as red full symbols, while the absolute value of the negative experimental points is plotted as red hollow symbols (Figure 5B). The theoretical fitting to the signal is plotted as solid lines, with the positive values plotted as solid red lines and absolute values of the negative signal as dashed lines. The d-PFG data are plotted against 2q to be comparable with s-PFG. Note that the zero-crossings can be observed at 2q=468, 895 and 1298 cm−1, for the first second and third zero-crossings. When the theory presented above is used, a diameter of 25.65±0.03 μm is extracted, in very good agreement with the 25±1 μm nominal diameter. Note that the theory provides a better estimate for the diameter of the microcapillaries since it is not limited by the resolution in the q-axis, and takes into account all of the experimental parameters.
In (87), the effect of various experimental parameters on the location of the zero-crossings in different d-PGSE experiments was studied using the d-PGSE sequence shown in Figure 4A. It was found that prolonging the mixing time shifts the zero-crossings to higher q-values in d-PGSExx experiments, while for d-PGSExz the mixing time had no effect whatsoever on the signal decay. Interestingly, the first zero-crossing was found to disappear for orthogonal experiments, due to the loss of motional correlation between free diffusion in the z-direction and restricted diffusion in the x-direction. The study also showed the equivalence of d-PGSExz and d-PGSEzx, for example, conducted using the same parameters. Another interesting finding was that shortening the diffusion periods (concomitantly) resulted in a shift of the zero-crossing towards higher q-values (87). The sensitivity of the first zero-crossing to the experimental parameters that was demonstrated in that study imply that care must be taken when extracting microstructural information in such experiments. The experimental findings were consistent with the predictions previously published in (53).
Robustness of the zero-crossing in size distribution phantoms
Most realistic specimens commonly have polydisperse or varying compartment dimensions. For example, in neuronal tissues the axon sizes are distributed around an average diameter which varies for different types of tissues. When specimens are characterized by size distributions, the diffusion-diffraction troughs vanish in s-PFG methodologies (88). However, the theory first presented in (53) predicted that the zero-crossings in d-PFG should persist even in cases of broad size distributions, as long as the diffusion periods are sufficiently long to probe the boundaries of the restricting geometry (89). Hence, restricted diffusion could be used to infer on microstructural information even in specimens characterized by broad size distributions.
To test this prediction, size distribution phantoms were prepared: microcapillaries of varying sizes were counted and mixed in a single NMR tube to comprise accurate volumetric ratios. As opposed to realistic size distribution samples, the size distribution in such phantoms is not continuous; nevertheless, it constitutes a platform on which the width and average size distribution is controllable, affording a system in which the ground-truth is known. The s- and d-PFG experiments were all conducted in the restricted direction, i.e., the direction perpendicular to the main axis of the microcapillaries.
Figure 6A shows the volumetric ratio of the size distribution phantoms employed in (89), namely SD001, SD002, and SD003. The three specimens can be characterized by an average diameter dav and its standard deviation σ. The phantoms SD001, SD002, and SD003, were constructed such that these parameters were 18.8±1.9, 16.0±4.3 and 14.9±4.6 μm respectively yielding σ/rav=0.10, 0.27 and 0.31 respectively (where σ is the standard deviation and rav = dav/2 is the average radius of the compartment). The theory predicts that when the sample is characterized by a size distribution in which σ/rav>0.2, the diffusion-diffraction troughs vanish in s-PFG.
Figure 6.

Experiments on size distribution phantoms (89). (A) The volumetric ratio of sizes present in each size distribution phantom. (B) s-PFG experiments for a monodisperse phantom and for SD001-SD003 shown in (A). s-PFG experiments were carried out with Δ/δ=150/3 ms, in the long diffusion regime. Note the gradual loss in diffusion-diffraction troughs. (C) The magnitude calculated plots of d-PFG experiments for the phantoms. In these experiments, comparable to the s-PFG experiments, Δ1=Δ2=150 ms and δ1=δ2=δ3=3 ms were used with the sequence shown in Figure 4B. The data is plotted as a function of 2q, to enable easy comparison with s-PFG data. Note that the diffusion-diffraction patterns are easily observed; the location of the diffusion-diffraction minima shifts to the right between SD001 and SD003. (D) The real (not magnitude calculated) plots for the d-PFG experiments, shown for a partial range of q-values. The signal minimum increases with increasing σ/rav and the rate of return of the signal to zero is slower for increasing values of σ/rav.
The experimental signal decay from s-PFG experiments on the size distribution phantoms is shown in Figure 6B. The monodisperse microcapillaries yielded well resolved, deep diffusion-diffraction troughs, with the first minimum observed at q=638 cm−1, corresponding to a compartment size of 19.1 μm. However the E(q) profile changes dramatically when the measurements were performed on the SD001 phantom. Although SD001 was designed to have only a slight variation of diameters (σ/rav=0.10), the signal decay in s-PFG becomes profoundly shallower, yielding wider minima which are nevertheless still observable at q~680 cm−1. When SD002 and SD003 are used (σ/rav=0.27 and 0.31 respectively), the sharp diffusion-diffraction minima are almost completely lost, and it is no longer possible to obtain structural information from the phantom’s E(q) profile. A “bump” in the signal decay can be observed at q~1150 cm−1 for SD003, which may reflect a very shallow diffusion-diffraction dip, but from which accurate structural information cannot be obtained.
The E(q) plots for the d-PFG experiments performed on these phantoms have a qualitatively different behavior (Figure 6C) (the data were magnitude calculated and plotted as a function of 2q to be comparable to the s-PFG data). Here, the diffusion-diffraction minima are sharp and present for all of the size distribution phantoms used. The location of the first minima for 19 μm (monodisperse), SD001, SD002 and SD003 are observed at q=638, 680, 808, and 936 cm−1 respectively, corresponding to diameters of 19.1, 17.9, 15.1, and 13.0 μm respectively. These sizes are in good agreement with the average diameters of the size distribution phantoms, with a slight deviation towards smaller sizes, most likely due to a slight violation of the SGP approximation.
The real signal decay, without the magnitude calculation, for d-PFG experiments on the monodisperse and polydisperse size distribution phantoms is shown in Figure 6D. Note that the actual zero-crossing can be observed in these plots. Several features of these plots may be useful in understanding characteristics of the size distribution, at least qualitatively. The zero-crossing indicates, to a certain extent, the location of the peak of the distribution (although the theory suggests not exactly). Nevertheless, this is new microstructural information that is not accessible by s-PFG. Another feature that can be used to infer the width of the distribution is the q-value in which a minimum point of the plot is achieved: this point occurs at a higher value of E(q) (i.e., less signal attenuation) with an increasing width of distribution. Finally, the rate of return of the signal-to-noise level in the negative part also depends strongly on the width of the distribution (a manifestation of the lack of a second diffusion-diffraction trough in the magnitude calculated plots). The broader the distribution, the slower the signal returns to noise level.
In (81), it was also shown both theoretically and experimentally that the zero-crossing in specimens characterized by size distribution would be extremely sensitive to the mixing time, and would vanish even when relatively short mixing times are used. To observe zero-crossings in size distribution phantoms, it was demonstrated that the sequence shown in Figure 4B, in which tm=0 ms yields better results. When d-PFG experiments were performed on SD003 with tm=6 ms, the zero-crossings completely vanished, and it was impossible to extract microstructural information from the sample (81).
This comparative study demonstrated that zero-crossings offer new information absent from s-PFG MR. It should be noted that it requires a high SNR to detect these zero-crossings in d-PFG experiments, especially for broad distributions, since the signal is expected to remain quite low after the zero-crossings. Moreover, as the size distribution broadens, the location of the zero-crossing is shifted towards higher q-values, thus necessitating stronger gradients. For instance, to characterize compartments with dav = 1.5 μm and a moderate size distribution (such as axons in white matter) using the zero-crossings, one would still need to reach q-values of >10,000 cm−1! Moreover, to fulfill the SGP condition, very short gradient pulse durations would be necessary. While small gradient systems can be built that can produce more than 3000 G/cm (48), gradient systems capable of producing 5 G/cm are found in clinical settings due to safety issues and technological limitations. Therefore, accurately extracting compartmental dimensions at such weak gradient settings is desirable.
Extracting accurate compartmental dimensions from the angular dependence at low q-values
As mentioned in the “brief theoretical description of d-PFG” section, the low-q angular dependence was predicted to yield a signature for restricted diffusion from which significant microstructural parameters can be extracted even at low q-values. The full angular profile was first observed in (69,70), employing Mitra’s theory to analyze data from a complicated, multi-compartmental system, in which the ground-truth cannot be easily known; moreover, the difference in the experimental parameters from those required to use Mitra’s simple approximate expression was not explained or accounted for.
The general theoretical framework presented in (76,82,51) allowed accurate extraction of the compartmental dimensions using arbitrary experimental parameters, not limited to the particular and stringent experimental conditions required to use Mitra’s original framework. This new theory was tested in another recent study which was performed on the well characterized water-filled microcapillaries phantom (80). In that study, both sequences shown in Figures 4A and B were used. The angular dependence experiment was performed as follows: G1 was fixed along the x-direction and G2 was varied in the X–Y plane (see Figure 4F, for full experimental details see (80)). The angular dependence experiments were performed for microcapillaries of varying sizes, and for different values of the experimental parameters.
Figure 7A demonstrates the angular dependence observed from microcapillaries with a nominal ID of 5±1 μm using the sequence shown in Figure 4B (tm=0 ms) for different q-values, and with Δs long enough to probe the boundaries of the restricting geometry. The angular dependence can be clearly observed even at low q-values, and the compartmental dimension that is extracted for each q-value is accurate and in very good agreement with the nominal sizes (the results of the fit can be seen on the graph adjacent to the signal decay). Here, at the lowest q-value (q=253 cm−1, comparable to the q-value in which DTI is routinely performed), the gradient strength was only 15 G/cm. Moreover, an accurate estimate of the compartment dimension was extracted with even lower q-values (as low as 129 cm−1, data not shown). For comparison, the compartment size could only have been resolved otherwise by using the diffusion-diffraction patterns in s-PFG experiments: the q-value which would be needed to observe a diffusion-diffraction dip for 5 μm microcapillaries is 2440 cm−1. However, in order to fulfill the SGP condition, one would have to use very short gradient durations (<1 ms), which would necessitate gradient strengths of |G|>573 G/cm, and even then the diffusion-diffraction dip would likely shift to even higher q-values due to violation of the SGP condition. The angular dependence, from which accurate sizes were extracted was observed for microcapillaries with ID=9±1, 10±1, 19±1, 21±1 and 29±1 μm (data not shown).
Figure 7.

d-PFG angular experiments conducted on phantoms and the effects of experimental parameters on the signal decay (82,80). (A) Angular d-PFG experiments at different q-values for microcapillaries with nominal ID=5±1 μm. The experiments were conducted with Δ1=Δ2=30 ms, δ1=δ2=δ3=4 ms and with tm=0 ms. (B) The effect of prolonging the gradient duration in d-PFG experiments. These experiments were conducted on microcapillaries with ID=10±1 μm. The parameter u2 is plotted against the angle ϕ. (C) The effect of prolonging the mixing times in d-PFG experiments. These experiments were also conducted on microcapillaries with ID=10±1 μm and with Δ1=Δ2=40 ms and with δ1=δ2=δ3=1.5 ms. The parameter u2 is plotted against the angle ϕ. Note the loss of angular dependence at long mixing times when EA is present. (D) The effect of prolonging the diffusion periods in d-PFG experiments. These experiments were conducted on microcapillaries with ID=19±1 μm with δ1=δ2=δ3=1.5 ms and tm=0 ms. The parameter u2 is plotted against the angle ϕ. In all of the plots shown in this figure, the symbols represent experimental data while the solid lines represent the theoretical fittings to the data. All of the extracted sizes are given in μm.
An intuitive interpretation for the angular dependence of the signal values can be obtained by examining the signal at ϕ=0° and 180° using the sequence in which tm=0 ms, as in Figures 4B or D in the long diffusion limit. When ϕ=0°, the total effective gradient strength employed in the sequence is |Geff|=|G1|+|G2|; however, when ϕ=180° the middle gradient is absent—therefore, the effective gradient strength is half the size of that employed in ϕ=0°. Effectively, the diffusion period is now doubled, although in the long diffusion limit this is not significant. Since the effective gradient is cut in half for ϕ=180°, a reduced signal attenuation or higher E(q) is obtained.
The effects of varying different experimental parameters on the angular dependence was studied in (80). To suppress higher order terms, a combination of 4 q-values, (the highest satisfying the 2πqa~1 condition) was used, and the parameter u2 was plotted against ϕ. The parameter u2, whose dimensions are length2, as implied by Equation 3, is analogous to the rmsd of the diffusing moiety in s-PFG.
Figures 7B and C show both experimental results and simulations of the parameter u2 plotted as a function of ϕ for microcapillaries with ID of 10±1 μm with varying gradient durations and mixing times. Note that the u2 plots show an inverted bell-shaped function when the signal is plotted as a function of ϕ: this is tantamount to the normal bell shaped function when E(ϕ) is plotted. Figure 7B shows that even when the gradient duration is prolonged and the SGP condition is violated, the angular dependence is still observed. The fitting of the experimental results to the theory yielded extremely accurate compartmental dimensions even when the SGP condition was violated. Figure 7C shows how the angular profile is affected when the mixing time is prolonged; notably, at tm>0, the angular dependence is significantly diminished, and eventually the angular dependence is completely lost. The fitting to the theory again yielded excellent agreement with the nominal size even with finite tm (80), where the angular dependence was less pronounced. It should be noted that when tm is prolonged, the microscopic anisotropy is in fact suppressed, or “decoupled” from the CSA and EA effects. In the experiment, performed as shown in Figure 4F, the angular experiment is performed in the plane normal to the main axis of the microcapillaries; therefore, the molecules probe a circular cross section and in such an experiment CSA does not exist. This is the reason for the vanishing of the angular dependence at long tm: when tm is prolonged, μA effects are suppressed, and CSA does not exist. It should be noted that in cases of randomly oriented cylinders, or when the experiment is not performed in the plane perpendicular to the main axis of coherently packed cylinders, the CSA effects are predicted to take over at long mixing times, when the microscopic μA effects have been suppressed (51).
Figure 7D shows the u2 plots as a function of concomitantly increasing diffusion times in microcapillaries with ID=19±1 μm. As expected, the angular dependence almost disappears for very short values of Δ, since the microscopic anisotropy is then sampled only by a small fraction of the diffusing species. In this case, a value of 27.70±1.85 μm is obtained from the fit of the signal decay, inconsistent with the nominal compartment size. However, prolonging the diffusion period results in the expected angular dependence and the accurate compartmental dimensions can be extracted thereof. It should be noted that in (80), an inverted angular dependence was also shown for freely diffusing molecules in a non-restricted isotropic environment for the special case δ~Δ1=Δ2 (for the sequence shown in Figure 4B); there, the inverted angular dependence arises from diffusion during the superposed gradients. In (89,76), the angular dependence was also shown to persist in size distributions.
These studies demonstrated that the compartmental dimension can be accurately obtained even for very small, biologically relevant sizes. It was demonstrated that the angular dependence is most pronounced when the mixing time is zero, gradient durations are short, and diffusion periods are sufficiently long to probe the boundaries of the restricting compartment. The angular dependence also becomes more pronounced with increasing q-values (82). Importantly, it was shown that the theoretical framework could account for variation in any experimental parameter, and as long as the diffusion periods are sufficiently long to probe the boundaries, accurate compartment sizes were obtained for any combination of experimental parameters.
d-PFG in bi-compartmental phantoms
The phantoms used in the previous sections were constructed to produce restricted diffusion. However, many systems consist of bi- or multiple compartments, in which different diffusion modes coexist. One of the most prevalent situations is when free and restricted diffusion coexist. For instance, porous media that are immersed in a solvent constitute a system where diffusion is restricted within the compartments, but is free in the interstices. This scenario can also pertain to cell suspensions (restricted within the cells, free in the medium outside) or emulsions (restricted within the emulsion, free outside). In biological applications, contribution of water from CSF to a voxel that contains white matter or even intra- and extra-cellular water can also be regarded as systems in which the two diffusion modes can coexist. Moreover, crossing fibers, which are exactly perpendicular to one another, constitute a multi-compartmental system. It would therefore be instructive to study a phantom which represents the scenario presented above, and to study what microstructural features could be obtained in such cases.
To study the signal decay in both s- and d-PFG experiments when restricted and free diffusion coexist, a bi-compartmental phantom was constructed (Figure 8A) (for full details, see (81)). Briefly, the bi-compartmental phantom consists of microcapillaries in which restricted diffusion occurs (termed slow diffusion compartment, SDC), which are placed in a 5 mm NMR tube, which is, in turn placed inside an 8 mm NMR tube filled with a fixed quantity of H2O in D2O (forming the fast diffusion compartment, FDC). The two compartments were completely isolated from each other (i.e., with no exchange), and the FDC was doped with CuSO4 to compensate for relaxation artifacts (Figure 8A) (81). The advantage of using such a phantom is that the ground-truth still remains well characterized, namely the orientation of the compartments in the SDC as well as their size is known, and the diffusion coefficient of the water in the FDC is also well known. Therefore, this phantom can be used to investigate the effect of superposing restricted and free diffusion on the signal decay, and to test the theoretical framework in terms of what microstructural information can still be obtained.
Figure 8.

Single- and double-PFG experiments in the bi-compartmental phantom (81). (A) Cartoon of the bi-compartmental phantom. Microcapillaries are inserted to a 5 mm NMR tube, which is then inserted to an 8 mm NMR tube filled with known quantities of H2O in D2O. Note that the water diffusing freely in the free diffusion compartment (FDC) is completely separated from the microcapillaries (no exchange). The microcapillaries serve as the slow diffusion compartment (SDC) in which restricted diffusion occurs. (B) The s-PFG E(q) plots for varying values of Δ. Note that in the high q-regime, the diffusion-diffraction minima can be gradually observed. At the low q-values, the signal attenuation resembles free diffusion. The experiments were performed on microcapillaries with ID=19±1 μm and with δ=2 ms. (C) E(q) plots for increasing amounts of water in the FDC. The experiments were performed on microcapillaries with ID=19±1 μm and with Δ/δ=100/2 ms. (D) E(q) plots for d-PFG experiments at two different values of diffusion periods and for two different amounts of water in the FDC. The same signal trends were observed as in s-PFG experiments. In all of the plots shown in this figure, the symbols represent experimental data while the solid lines represent the theoretical fittings to the data.
In a bi-compartmental phantom, it is instructive to first consider two major determinants on the signal decay in s-PFG experiments, namely the effect of the diffusion time and the effect of increasing the ratio of VFDC/VSDC, where Vi is the volume of water in each compartment. The effect of prolonging the diffusion time is shown in Figure 8B for a bi-compartmental phantom. At very short diffusion time such as Δ=4 and 10 ms, which are not sufficient to probe the boundaries of the 19±1 μm microcapillaries in the SDC, a free diffusion profile is observed. Prolonging the diffusion time reveals two regimes of diffusion in the signal decay profile. At the high q-values the diffusion-diffraction troughs first appear, and when the long diffusion limit is reached (Δ=100 ms in this case), the signal remains the same for longer Δ. However, at the lower q-values, the signal is continuously attenuating with increasing Δ, thereby exhibiting a free profile. There is excellent agreement between the theoretical curves fitted to the theory, and for Δ>25 ms, an accurate compartment size could be extracted for the microcapillaries in the SDC (81).
Figure 8C shows the dependence of the signal decay on the amount of water in the FDC, while the amount of water in the SDC remains constant. Here, the experiment was performed with Δ sufficiently long to probe the boundaries of the restricting compartment. Notably, the diffusion-diffraction trough remains in the same location, but the signal in the lower q-values shows a significant attenuation when the amount of water in the FDC is increased. Moreover, the q-value in which the transition from free to restricted diffusion occurs is observed at higher q-values, probably since the larger amount of free water generates sufficient SNR to be detected even at somewhat higher q-values. From these findings, the utility of employing relatively high q-values and long diffusion periods is apparent: the free diffusion at low q-values simply masks the restricted diffusion, and therefore the microstructural information that can be obtained thereof is impaired. In (81), it was shown that microstructural information can be retrieved at higher q-values for a phantom of crossing microcapillaries, which exhibits a precise bi-compartmental behavior; at low q-values, as are customary from DTI, the free diffusion indeed masks the restricted compartment, affording only information regarding the free diffusion; at higher q-values the diffusion-diffraction minima are present, enabling extraction of size and direction of restriction.
Figure 8D shows a d-PFGxx experiment conducted on the bi-compartmental phantom with two different diffusion periods and for two different amounts of H2O in the FDC. The same signal trends that were observed for s-PFG were also observed for the d-PFG experiments. The zero-crossings (manifested as a diffusion-diffraction dip in Figure 8D due to the magnitude calculation) appear at the same q-value for both Δ1=Δ2=100 and 200 ms (both sufficiently long to fully probe the boundaries of the restricting compartment); however, the signal at the low q-values continuously attenuates when Δs are prolonged, exhibiting free diffusion. When the volume fraction of FDC is enlarged, the q-value in which the transition from free to restricted diffusion is observed is shifted to higher q-values (Figure 8D).
Angular dependence in the bi-compartmental phantom
As mentioned in the section above, the signal arising from the SDC, which is often desirable for extracting microstructural information, is masked by the signal from the FDC at low q-values. In reference (81), the effect of superposing two diffusion modes on the angular dependence was also addressed. The angular d-PFG experiment shown in Figure 4F, i.e., where G1 is fixed along the x-axis and G2 is varied in the X–Y plane (under the long diffusion periods condition), was performed on the bi-compartmental phantom at different q-values and with Δs long enough to probe the boundaries of the restricting compartment within the SDC using the sequence shown in Figure 4B (tm=0 ms). Figure 9A shows the E(q) plot for two different diffusion periods for θ=90° and ϕ=0° (i.e., the d-PFGxx experiment), and the q-values for which the angular experiments were performed. The angular profiles obtained revealed two distinct behaviors: at very low q-values (q<129 cm−1), the angular dependence was not observed [Figure 9B], and the microstructural information of the compartments was lost; however, at somewhat higher q-values, the full angular profile was retained (Figure 9C), from which accurate compartmental dimensions were extracted (81). It should be noted that when only the SDC exists, i.e., without free water, the angular dependence is observed even at the lowest q-values such as those depicted in Figure 9B. Figure 9D shows the actual resonances from the experiment for 3 q-values, from which the robustness of the results is apparent. It should be noted that in these experiments, even though the volume fraction of free water was relatively large, the angular dependence could be observed using weak gradients (G=15 G/cm) and accurate microstructural information could be obtained. Additionally, the angular dependence can be observed even at lower q-values when the diffusion periods are prolonged (81), in which case the free diffusion is further attenuated and no longer masks the restricted component, thus providing a means to probe microstructural information at low q-values even when the specimen has a significant free diffusion compartment.
Figure 9.

d-PFG angular experiments in the bi-compartmental phantoms (81). In this case, the bi-compartmental phantom consisted of microcapillaries with ID=19±1 μm as the SDC and 20 μl of water in the FDC. (A) The d-PGSE data for ϕ=0°. The diffusion times in this experiment were Δ1=Δ2=100 or 200 ms (black squares and red circles respectively). The vertical black lines represent the q-values for which the angular profile is presented in Figure 9B and 9C. (B) The signal intensity plotted against ϕ for the q-values between 34 and 72 cm−1. (C) The signal intensity plotted against ϕ for the q-values between 129 and 298 cm−1. The solid curves in Figures 9A–C represent the theoretical fitting of the experimental data. (D) Raw data for 3 selected q-values of the signal intensity plotted against ϕ. In all of the plots shown in this figure, the symbols represent experimental data while the solid lines represent the theoretical fittings to the data.
Comparing s-PFG and d-PFG experiments
An interesting phenomenon occurs when the signal decay from s-PFG is compared to the signal decay of d-PFG in the bi-compartmental phantom. In (53,87), it was shown that when only a single compartment exists in which restricted diffusion occurs, the location of the zero-crossings in d-PFG occurs at half the q-value as compared to the location of the diffusion-diffraction troughs in s-PFG. Therefore, by plotting the signal decay in d-PFG as a function of 2q, s-PFG and d-PFG signal decays are comparable.
In the bi-compartmental phantom, plotting the signal decay of d-PFG as a function of 2q indeed yields zero-crossings in the same location, such as s-PFG (Figure 10A, d-PFG data is magnitude calculated to reveal the diffraction-like patterns); however, in that case, the signal in the low q-values which exhibits free diffusion then is not comparable. However, when the signal decay of d-PFG is plotted against 21/2q, the signal in the free regime is comparable between the two methodologies, but then the location of the diffusion-diffraction minima are not (Figure 10B). This peculiarity arises from the different scaling laws governing the signal decay in d-PFG for the different diffusion modes (81). Therefore, care should be exercised when comparing the microstructural information when different modes of diffusion are present within the same sample.
Figure 10.

Comparison between s-PFG and d-PFG signal decays at the different q regimes (81). The bi-compartmental phantom consisted of microcapillaries with ID=19±1 μm as the SDC and 100 μl of water in the FDC. (A) The s-PGSE data is plotted against q (black squares) while the d-PGSE is plotted against 2q (red circles). (B) The s-PGSE data is plotted against q (black squares) while the d-PGSE data is plotted against 21/2*q (red circles). The solid lines represent the theoretical curves fitted to the data.
d-PFG MRI
While d-PFG NMR provides powerful new parameters and features with which to characterize ex vivo biological specimen and other materials, a desideratum would be to produce maps or images of computed quantities in vivo to aid in characterizing microstructural and architectural features of heterogeneous, anisotropic, and optically turbid biological tissue like brain gray and white matter. Double-PFG MRI—combining d-PFG NMR with MRI—offers the potential to produce such quantitative maps.
The promise and potential of d-PFG MRI is that its improved sensitivity and selectivity to fine microstructural details and features would enable discrimination among different tissue types and architectural motifs that presently are not detectable or discernable using conventional s-PFG MRI methods. These include DTI, all High Angular Resolution Diffusion Imaging (HARDI) methods like Q-Ball MRI (90), all Higher Order Tensor (HOT) methods (91,92), Composite Hindered And Restricted Model of Diffusion (CHARMED) (93–95), Diffusion Orientation Transform (DOT) (96) and Diffusion Spectrum Imaging (DSI) (97,98). Specifically, this new microstructural information would enable us to segment, classify, and cluster different tissues within an imaging volume on the basis of features of the axon diameter distribution, or quantities like cell density, cell shape, extracellular volume fraction, etc. This is extremely important information to be able to measure from a biological standpoint, as well as in following normal and abnormal development, degeneration, disease, and aging processes.
In principle, by analogy to Diffusion Weighted MRI (DWI), it is possible to embed a d-PFG NMR sequence within a conventional MRI sequence to achieve d-PFG MRI (Figure 11A). Because of a number of experimental difficulties and theoretical complexities (e.g., the proliferation of “cross-terms” between and among imaging and diffusion gradients, the creation of multiple echoes), it is prudent to separate the d-PFG NMR block and the MRI block in the sequence, effectively using the d-PFG NMR sequence as a “filter” for the subsequent MRI block that provides spatial localization. This approach was first demonstrated by Komlosh (99).
Figure 11.

d-PFG MRI sequences. (A) The d-PFG imaging MRI sequence in which the imaging gradients are embedded within the sequence and (B) d-PFG filtered MRI sequence in which d-PFG is concatenated prior to an imaging block.
For the detection of locally anisotropic voxels in pig spinal cord (60), long τm d-PFG NMR sequences were concatenated to an MRI block to form a d-PFG filtered MRI sequence (Figure 11B). This sequence starts with the d-PFG block in which hard RF pulses are applied to form the echo at the point the imaging block is applied. The use of hard pulses reduces artifacts resulting from RF inhomogeneity when using shaped pulses. The disadvantage of a d-PFG filtered MRI sequence is that it prolongs the experiment duration, resulting in a loss of signal due to T2 relaxation, which can generally be compensated for by using a stimulated echo sequence instead of the spin echo sequence. While the proof of principle was demonstrated on a “gray matter” phantom (59), the robustness of the imaging sequence was recently shown on a phantom consisting of arrays of microcapillaries, where quantitative size maps could be generated (100). The new theoretical framework that was used in this study incorporated and modeled the effect of all cross-terms between diffusion and imaging gradients as well as the “fat gradient pulses” during which can result in additional diffusion attenuation (100).
Other groups began developing d-PFG MRI sequences as well. Under the terminology of double-wave-vector (DWV) imaging, Koch and Finsterbusch conducted an angular d-PFG MRI experiment with finite tm in three specimens: acrylate beads, radish and excised pig spinal cord (69) and in human corticospinal tract (70). In these studies, the angle between q-vectors applied in the two PGSE blocks was systematically varied within a d-PFG MRI sequence. In (69) Koch et al. used an expansion of Mitra’s theory, assuming a bi-compartmental model in which free (Gaussian) and restricted diffusion are superimposed for all three specimens, including the pig spinal cord. The extracted compartment size in the three specimens (69), and in a fiber of corticospinal tract tissue (70) were reported, and the sizes were on the expected order of magnitude, although no experimental evidence was presented to validate the MR findings. In subsequent studies, Monte Carlo simulations were used to assess the effect of deviating from Mitra’s limiting conditions where it was found that such deviations significantly alter the extracted sizes (71,74). The findings were consistent with the effect of varying experimental parameters in s-PFG (29): when δ is prolonged, the extracted size is smaller (due to violation of the SGP approximation), and a smaller size will also be obtained when Δ is too short to probe the boundaries of the restricting compartment. Another finding was that the higher the q-value in which the d-PFG is performed, the larger the deviation of the extracted size, owing to the deviation from Mitra’s condition (2πqR<1), and that in smaller compartments (such as axons in the CNS) the deviation would be most significant.
In (71), the angular dependence was observed when a d-PFG MRI sequence with tm=0 ms was used to investigate compartment sizes in the excised rat spinal cord, and it was shown that the apparent size varies with the diffusion periods as expected from the Monte Carlo simulations. Further Monte Carlo simulations were used to study the signal decay in multiple-PFG (73) and in various tensor approaches (72,75), all utilizing expansions of Mitra’s theory to analyze the signal decay.
These studies accentuate the need for using the new theoretical framework (51,82) for extracting accurate compartmental dimensions when non-idealized experimental parameters are used. In (80), it was shown that using Mitra’s theory leads to substantial deviations from the nominal size even in water-filled microcapillaries in d-PFG spectroscopy, while accurate sizes are extracted from the new theoretical framework. These deviations are most likely to become even more significant when imaging sequences are used in complex tissue such as neuronal tissue, characterized by multiple diffusion modes, size and orientation distributions, and exchange. Therefore, experimental validation of the MRI results and the theoretical framework, which should take into account “fat” gradient pulses and cross terms between and among diffusion and imaging gradients, is imperative.
Looking forward to future clinical applications of d-PFG MRI, it is necessary to use soft RF pulses and incorporate the d-PFG block within the imaging block due to clinical instrument limitation. In this setup, where imaging and diffusion gradients are intertwined and cross-terms may come into play, a model, such as the new theoretical framework (82), that indeed takes into account all gradients used in the sequence must be applied to analyze the signal decay.
Summary and an assessment of future prospects
The d-PFG methodology holds great promise as a probe for gleaning important new microstructural information in complex specimens (such as neuronal tissues) owing to the significant experimental and theoretical advances presented in this review. The first step, validation of the new theoretical framework of restricted diffusion in d-PFG, has been achieved by using MR phantoms in which the ground-truth is known a priori. Indeed, the experimental results and theoretical predictions are in excellent agreement. Most importantly, d-PFG MR yields accurate compartmental dimensions at low q-values, exhibits zero-crossings when size distributions are present, and provides microstructural information in randomly oriented compartments that are macroscopically isotropic. The general theoretical framework can account for variations of every experimental parameter in the d-PFG NMR or MRI sequence; therefore, it provides an extremely accurate means for extracting the novel microstructural information.
The d-PFG may become extremely useful in at least two significant biomedical applications: In white matter, it may characterize axon sizes and size distributions at low, clinically achievable q-values; in the grey matter, it may provide important information regarding the size and shape of randomly oriented cells and cell processes. Moreover, d-PFG can even be used to “filter” unwanted components or compartment, so it may play an important role in basic research, e.g., to help make assignments of water in different intra and extracellular compartments.
Double-PFG MRI, although in its infancy, may well provide new contrasts that may have clinical relevance. For example, mapping axonal sizes or size distributions using clinically achievable magnetic field gradients may become an important tool for characterizing white matter development and disease. New microstructural features may be even more important in characterizing grey matter, in which conventional s-PFG MRI methods provide limited information. Further studies are needed to evaluate the applicability of d-PFG as a probe for microstructural information in tissues, and new modeling and analysis schemes may be needed to describe diffusion in more complex media. It should be noted that although this review focuses on biological oriented applications, the principles demonstrated are general and should be valid in a variety of other applications such as in MR of porous media, for example to characterize emulsions or rocks.
Acknowledgments
P.J.B, M.E.K., and E.Ö. were all supported by the Intramural Research Program of the Eunice Kennedy Shriver National Institute of Child Health and Human Development, NIH. We thank Ms. Liz Salak for editing the manuscript.
References
- 1.Hahn EL. Spin echoes. Phys Rev. 1950;80:580–594. [Google Scholar]
- 2.Carr HY, Purcell EM. Effects of Diffusion on free precession in nuclear magnetic resonance experiments. Phys Rev. 1954;94:630–638. [Google Scholar]
- 3.Stejskal EO, Tanner JE. Spin diffusion measurements - spin echoes in presence of a time-dependent field gradient. J Chem Phys. 1965;42:288–292. [Google Scholar]
- 4.Price WS. Pulsed-field gradient nuclear magnetic resonance as a tool for studying translational diffusion.1. Basic theory. Concepts Magn Reson. 1997;9:299–336. [Google Scholar]
- 5.Johnson CS. Diffusion ordered nuclear magnetic resonance spectroscopy: principles and applications. Prog Nucl Magn Reson Spectrosc. 1999;34:203–256. [Google Scholar]
- 6.Le Bihan D, Mangin JF, Poupon C, Clark CA, Pappata S, Molko N, Chabriat H. Diffusion tensor imaging: Concepts and applications. J Magn Reson Imaging. 2001;13:534–546. doi: 10.1002/jmri.1076. [DOI] [PubMed] [Google Scholar]
- 7.Basser PJ, Jones DK. Diffusion-tensor MRI: theory, experimental design and data analysis - a technical review. NMR Biomed. 2002;15:456–467. doi: 10.1002/nbm.783. [DOI] [PubMed] [Google Scholar]
- 8.Clark CA, Werring DJ. Diffusion tensor imaging in spinal cord: methods and applications - a review. NMR Biomed. 2002;15:578–586. doi: 10.1002/nbm.788. [DOI] [PubMed] [Google Scholar]
- 9.Horsfield MA, Jones DK. Applications of diffusion-weighted and diffusion tensor MRI to white matter diseases - a review. NMR Biomed. 2002;15:570–577. doi: 10.1002/nbm.787. [DOI] [PubMed] [Google Scholar]
- 10.Cohen Y, Assaf Y. High b-value q-space analyzed diffusion-weighted MRS and MRI in neuronal tissues - a technical review. NMR Biomed. 2002;15:516–542. doi: 10.1002/nbm.778. [DOI] [PubMed] [Google Scholar]
- 11.Cohen Y, Avram L, Frish L. Diffusion NMR spectroscopy in supramolecular and combinatorial chemistry: An old parameter - New insights. Angew Chem Int Ed. 2005;44:520–554. doi: 10.1002/anie.200300637. [DOI] [PubMed] [Google Scholar]
- 12.Mori S, van Zijl PC. Fiber tracking: principles and strategies - a technical review. NMR Biomed. 2002;15:468–480. doi: 10.1002/nbm.781. [DOI] [PubMed] [Google Scholar]
- 13.Beaulieu C. The basis of anisotropic water diffusion in the nervous system - a technical review. NMR Biomed. 2002;15:435–455. doi: 10.1002/nbm.782. [DOI] [PubMed] [Google Scholar]
- 14.Sen PN. Diffusion and tissue microstructure. J Phys Condens Matter. 2004;16:S5213–S5220. [Google Scholar]
- 15.Özarslan E, Shemesh N, Komlosh ME, Cohen Y, Basser PJ. Double-PFG as a probe for microstructures: theoretical aspects. Prog Nucl Magn Reson Spectrosc. invited review, in-preparation. [Google Scholar]
- 16.Moseley ME, Cohen Y, Kucharczyk J, Mintorovitch J, Asgari HS, Wendland MF, Tsuruda J, Norman D. Diffusion-weighted MR imaging of anisotropic water diffusion in cat central-nervous-system. Radiol. 1990;176:439–445. doi: 10.1148/radiology.176.2.2367658. [DOI] [PubMed] [Google Scholar]
- 17.Moseley ME, Cohen Y, Mintorovitch J, Chileuitt L, Shimizu H, Kucharczyk J, Wendland MF, Weinstein PR. Early detection of regional cerebral-ischemia in cats - comparison of diffusion-weighted and T2-weighted MRI and spectroscopy. Magn Reson Med. 1990;14:330–346. doi: 10.1002/mrm.1910140218. [DOI] [PubMed] [Google Scholar]
- 18.Moseley ME, Kucharczyk J, Mintorovitch J, Cohen Y, Kurhanewicz J, Derugin N, Asgari H, Norman D. Diffusion-weighted MR Imaging of acute stroke - correlation with T2-weighted and magnetic susceptibility-enhanced MR imaging in cats. Am J Neuroradiol. 1990;11:423–429. [PMC free article] [PubMed] [Google Scholar]
- 19.Basser PJ, Mattiello J, Lebihan D. Estimation of the effective self-diffusion tensor from the NMR spin-echo. J Magn Reson B. 1994;103:247–254. doi: 10.1006/jmrb.1994.1037. [DOI] [PubMed] [Google Scholar]
- 20.Callaghan PT, Codd SL, Seymour JD. Spatial coherence phenomena arising from translational spin motion in gradient spin echo experiments. Concepts Magn Reson. 1999;11:181–202. [Google Scholar]
- 21.Sen PN. Time-dependent diffusion coefficient as a probe of geometry. Concepts Magn Reson Part A. 2004;23A:1–21. [Google Scholar]
- 22.Sotak CH. The role of diffusion tensor imaging in the evaluation of ischemic brain injury - a review. NMR Biomed. 2002;15:561–569. doi: 10.1002/nbm.786. [DOI] [PubMed] [Google Scholar]
- 23.Assaf Y, Cohen Y. Non-mono-exponential attenuation of water and N-acetyl aspartate signals due to diffusion in brain tissue. J Magn Reson. 1998;131:69–85. doi: 10.1006/jmre.1997.1313. [DOI] [PubMed] [Google Scholar]
- 24.Assaf Y, Ben-Bashat D, Chapman J, Peled S, Biton IE, Kafri M, Segev Y, Hendler T, Korczyn AD, Graif M, Cohen Y. High b-value q-space analyzed diffusion-weighted MRI: Application to multiple sclerosis. Magn Reson Med. 2002;47:115–126. doi: 10.1002/mrm.10040. [DOI] [PubMed] [Google Scholar]
- 25.Niendorf T, Dijkhuizen RM, Norris DG, Campagne MV, Nicolay K. Biexponential diffusion attenuation in various states of brain tissue: Implications for diffusion-weighted imaging. Magn Reson Med. 1996;36:847–857. doi: 10.1002/mrm.1910360607. [DOI] [PubMed] [Google Scholar]
- 26.Callaghan PT, Coy A, Macgowan D, Packer KJ, Zelaya FO. Diffraction-like effects in NMR diffusion studies of fluids in porous solids. Nature. 1991;351:467–469. [Google Scholar]
- 27.Callaghan PT. Pulsed-gradient spin-echo NMR for planar, cylindrical, and spherical pores under conditions of wall relaxation. J Magn Reson A. 1995;113:53–59. [Google Scholar]
- 28.Avram L, Assaf Y, Cohen Y. The effect of rotational angle and experimental parameters on the diffraction patterns and micro-structural information obtained from q-space diffusion NMR: implication for diffusion in white matter fibers. J Magn Reson. 2004;169:30–38. doi: 10.1016/j.jmr.2004.03.020. [DOI] [PubMed] [Google Scholar]
- 29.Avram L, Özarslan E, Assaf Y, Bar-Shir A, Cohen Y, Basser PJ. Three-dimensional water diffusion in impermeable cylindrical tubes: theory versus experiments. NMR Biomed. 2008;21:888–898. doi: 10.1002/nbm.1277. [DOI] [PMC free article] [PubMed] [Google Scholar]
- 30.Codd SL, Callaghan PT. Spin echo analysis of restricted diffusion under generalized gradient waveforms: Planar, cylindrical, and spherical pores with wall relaxivity. J Magn Reson. 1999;137:358–372. doi: 10.1006/jmre.1998.1679. [DOI] [PubMed] [Google Scholar]
- 31.Coy A, Callaghan PT. Pulsed gradient spin-echo NMR diffusive diffraction experiments on water surrounding close-packed polymer spheres. J Colloid Interface Sci. 1994;168:373–379. [Google Scholar]
- 32.Coy A, Callaghan PT. Pulsed gradient spin-echo nuclear-magnetic-resonance for molecules diffusing between partially reflecting rectangular barriers. J Chem Phys. 1994;101:4599–4609. [Google Scholar]
- 33.Topgaard D, Malmborg C, Soderman O. Restricted self-diffusion of water in a highly concentrated W/O emulsion studied using modulated gradient spin-echo NMR. J Magn Reson. 2002;156:195–201. doi: 10.1006/jmre.2002.2556. [DOI] [PubMed] [Google Scholar]
- 34.Bar-Shir A, Avram L, Özarslan E, Basser PJ, Cohen Y. The effect of the diffusion time and pulse gradient duration ratio on the diffraction pattern and the structural information estimated from q-space diffusion MR: Experiments and simulations. J Magn Reson. 2008;194:230–236. doi: 10.1016/j.jmr.2008.07.009. [DOI] [PMC free article] [PubMed] [Google Scholar]
- 35.Bar-Shir A, Cohen Y. Crossing fibers, diffractions and nonhomogeneous magnetic field: correction of artifacts by bipolar gradient pulses. Magn Reson Imaging. 2008;26:801–808. doi: 10.1016/j.mri.2008.01.051. [DOI] [PubMed] [Google Scholar]
- 36.Kuchel PW, Coy A, Stilbs P. NMR “diffusion-diffraction” of water revealing alignment of erythrocytes in a magnetic field and their dimensions and membrane transport characteristics. Magn Reson Med. 1997;37:637–643. doi: 10.1002/mrm.1910370502. [DOI] [PubMed] [Google Scholar]
- 37.Pages G, Szekely D, Kuchel PW. Erythrocyte-shape evolution recorded with fast-measurement NMR diffusion-diffraction. J Magn Reson Imaging. 2008;28:1409–1416. doi: 10.1002/jmri.21588. [DOI] [PubMed] [Google Scholar]
- 38.Kuntz JF, Trausch G, Palmas P, Mutzenhardt P, Canet D. Diffusive diffraction phenomenon in a porous polymer material observed by NMR using radio-frequency field gradients. J Chem Phys. 2007;126:134904. doi: 10.1063/1.2713379. [DOI] [PubMed] [Google Scholar]
- 39.Cory DG, Garroway AN. Measurement of translational displacement probabilities by NMR - an indicator of compartmentation. Magn Reson Med. 1990;14:435–444. doi: 10.1002/mrm.1910140303. [DOI] [PubMed] [Google Scholar]
- 40.Assaf Y, Mayk A, Cohen Y. Displacement imaging of spinal cord using q-space diffusion-weighted MRI. Magn Reson Med. 2000;44:713–722. doi: 10.1002/1522-2594(200011)44:5<713::aid-mrm9>3.0.co;2-6. [DOI] [PubMed] [Google Scholar]
- 41.Bar-Shir A, Cohen Y. High b-value q-space diffusion MRS of nerves: structural information and comparison with histological evidence. NMR Biomed. 2008;21:165–174. doi: 10.1002/nbm.1175. [DOI] [PubMed] [Google Scholar]
- 42.Bar-Shir A, Cohen Y. The effect of the rotational angle on MR diffusion indices in nerves: Is the rms displacement of the slow-diffusing component a good measure of fiber orientation? J Magn Reson. 2008;190:33–42. doi: 10.1016/j.jmr.2007.10.007. [DOI] [PubMed] [Google Scholar]
- 43.van Zijl PC, et al. q-space diffusion MRI review. NMR Biomed. 2009 special review issue on diffusion. [Google Scholar]
- 44.Bar-Shir A, Duncan ID, Cohen Y. QSI and DTI of excised brains of the myelin-deficient rat. Neuroimage. 2009;48:109–116. doi: 10.1016/j.neuroimage.2009.06.019. [DOI] [PubMed] [Google Scholar]
- 45.Biton IE, Duncan ID, Cohen Y. q-space diffusion of myelin-deficient spinal cords. Magn Reson Med. 2007;58:993–1000. doi: 10.1002/mrm.21389. [DOI] [PubMed] [Google Scholar]
- 46.Farrell JA, Smith SA, Gordon-Lipkin EM, Reich DS, Calabresi PA, van Zijl PC. High b-value q-space diffusion-weighted MRI of the human cervical spinal cord in vivo: feasibility and application to multiple sclerosis. Magn Reson Med. 2008;59:1079–1089. doi: 10.1002/mrm.21563. [DOI] [PMC free article] [PubMed] [Google Scholar]
- 47.Nossin-Manor R, Duvdevani R, Cohen Y. Effect of experimental parameters on high b-value q-space MR images of excised rat spinal cord. Magn Reson Med. 2005;54:96–104. doi: 10.1002/mrm.20519. [DOI] [PubMed] [Google Scholar]
- 48.Ong HH, Wright AC, Wehrli SL, Souza A, Schwartz ED, Hwang SN, Wehrli FW. Indirect measurement of regional axon diameter in excised mouse spinal cord with q-space imaging: Simulation and experimental studies. Neuroimage. 2008;40:1619–1632. doi: 10.1016/j.neuroimage.2008.01.017. [DOI] [PMC free article] [PubMed] [Google Scholar]
- 49.Assaf Y, Blumenfeld-Katzir T, Yovel Y, Basser PJ. AxCaliber: A method for measuring axon diameter distribution from diffusion MRI. Magn Reson Med. 2008;59:1347–1354. doi: 10.1002/mrm.21577. [DOI] [PMC free article] [PubMed] [Google Scholar]
- 50.Barazany D, Basser PJ, Assaf Y. In vivo measurement of axon diameter distribution in the corpus callosum of rat brain. Brain. 2009;132:1210–1220. doi: 10.1093/brain/awp042. [DOI] [PMC free article] [PubMed] [Google Scholar]
- 51.Özarslan E. Compartment shape anisotropy (CSA) revealed by double pulsed field gradient MR. J Magn Reson. 2009;199:56–67. doi: 10.1016/j.jmr.2009.04.002. [DOI] [PMC free article] [PubMed] [Google Scholar]
- 52.Khrapitchev AA, Callaghan PT. Double PGSE NMR with stimulated echoes: Phase cycles for the selection of desired encoding. J Magn Reson. 2001;152:259–268. [Google Scholar]
- 53.Özarslan E, Basser PJ. MR diffusion-“diffraction” phenomenon in multi-pulse-field-gradient experiments. J Magn Reson. 2007;188:285–294. doi: 10.1016/j.jmr.2007.08.002. [DOI] [PMC free article] [PubMed] [Google Scholar]
- 54.Callaghan PT, Godefroy S, Ryland BN. Use of the second dimension in PGSE NMR studies of porous media. Magn Reson Imag. 2003;21:243–248. doi: 10.1016/s0730-725x(03)00131-0. [DOI] [PubMed] [Google Scholar]
- 55.Cory DG, Garroway AN, Miller JB. Applications of spin transport as a probe of local geometry. Polymer Preprints. 1990;31:149. [Google Scholar]
- 56.Mitra PP. Multiple Wave-Vector Extensions of the NMR pulsed-field-gradient spin-echo diffusion measurement. Phys Rev B. 1995;51:15074–15078. doi: 10.1103/physrevb.51.15074. [DOI] [PubMed] [Google Scholar]
- 57.Cheng Y, Cory DG. Multiple scattering by NMR. J Am Chem Soc. 1999;121:7935–7936. [Google Scholar]
- 58.Callaghan PT, Komlosh ME. Locally anisotropic motion in a macroscopically isotropic system: displacement correlations measured using double pulsed gradient spin-echo NMR. Magn Reson Chem. 2002;40:S15–S19. [Google Scholar]
- 59.Komlosh ME, Horkay F, Freldlin RZ, Nevo U, Assaf Y, Basser PJ. Detection of microscopic anisotropy in gray matter and in a novel tissue phantom using double Pulsed Gradient Spin Echo MR. J Magn Reson. 2007;189:38–45. doi: 10.1016/j.jmr.2007.07.003. [DOI] [PubMed] [Google Scholar]
- 60.Komlosh ME, Lizak MJ, Horkay F, Freidlin RZ, Basser PJ. Observation of microscopic diffusion anisotropy in the spinal cord using double-pulsed gradient spin echo MRI. Magn Reson Med. 2008;59:803–809. doi: 10.1002/mrm.21528. [DOI] [PubMed] [Google Scholar]
- 61.Momot KI, Kuchel PW. PFG NMR diffusion experiments for complex systems. Concepts Magn Reson A. 2006;28A:249–269. [Google Scholar]
- 62.Jerschow A, Muller N. Suppression of convection artifacts in stimulated-echo diffusion experiments. Double-stimulated-echo experiments. J Magn Reson. 1997;125:372–375. [Google Scholar]
- 63.Seymour JD, Callaghan PT. Generalized approach to NMR analysis of flow and dispersion in porous media. AIChE Journal. 1997;43:2096–2111. [Google Scholar]
- 64.Blumich B, Callaghan PT, Damion RA, Han S, Khrapitchev AA, Packer KJ, Stapf S. Two-dimensional NMR of velocity exchange: VEXSY and SERPENT. J Magn Reson. 2001;152:162–167. doi: 10.1006/jmre.2001.2395. [DOI] [PubMed] [Google Scholar]
- 65.Callaghan PT, Khrapitchev AA. Time-dependent velocities in porous media dispersive flow. Magn Reson Imaging. 2001;19:301–305. doi: 10.1016/s0730-725x(01)00240-5. [DOI] [PubMed] [Google Scholar]
- 66.Callaghan PT, Furo I. Diffusion-diffusion correlation and exchange as a signature for local order and dynamics. J Chem Phys. 2004;120:4032–4038. doi: 10.1063/1.1642604. [DOI] [PubMed] [Google Scholar]
- 67.Callaghan PT, Arns CH, Galvosas P, Hunter MW, Qiao Y, Washburn KE. Recent Fourier and Laplace perspectives for multidimensional NMR in porous media. Magn Reson Imaging. 2007;25:441–444. doi: 10.1016/j.mri.2007.01.114. [DOI] [PubMed] [Google Scholar]
- 68.Galvosas P, Qiao Y, Schonhoff M, Callaghan PT. On the use of 2D correlation and exchange NMR spectroscopy in organic porous materials. Magn Reson Imaging. 2007;25:497–500. doi: 10.1016/j.mri.2006.11.009. [DOI] [PubMed] [Google Scholar]
- 69.Koch MA, Finsterbusch J. Compartment size estimation with double wave vector diffusion-weighted Imaging. Magn Reson Med. 2008;60:90–101. doi: 10.1002/mrm.21514. [DOI] [PubMed] [Google Scholar]
- 70.Koch MA, Finsterbusch J. Double wave vector diffusion weighting imaging in the human corticospinal tract in vivo. Proc int soc Magn Reson Med. 2008;16:764. [Google Scholar]
- 71.Weber T, Ziener CH, Kampf T, Herold V, Bauer WR, Jakob PM. Measurement of apparent cell radii using a multiple wave vector diffusion experiment. Magn Reson Med. 2009;61:1001–1006. doi: 10.1002/mrm.21848. [DOI] [PubMed] [Google Scholar]
- 72.Finsterbusch J, Koch MA. A tensor approach to double wave vector diffusion-weighting experiments on restricted diffusion. J Magn Reson. 2008;195:23–32. doi: 10.1016/j.jmr.2008.08.003. [DOI] [PubMed] [Google Scholar]
- 73.Finsterbusch J. Extension of the double-wave-vector diffusion-weighting experiment to multiple concatenations. J Magn Reson. 2009;198:174–182. doi: 10.1016/j.jmr.2009.02.003. [DOI] [PubMed] [Google Scholar]
- 74.Koch MA, Finsterbusch J. Numerical simulation of double-wave vector experiments investigating diffusion in randomly oriented ellipsoidal pores. Magn Reson Med. 2009;62:247–254. doi: 10.1002/mrm.21976. [DOI] [PubMed] [Google Scholar]
- 75.Lawrenz M, Koch MA, Finsterbusch J. A tensor model and measures of microscopic anisotropy for double-wave-vector diffusion-weighting experiments with long mixing times. J Magn Reson. 2009 doi: 10.1016/j.jmr.2009.09.015. in-press. [DOI] [PubMed] [Google Scholar]
- 76.Özarslan E, Basser PJ. Microscopic anisotropy revealed by NMR double pulsed field gradient experiments with arbitrary timing parameters. J Chem Phys. 2008;128:154511. doi: 10.1063/1.2905765. [DOI] [PMC free article] [PubMed] [Google Scholar]
- 77.Özarslan E, Nevo U, Basser PJ. Anisotropy induced by macroscopic boundaries: Surface-normal mapping using diffusion-weighted imaging. Biophys J. 2008;94:2809–2818. doi: 10.1529/biophysj.107.124081. [DOI] [PMC free article] [PubMed] [Google Scholar]
- 78.Caprihan A, Wang LZ, Fukushima E. A multiple-narrow-pulse approximation for restricted diffusion in a time-varying field gradient. J Magn Reson A. 1996;118:94–102. [Google Scholar]
- 79.Callaghan PT. A simple matrix formalism for spin echo analysis of restricted diffusion under generalized gradient waveforms. J Magn Reson. 1997;129:74–84. doi: 10.1006/jmre.1997.1233. [DOI] [PubMed] [Google Scholar]
- 80.Shemesh N, Özarslan E, Basser PJ, Cohen Y. Measuring small compartmental dimensions with low-q angular double-PGSE NMR: The effect of experimental parameters on signal decay. J Magn Reson. 2009;198:15–23. doi: 10.1016/j.jmr.2009.01.004. [DOI] [PubMed] [Google Scholar]
- 81.Shemesh N, Özarslan E, Bar-Shir A, Basser PJ, Cohen Y. Observation of restricted diffusion in the presence of a free diffusion compartment: single- and double-PFG experiments. J Magn Reson. 2009;200:214–225. doi: 10.1016/j.jmr.2009.07.005. [DOI] [PMC free article] [PubMed] [Google Scholar]
- 82.Özarslan E, Shemesh N, Basser PJ. A general framework to quantify the effect of restricted diffusion on the NMR signal with applications to double pulsed field gradient NMR experiments. J Chem Phys. 2009;130:104702. doi: 10.1063/1.3082078. [DOI] [PMC free article] [PubMed] [Google Scholar]
- 83.Grebenkov DS. NMR survey of reflected Brownian motion. Rev Mod Phys. 2007;79:1077–1137. [Google Scholar]
- 84.Grebenkov DS. Analytical solution for restricted diffusion in circular and spherical layers under inhomogeneous magnetic fields. J Chem Phys. 2008;128:134702. doi: 10.1063/1.2841367. [DOI] [PubMed] [Google Scholar]
- 85.Robertson B. Spin-echo decay of spins diffusing in a bounded region. Physical Review. 1966;151:273–277. [Google Scholar]
- 86.Merzbacher E. Quantum Mechanics. John Wiley & Sons; New York: 1998. [Google Scholar]
- 87.Shemesh N, Cohen Y. The effect of experimental parameters on the signal decay in double-PGSE experiments: Negative diffractions and enhancement of structural information. J Magn Reson. 2008;195:153–161. doi: 10.1016/j.jmr.2008.09.006. [DOI] [PubMed] [Google Scholar]
- 88.Price WS, Stilbs P, Soderman O. Determination of pore space shape and size in porous systems using NMR diffusometry. Beyond the short gradient pulse approximation. J Magn Reson. 2003;160:139–143. doi: 10.1016/s1090-7807(02)00134-9. [DOI] [PubMed] [Google Scholar]
- 89.Shemesh N, Özarslan E, Basser PJ, Cohen Y. Detecting diffusion-diffraction patterns in size distribution phantoms using double-pulsed field gradient (d-PFG) NMR: Theory and experiments. 2009 doi: 10.1063/1.3285299. Submitted. [DOI] [PMC free article] [PubMed] [Google Scholar]
- 90.Tuch DS, Reese TG, Wiegell MR, Wedeen VJ. Diffusion MRI of complex neural architecture. Neuron. 2003;40:885–895. doi: 10.1016/s0896-6273(03)00758-x. [DOI] [PubMed] [Google Scholar]
- 91.Özarslan E, Mareci TH. Generalized diffusion tensor imaging and analytical relationships between diffusion tensor imaging and high angular resolution diffusion imaging. Magn Reson Med. 2003;50:955–965. doi: 10.1002/mrm.10596. [DOI] [PubMed] [Google Scholar]
- 92.Liu CL, Bammer R, Moseley ME. Generalized diffusion tensor imaging (GDTI): A method for characterizing and imaging diffusion anisotropy caused by non-Gaussian diffusion. Isr J Chem. 2003;43:145–154. [Google Scholar]
- 93.Alexander DC. A general framework for experiment design in diffusion MRI and its application in measuring direct tissue-microstructure features. Magn Reson Med. 2008;60:439–448. doi: 10.1002/mrm.21646. [DOI] [PubMed] [Google Scholar]
- 94.Assaf Y, Freidlin RZ, Rohde GK, Basser PJ. New modeling and experimental framework to characterize hindered and restricted water diffusion in brain white matter. Magn Reson Med. 2004;52:965–978. doi: 10.1002/mrm.20274. [DOI] [PubMed] [Google Scholar]
- 95.Assaf Y, Basser PJ. Composite hindered and restricted model of diffusion (CHARMED) MR imaging of the human brain. Neuroimage. 2005;27:48–58. doi: 10.1016/j.neuroimage.2005.03.042. [DOI] [PubMed] [Google Scholar]
- 96.Özarslan E, Shepherd TM, Vemuri BC, Blackband SJ, Mareci TH. Resolution of complex tissue microarchitecture using the diffusion orientation transform (DOT) Neuroimage. 2006;31:1086–1103. doi: 10.1016/j.neuroimage.2006.01.024. [DOI] [PubMed] [Google Scholar]
- 97.Wedeen VJ, Hagmann P, Tseng WYI, Reese TG, Weisskoff RM. Mapping complex tissue architecture with diffusion spectrum magnetic resonance imaging. Magn Reson Med. 2005;54:1377–1386. doi: 10.1002/mrm.20642. [DOI] [PubMed] [Google Scholar]
- 98.Wedeen VJ, Wang RP, Schmahmann JD, Benner T, Tseng WYI, Dai G, Pandya DN, Hagmann P, D’Arceuil H, de Crespignya AJ. Diffusion spectrum magnetic resonance imaging (DSI) tractography of crossing fibers. Neuroimage. 2008;41:1267–1277. doi: 10.1016/j.neuroimage.2008.03.036. [DOI] [PubMed] [Google Scholar]
- 99.Komlosh ME, Horkay F, Freidlin RZ, Assaf Y, Basser PJ. Detection of local anisotropuy using double-PGSE filtered imaging. 47th ENC; 2006; p. E060077. [Google Scholar]
- 100.Komlosh ME, Özarslan E, Lizak MJ, Horkay F, Basser PJ. Pore diameter measured using d-PGSE filtered MRI. 10th International conference on magnetic resonance microscopy; 2009. p. P02. [Google Scholar]