Abstract
A full-wave equation that describes nonlinear propagation in a heterogeneous attenuating medium is solved numerically with finite differences in the time domain (FDTD). This numerical method is used to simulate propagation of a diagnostic ultrasound pulse through a measured representation of the human abdomen with heterogeneities in speed of sound, attenuation, density, and nonlinearity. Conventional delay-and-sum beamforming is used to generate point spread functions (PSF) that display the effects of these heterogeneities. For the particular imaging configuration that is modeled, these PSFs reveal that the primary source of degradation in fundamental imaging is due to reverberation from near-field structures. Compared to fundamental imaging, reverberation clutter in harmonic imaging is 27.1 dB lower. Simulated tissue with uniform velocity but unchanged impedance characteristics indicates that for fundamental imaging, the primary source of degradation is phase aberration.
I. Introduction
Tissue harmonic imaging has been shown to markedly improve image quality and is used extensively in clinical ultrasound exams[1–3]. The most dramatic improvements are visible in abdominal [4], pelvic [5], and cardiac sonography [6] where improvements in lateral and axial resolution, contrast-to-noise ratio (CNR), clutter rejection, penetration depth, lesion visibility and diagnostic confidence are reported. In abdominal scanning, harmonic imaging is reported to be better than conventional ultrasound in regard to lesion visibility and diagnostic confidence [2], especially in patients with a high body mass index [4].
Although harmonic imaging is used extensively, the mechanisms for in vivo image quality improvement are still poorly understood. Three major mechanisms of image quality improvement in harmonic imaging have been proposed [1–3, 7–9]. First, it has been hypothesized that harmonic imaging can circumvent reverberation clutter as a source of image degradation because the harmonic component of the transmitted beam has a low amplitude in the near field where most reverberations occur [10]. There is, therefore, comparatively much less energy at the harmonic frequency reverberating in near-field layers that can add acoustic noise to the received signals. Second, improvements in harmonic imaging can be linked to reductions in the main lobe width and the magnitude of side lobes of the harmonic transmit beam. This is seen both experimentally and in simulations [11, 12].
Lastly, it has been suggested that harmonic imaging benefits from a decreased sensitivity to beamforming errors from variations in acoustic velocity, or phase aberration [13, 14], For example, the speed of sound is approximately 1460 m/s in fat, whereas in muscle it is upwards of 1610 m/s [15, 16]. When the acoustic velocity of tissue is inhomogeneous across the pulse wavefront, parts of it travel faster or slower and introduce aberrations in the ideally focused phase profile. An equivalent time delay in the aberration has a more significant effect on a higher frequency pulse because the phase aberration is larger. Therefore, because the transmission frequency utilized in harmonic imaging is low compared to the receive frequency, the effect of phase aberration is diminished [11]. It has been shown with theoretical, phantom, and in vivo studies that the defocusing effect of the phase aberrations increases the width of the mainlobe and raises the level of the sidelobes, which reduces the resolution and contrast [17–22].
The analysis of these mechanisms during propagation through tissue requires complex simulations or experiments that incorporate the effects of tissue heterogeneities and scattering. This has imposed significant challenges in describing and quantifying the mechanisms of image quality improvement with harmonic imaging. Bradley [10] describes a mathematical model based on nonlinear acoustic propagation in the ocean to describe clutter. This model relies on several assumptions including limiting heterogeneities to thin regions and accounting only for narrow-band signals. Wallace et al. [7] used porcine abdominal aberrators in one dimensional experimental measurements to show that the harmonic field is less aberrated than the fundamental. However, a study that used a three dimensional simulation method that approximates aberration with a series of distributed phase screens reached the conclusion that aberration affects the harmonic signal to the same degree as the fundamental [9, 23]. Another simulation study used the Khokhlov-Zabolotskaya-Kuznetsov (KZK) equation in conjunction with data from the Visible Human Project and reached similar conclusions [24]. These simulations use a one-way wave equation and thus cannot model multiple reflections and scattering.
Ultrasonic propagation through fine scale heterogeneities has been simulated previously with a finite difference time domain (FDTD) solution of the 2D and 3D linear wave equation [25, 26]. This numerical implementation models the fine structure of human tissue and the arrangement of the tissue in the human body. The full-wave equation accounts for multiple reflections and scattering, but these numerical implementations lack the ability to simulate nonlinear propagation and attenuation.
Recently, we have developed a novel numerical solution [27] to a full-wave equation that, in addition to simulating the nonlinear propagation of waves, describes arbitrary frequency dependent attenuation and variations in density. The numerical simulation generates the full pressure waveforms at every point in the simulated field and therefore allows great flexibility in calculating ultrasound pressure fields. The method is capable of modeling complex human anatomy and is capable of generating realistic fundamental and harmonic ultrasound images. Unlike other simulations that use nonlinear propagation to create ultrasound images [28], this simulation method does not require linear convolution assumptions of the point-spread-function. Thus, the simulation method can include the combination of aberration, reverberation, and scattering effects. Using this numerical method, we investigate and quantify the losses in image quality for fundamental and harmonic imaging due to various sources of image quality degradation.
II. Methods
A. Sources of Image Degradation
As an ultrasonic wave propagates through tissue, there are several potential sources of disruption that can cause image degradation. We hypothesize that these sources are
The heterogeneous composition of the medium which can distort the phase and amplitude of the wave (aberration), and
A layered, heterogeneous medium that can generate multiple reflections (reverberation).
The second effect can be broken up into two sources of image degradation: multiply-reflected sound that returns to the transducer and is overlayed on top of sound returning from deeper ranges, and multiply-reflected sound that is transmitted beyond the layered media that contributes to a low-amplitude lengthening of the transmit pulse. These effects degrade the image’s resolution and contrast.
Phase and amplitude aberration have been studied extensively [19, 29–32], but often rely on simplified models of the complex heterogeneity of human tissue, such as a near-field phase screen or single or multiple layers of phase screens at distance. The common result, however, is that the mainlobe of the ultrasonic beam is broadened, and the sidelobes are broadened and elevated with concomitant losses in image resolution and contrast.
In addition to aberration, significant reflections can occur at interfaces with large impedance mismatches, such as between fat and muscle [33]. Tissue with a layered structure, such as connective tissue, is conducive to trapping acoustic energy from the propagating ultrasonic pulse with multiple reflections. As the captured energy reverberates between layers, a portion of it is transmitted through the tissue back to the ultrasonic transducer where it overlays acoustic noise onto its received signals. If the tissue layers are normal to the direction of wave propagation, the noise is visible in the ultrasonic image as bright bands that occur at integer multiples of the spatial period, or thickness, of the tissue layers. This is commonly observed in vascular imaging where the proximal wall of the carotid artery may produce visible bands in the lumen due to multiple reflections in the arterial wall. If the layers are not normal to the direction of propagation, the resulting reverberation is a less coherent and more diffuse echo that appears as a haze overlaid on the image. This might occur, for example, in a high body-mass index patient where there are many connective tissue layer boundaries within the fat of the patient.
Reflections that are transmitted in the direction of pulse propagation instead of back towards the transducer face add a long, low-amplitude tail to the originally compact pulse. This effect, which we refer to as pulse lengthening, generates additional clutter and degrades axial resolution.
B. Simulation Model
The nonlinear full-wave equation describes acoustic fields in a nonlinear thermoviscous medium [34, 35], and can be written as
| (1) |
This equation incorporates the effects of nonlinearity, attenuation, and all wave effects, such as multiple scattering, reflection, and refraction. The first two terms in Eq. 1 represent the linear wave equation, and the following three terms represent thermoviscous diffusivity, nonlinearity, and variations in density. The remaining term represents υ relaxation mechanisms, where ξm satisfies the equation
| (2) |
In these equations, p is the acoustic pressure, c0 and ρ are the equilibrium speed of sound and density, δ is the acoustic diffusivity, α is the absorption coefficient, and the coefficient β is related to the nonlinearity parameter, B/A, by the relationship β = 1 + B/2A. The diffusivity can be expressed as a function of the absorption coefficient with the equation (where ω is the angular frequency). The material parameters c0, δ, ρ and β can be functions of space. The relaxation equation (Eq. 2) has υ peaks at characteristic frequencies ωm with weight am that depend on the particular frequency dependent attenuation law being modeled.
This equation is solved using finite differences in the time domain and solutions have been extensively verified with water tank measurements of a commercial diagnostic ultrasound transducer, comparisons with Field II [36], and solutions of Burgers’ equation. Perfectly matched layers are used at the simulation boundaries to reduce reflections by approximately 80 dB [37–39]. Full details of the numerical methods and their verification can be found in Pinton et al. [27, 40].
C. Simulations
To characterize the sources of image degradation, the numerical method described in section II-B is used to simulate the propagation of ultrasonic pulses from a diagnostic ultrasound transducer through a histologically measured representation of the human abdomen [25]. The simulation method models wave propagation from a transducer that is similar to those used in abdominal diagnostic ultrasound. The array has a center frequency of 2.1MHz, a 60% bandwidth, and is focused laterally as an F/1.5 system with a 5 cm focus. The transducer was modeled as a linear transducer rather than the typical curved linear array in order to simplify beamforming and simulation aspects, however it is possible to model curved linear arrays using this numerical method.
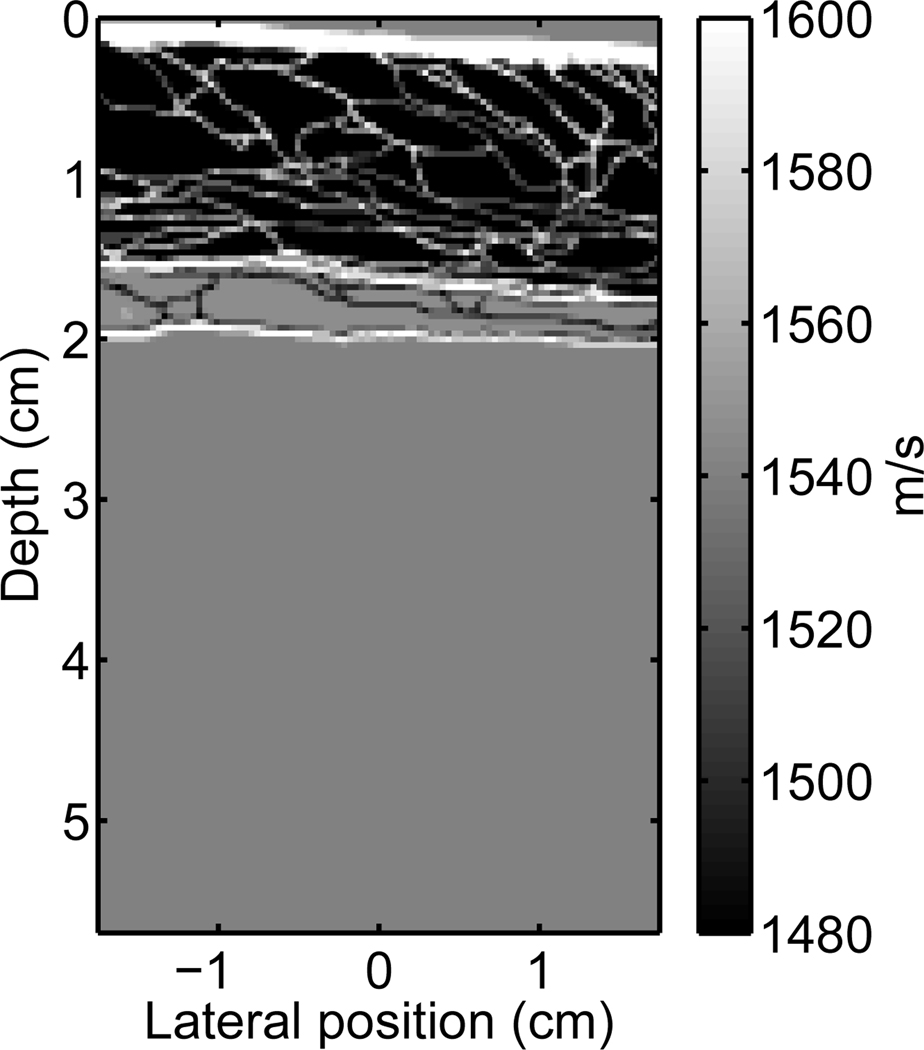
A two dimensional heterogeneous tissue model, supplied by the Diagnostic Ultrasound Research Laboratory at the University of Rochester, was used as a model of a human abdominal layer. The tissue model was obtained from a stained, histological sample of human abdominal wall [25, 41, 42] and the structures in the sample were assigned one of three tissue types: fat, muscle, or connective tissue (also incorporates skin). Each tissue type was given the acoustic properties appropriate for that tissue, including speed of sound, density, nonlinearity, and attenuation. The acoustic properties are derived from data assembled by Goss et al. [15, 16], and are shown in Table I. This abdominal section is in an uncompressed state, which may differ from a clinical setting where the ultrasonographer applies pressure to the probe to adjust the image quality. An image of this abdominal layer is shown in Fig. 1 with the color scale depicting the speed of sound of the tissues.
TABLE I.
Acoustic parameters utilized in the tissue models.
| Tissue | B/A | α (dB/MHz/cm) | c0(m/s) | ρ0 (g/cm3) |
|---|---|---|---|---|
| Homogeneous | 9 | 0.50 | 1540 | 1.000 |
| Fat | 9.6 | 0.40 | 1479 | 0.937 |
| Muscle | 8.0 | 0.15 | 1550 | 1.070 |
| Connective | 8.0 | 0.68 | 1613 | 1.120 |
| Liver | 7.6 | 0.50 | 1570 | 1.064 |
Fig. 1.
A graphical representation of the variation in the speed of sound for a portion of one of the abdominal layers provided by the Diagnostic Ultrasound Research Laboratory [25, 41, 42] (not shown are spatial variations in attenuation, nonlinearity, and density).
The imaging medium is described with a spatial resolution of 12.5 µm. To simulate a scattering ultrasonic medium, the medium is populated with point scatterers with a density of twelve scatterers per resolution cell. The point scatterers have a 40 µm diameter with random spatial position and uniform random amplitude (defined by its difference in speed of sound from the surrounding medium). The mean variation in the speed of sound of the scatterers is 77m/s, which corresponds to a 5% variation of the accepted average tissue velocity of 1540m/s.
To compose fundamental and harmonic images, multiple simulations are employed across the medium (one simulation per A-line), much like a diagnostic scanner operating in a linear imaging mode. The relevant information from the simulations is in the echos returned to the transducer, and because the simulation method generates the full pressure field at all times, the pressure field must be sampled at the location of the transducer. The sampling rate used in the simulations was 41.7MHz to emulate the sampling sampling rates used in A/D conversion in conventional diagnostic scanners. The output of the sampling process is equivalent to the signals received by each element of a diagnostic ultrasound transducer. The sampled signals are beamformed using conventional delay-and-sum beamforming with dynamic receive focusing and with a precision limited only by the sampling rate, to produce a fundamental B-mode image. Harmonic images are generated by filtering the radio-frequency (rf) signals of the fundamental image with a bandpass filter centered about the second harmonic frequency and having 100% bandwidth relative to the fundamental frequency.
Images of an anechoic lesions in liver tissue are created using circular (or cylindrical), homogeneous tissue regions with no scatterers. The anechoic lesion is surrounded by tissue containing the acoustical properties of liver (Table I) and sub-resolution point scatterers. PSFs are created by placing 40 µm point targets at the transmit focal depth in a homogeneous medium with a speed of sound of 1540m/s and no scatterers. The point target is given a 25% difference in speed of sound from the surrounding homogeneous tissue in order to generate appreciable reflection. A full, 2D scan of the imaging medium is then used to generate the image or PSF.
The transmitted pulses used in these simulations have the form
| (3) |
where p0 is the pressure amplitude, dx is the lateral focus, dy is the elevation focus and f is the impulse function:
| (4) |
Here the number of cycles, n, was set to 1.667 to approximate the 60% fractional bandwidth. The exponential decay constant, m, was set to 2.
D. Isoimpedance and Isovelocity Simulations
To observe the impact of the individual components of image degradation, the abdominal layer can be modified such that one of the degradation components can be eliminated from the simulation. If the abdominal layer is modified such that the impedance mismatch between layers is reduced to zero, but the speed of sound of the tissues remains equal to their original values, then reverberation is removed from the simulation while keeping phase aberration intact. This modification was accomplished by adjusting the tissue densities to maintain the original characteristic impedance values. This simulation is therefore characterized as the isoimpedance simulation.
In the numerical implementation of the simulation method, each term of Eq. 1 is calculated independently. Reflections occur from an impedance mismatch, which depends on the second and fourth terms of Eq. 1. Even though the product of the speed of sound and the density can be set to a constant, the gradient applied to the density is non-zero, producing small reverberations. Therefore, a true isoimpedance propagation cannot be performed directly. An isoimpedance image can be approximated, however, by simulating the abdominal wall only and subtracting the resulting reverberations from the original image.
Alternatively, if the speed of sound is set constant throughout the abdominal layer and the characteristic impedances are adjusted to their original values, then phase aberration can be removed from the simulation while keeping the reverberation intact. This simulation is referred to as the isovelocity simulation. Like the isoimpedance simulation, changes in density are required to compensate the changes in speed of sound, however, this type of simulation can be performed directly.
III. Results
A. Backscatter
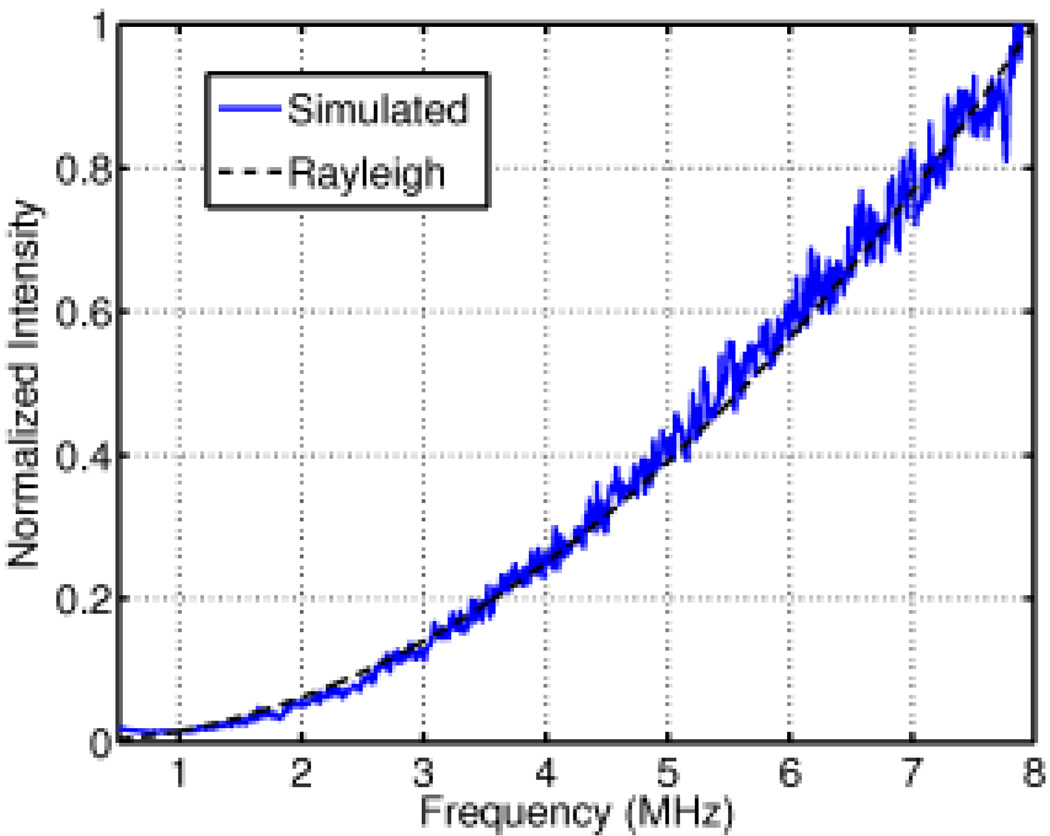
To validate the scattering characteristics of this simulation method against Rayleigh scattering theory, an ultrasonic pulse was transmitted through a field of homogeneous tissue containing randomly distributed, random-amplitude scatterers as described in section II-C. Fig. 2 shows the normalized simulated intensity as a function of frequency from the received backscattered signal. The intensity has an f4 dependence on frequency, as expected in the 1–8 MHz frequency range for scatterers of the size modeled [43].
Fig. 2.
A comparison of the theoretical and simulated power spectrum of the backscatter from a field of randomly distributed scatterers in the Rayleigh regime.
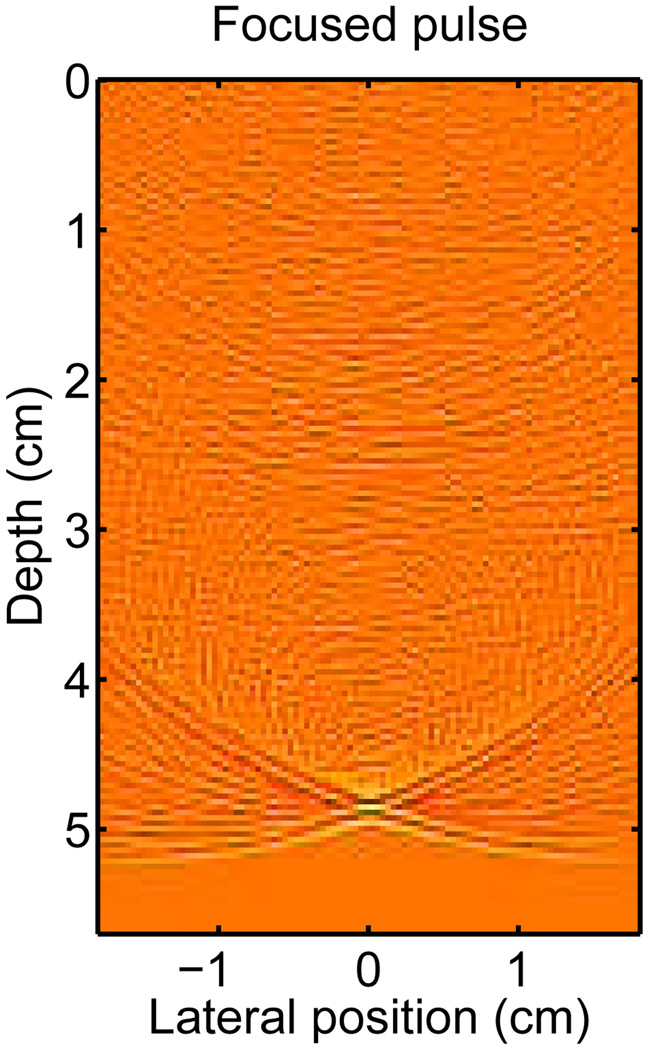
The simulated pressure field from the homogeneous scattering medium at time t =32.5 µs, (when the pulse has reached the focus at 5 cm) is shown in Fig. 3. The pressure field is shown on a log-compressed scale to illustrate the small amplitude scattering. The PSF of the system is visible at the focal point of the system where the propagating pulse has converged to a point. The PSF is described by the “X” shaped region with the mainlobe located at the center of the “X.” The tails of the “X” are particularly visible in this case because the transducer is unapodized and the dynamic range has been compressed. Often, the conventional description of an ultrasound system’s PSF is defined over a small lateral range centered about the mainlobe. In the PSFs described in the following section, the PSF is described over a broad lateral region to illustrate the effects of reverberation and phase aberration on the PSF. In this description of the PSF, the isochronous volume is the area bounded by the “X” shape to the left and right of the propagating pulse. Physically, the isochronous area represents the area of the PSF that has the same arrival time (within a certain delta).
Fig. 3.
The acoustic field of a propagating diagnostic pulse at the focus depth (echo dynamic range is compressed by fractional exponentiation to emphasize small amplitudes).
B. Point spread functions
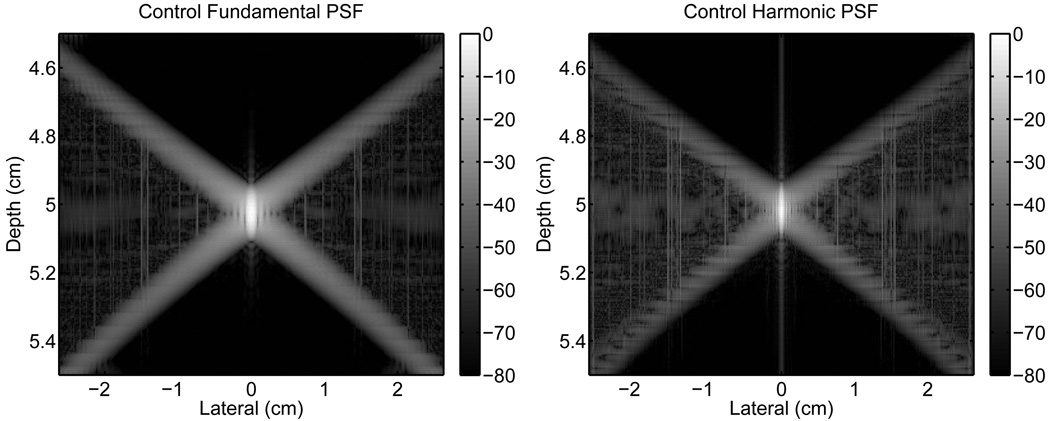
The PSF from a homogeneous tissue region containing no scatterers was simulated as a control using the method described in section II-C. The fundamental and harmonic images of the magnitude of the PSF are shown in Fig. 4. The images of the PSFs have three distinct regions of interest that are defined by the “X”-shape of the PSF: the lateral regions within the isochronous area to the left and right of the “X”; the region above, that precedes the pulse temporally; and the region below, that trails it. Note that the scales for the x- and y-axes are not geometrically proportional.
Fig. 4.
Control PSFs from an unapodized transducer in a homogeneous medium. The fundamental (left) and harmonic (right) PSFs are shown normalized relative to their peak. Note that the scales for the x- and y-axes are not geometrically proportional. The scale to the right of each image has units of decibels.
For the control PSFs, the regions preceding and trailing the isochronous area do not show any significant response. As expected, there is a low level contribution of signal within the isochronous area except at the location of the mainlobe. The mainlobe of the harmonic PSF is also visibly narrower than the fundamental. Note that the vertical lines at the centers of the PSFs and in the isochronous areas are numerical artifacts which are exacerbated by the bandpass filter. The average magnitude, relative to the mainlobe, of the three regions for the fundamental and harmonic cases are listed in Table II.
TABLE II.
Mean magnitude (dB) for the three regions of the PSFs
| Isochronous | Preceding | Trailing | ||||
|---|---|---|---|---|---|---|
| Fundamental | Harmonic | Fundamental | Harmonic | Fundamental | Harmonic | |
| Homogeneous | −59.8 | −58.6 | −98.1 | −93.8 | −86.7 | −83.9 |
| Abdominal Layer | −42.8 | −46.9 | −41.1 | −68.2 | −46.8 | −56.0 |
| Isoimpedance | −48.6 | −47.8 | −92.6 | −84.6 | −55.2 | −56.1 |
| Isovelocity | −46.6 | −57.7 | −42.5 | −71.2 | −49.9 | −63.0 |
Any degradation of the PSF from phase aberration occurs in the isochronous area, which is the spatial region from which an acoustic signal can be received if the beamformer is temporally gated to a Dirac delta function. Degradation from reverberation clutter, in contrast, occurs both within and outside the isochronous area. Pulse lengthening can be observed primarily in the region trailing the isochronous area and, to a lesser extent, within the isochronous area. To illustrate the effects of reverberation clutter, pulse lengthening, and phase aberration, the PSF of the imaging system was simulated under various conditions.
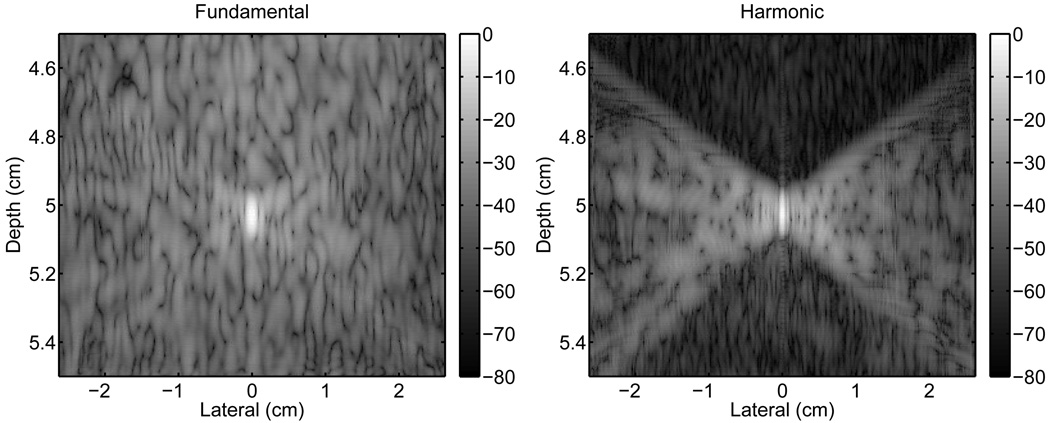
Fig. 5 displays the changes to the fundamental and harmonic PSFs with the addition of the abdominal layer. This simulation includes the major effects that degrade the PSFs including aberration, reverberation, and pulse lengthening. These PSFs appear to have a speckle-like pattern overlayed on the PSFs. The spatial frequencies of the speckle pattern are lower for the fundamental PSF than for the harmonic.
Fig. 5.
The fundamental (left) and harmonic (right) PSFs showing clutter resulting from the propagation of an ultrasonic pulse through an abdominal wall. The harmonic PSF shows a significant reduction in clutter preceding the ultrasonic pulse, which is associated with reverberation clutter. There is a smaller reduction in clutter in the trailing region, which is associated with pulse lengthening.
Relative to the control, the fundamental PSF with the abdominal layer suffers a substantial amount of degradation in all three regions. The harmonic PSF is degraded primarily in the isochronous area and, to a lesser extent, in the trailing region. The preceding region of the harmonic PSF also shows degradation, however to a significantly reduced degree than the fundamental PSF.
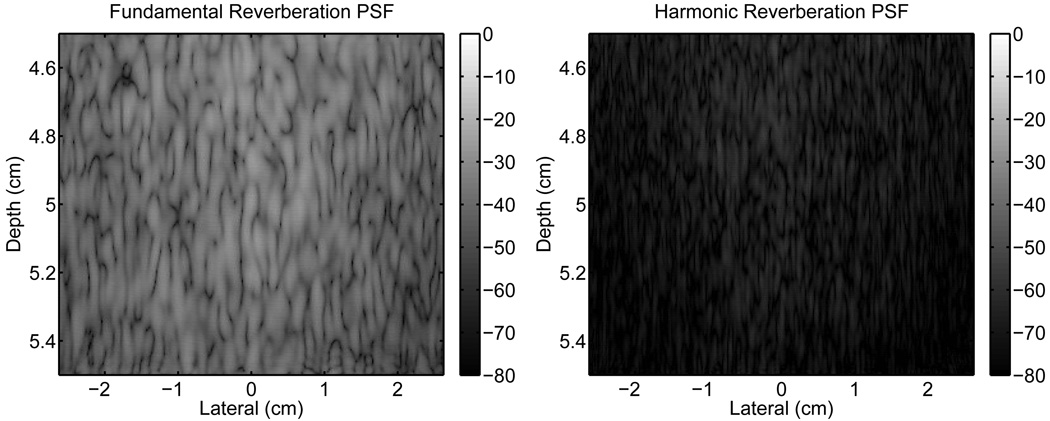
An isoimpedance simulation was performed to determine the response of the system to phase aberration image degradation. This response of the system to the abdominal layer is shown in Fig. 6. These images represent the contribution to the PSFs from reverberation clutter alone, because only the multiple-reflected waves from the abdominal layer are received by the transducer.
Fig. 6.
Images of the reverberation clutter from propagation through a representation of the abdominal wall. The fundamental (left) and harmonic (right) images are shown without any signal from a point target.
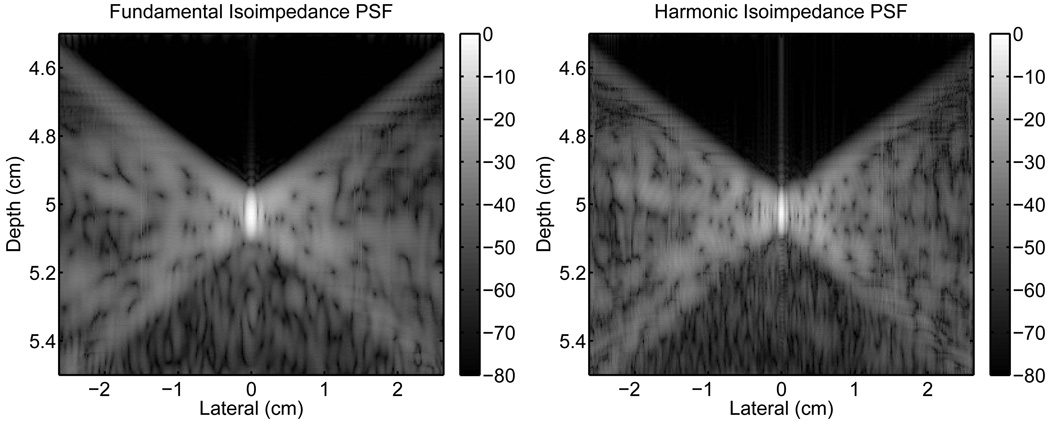
The reverberation clutter in Fig. 6 was then linearly subtracted from the PSFs in Fig. 5 to obtain the isoimpedance PSFs in Fig. 7. These PSFs still include the effects of pulse lengthening in addition to aberration, however the effect of removing reverberation clutter is apparent. There is significant improvement in preceding region of the fundamental PSF because this area is only associated with reverberation clutter. Thus, the average value of the signal in this area is similar to the control PSF. There is also a substantial reduction in the trailing region and a small improvement in the isochronous area due to reverberation clutter being present in these regions as well. The reductions in clutter in the isochronous, preceding, and trailing areas are 5.8 dB, 51.5 dB, and 8.4 dB, respectively.
Fig. 7.
Isoimpedance point-spread-functions, obtained by subtracting the reverberation clutter from the PSFs in Fig. 5.
In the harmonic PSF of Fig. 7, the clutter in the preceding region is also removed, but because the original PSF (Fig. 5) does not have a significant amount of clutter, the improvement is comparatively smaller. In the isochronous, preceding, and trailing regions, the improvements are 0.9 dB, 16.4 dB, and 0.1 dB, respectively, which are substantially less than the equivalent fundamental values.
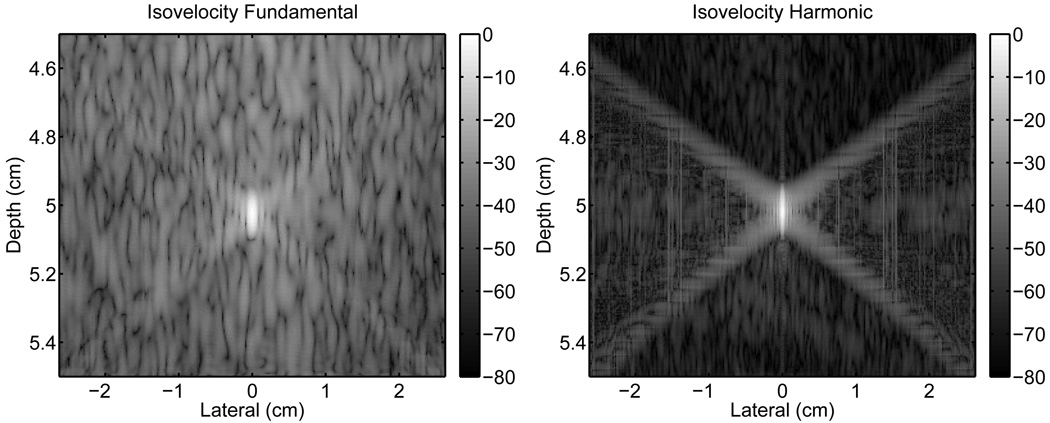
An isovelocity simulation was performed to by setting the speed of sound in the abdominal layer to a uniform value corresponding to the mean (1537m/s). The resulting isovelocity PSFs are shown in Fig. 8. When compared to the PSFs in Fig. 5, the fundamental isovelocity PSF does not appear largely different from the PSF in Fig. 5, however the harmonic isovelocity PSF has significantly less clutter within the isochronous area than its counterpart in Fig. 5. The isochronous area of the harmonic PSF is more similar to that shown for the control PSF in Fig. 4. The fundamental isovelocity PSF exhibits an improvement of 3.8 dB, 1.4 dB, and 3.1 dB in the isochronous, preceding, and trailing regions, respectively over the fundamental PSF in Fig. 5. The improvement over Fig. 5 in the harmonic PSF is 10.8 dB, 3.0 dB, and 7.0 dB in the identical regions, respectively. Table II summarizes the average magnitude (dB) of the three regions of the PSFs for all the simulations.
Fig. 8.
Point-spread-functions without aberration obtained by propagating the ultrasonic pulse through a medium with no variations in the speed of sound but with an unchanged impedance compared to the abdominal layer.
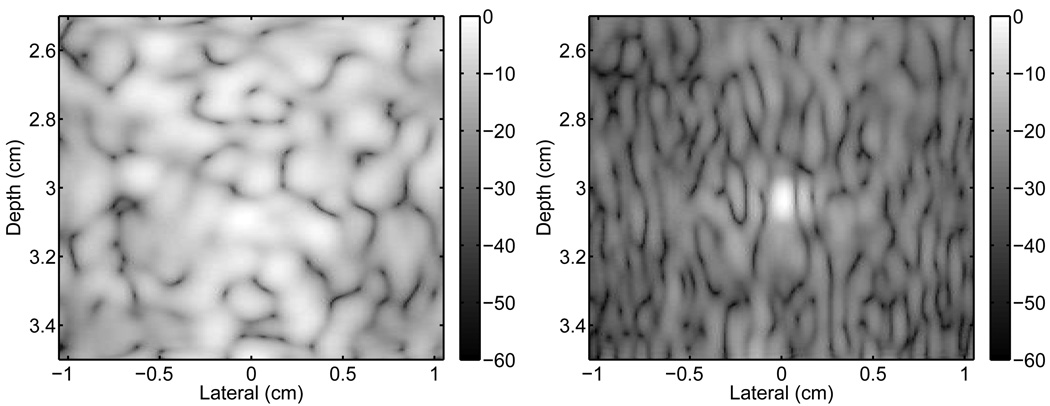
The resulting PSFs for the same imaging system (transmit focus at 5 cm) but the point positioned at 3 cm depth are shown in Fig. 9. The fundamental PSF (left) does not have a discernible peak, whereas the harmonic PSF (right) has a visible peak. Both PSFs show significantly worse clutter than the PSFs with the point located at the transmit focus (shown in Fig. 5) due to the proximity of the point target to the abdominal layer.
Fig. 9.
Fundamental (left) and harmonic (right) point-spread-functions for a transmit focus at 5 cm and a receive focus at 3 cm after propagation through a representation of the abdomen. The PSFs show increased reverberation clutter due to the proximity of the target to the abdominal layer.
C. Ultrasonic Imaging
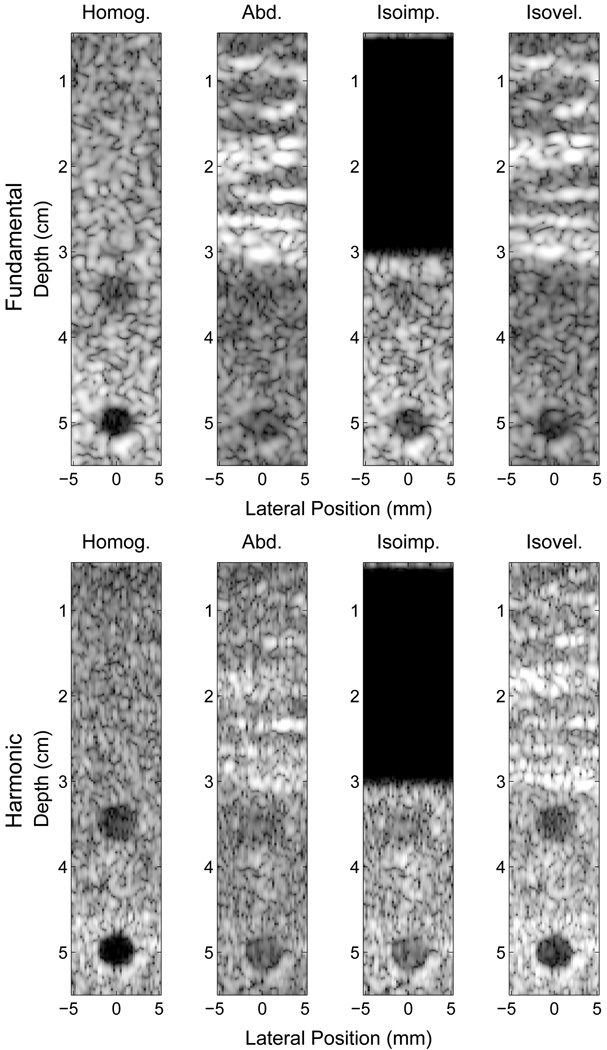
Fig. 10 displays ultrasonic images generated by the full-wave simulation method. In these images, two 5 mm diameter anechoic lesions were centered at 3.5 and 5 cm depth. A 100% bandwidth bandpass filter was used to obtain the fundamental and harmonic components from the raw beamformed data. Images were created with and without the abdominal layer, and include isoimpedance and isovelocity simulations.
Fig. 10.
Simulated fundamental (top) and harmonic (bottom) ultrasound images of 5 mm anechoic lesions at 3 and 5 cm using delay-and-sum beamforming and a transmit focus at 5 cm. Images are shown for a homogeneous medium (left), an abdominal layer (middle-left), an isoimpedance material (middle-right), and an isovelocity material (right). Images are shown with 50 dB of dynamic range.
The left-most images in Fig. 10 were formed with homogeneous tissue surrounding the lesions and no abdominal layer. As shown in Table III, the CNR of the anechoic lesion in the fundamental and harmonic images are good, although better in the harmonic images, particularly at the focal depth. The middle-left images in Fig. 10 show the same homogeneous tissue with the addition of an abdominal layer. Consistent with the PSFs in Figs. 4 and 5, the CNR of the lesions are significantly worse than the respective homogeneous cases. When the effects of phase aberration are removed but reverberation is preserved, the CNR is nearly unchanged for the harmonic image but improves considerably for the fundamental case. When the phase aberration is removed, but the reverberation is preserved, the CNR improves significantly in the harmonic image, but remains nearly the same in the fundamental image. The CNR values for the fundamental and harmonic lesions are consistent with the observations of the corresponding PSFs from section III-B.
TABLE III.
CNR of the anechoic lesions
| Depth (cm) |
Simulation | Fundamental CNR |
Harmonic CNR |
|---|---|---|---|
| 3.5 | Homogeneous | 1.25 | 1.64 |
| Abdominal Layer | 0.48 | 0.54 | |
| Isoimpedance | 0.87 | 0.57 | |
| Isovelocity | 0.52 | 1.63 | |
| 5 | Homogeneous | 1.86 | 2.07 |
| Abdominal Layer | 1.45 | 1.39 | |
| Isoimpedance | 1.72 | 1.35 | |
| Isovelocity | 1.48 | 2.08 | |
The variation in the CNR was investigated by simulating 5mm-diameter circular lesions at depths of 3.5 and 5 cm with six different abdominal layers sampled from five cadavers. The thickness of the abdominal layers varied from 2 to 3.2 cm. Each layer was given a different set of underlying scatterers. Table IV summarizes the CNRs for the lesions in the four simulations.
TABLE IV.
Mean and standard deviation of CNRs from the six abdominal layers
| Depth (cm) |
Simulation | Fundamental CNR |
Harmonic CNR |
|---|---|---|---|
| 3.5 | Homogeneous | 1.45 ± 0.22 | 1.62 ± 0.20 |
| Abdominal Layer | 0.43 ± 0.29 | 0.92 ± 0.24 | |
| Isoimpedance | 0.93 ± 0.19 | 0.95 ± 0.24 | |
| Isovelocity | 0.71 ± 0.38 | 1.44 ± 0.14 | |
| 5 | Homogeneous | 1.80 ± 0.15 | 1.99 ± 0.18 |
| Abdominal Layer | 1.45 ± 0.29 | 1.51 ± 0.31 | |
| Isoimpedance | 1.57 ± 0.22 | 1.51 ± 0.30 | |
| Isovelocity | 1.61 ± 0.28 | 1.96 ± 0.19 | |
IV. Discussion
The PSFs were obtained by beamforming the return echo from a point scatterer at the focus that has an arbitrarily assigned brightness. With a brighter target, the mainlobe and tails of the PSF would have higher levels compared to the reverberation clutter in the previous PSFs. Therefore, absolute comparisons can be made between fundamental and harmonic PSFs or between the isochronous area and the trailing region with confidence, but absolute comparisons with the reverberation clutter should be avoided.
A. Sources of PSF degradation
As mentioned previously, there are three distinct sources of PSF degradation explored in this paper, two of which affect the ultrasonic pulse, and one which degrades the signal received by the transducer. First, as a pulse propagates through tissue its wavefront distorts from a focused profile. Second, the pulse is lengthened in the direction of propagation by multiple reflections. The effects of phase aberration are visible within the isochronous area and the effects of pulse lengthening can be observed in the isochronous area and the trailing region of the PSF. Third, multiple reflections and reverberation of sound within the tissue layers that are sent back to the transducer create a background of acoustic clutter that uniformly degrade the PSF in all three regions.
It is clear from Table III and the abdominal images in Fig. 10 that the lesions in the harmonic image have better boundary definition and better CNR. The images of the PSFs at the focus (Fig. 5) and Table II support the improved CNR in that the harmonic PSF is less sensitive to clutter in the preceding and trailing regions compared to the fundamental PSF, where the improvements are 27.1 dB and 9.2 dB, respectively. This indicates that there is significantly more energy being reflected from near-field structures at the fundamental frequency than at the harmonic frequency. For short propagation distances, the energy in the pulse is primarily located at the fundamental frequency. As the pulse travels through the tissue, there is an accumulation of harmonic energy from both the propagation distance and the increase in pressure from focusing. By the time a significant amount of harmonic signal has developed, the pulse has already propagated through the near-field abdominal layer. It is thus less susceptible to reverberation clutter from near-field structures because there is little energy at the harmonic frequency. Given the characteristics of validated tissue models employed, these results indicate that reverberation clutter is a significant source of image degradation in fundamental imaging, in addition to phase aberration.
B. Impact of Reverberation
To observe the impact of reverberation clutter on images, isoimpedance PSFs were created to remove reverberation clutter from the PSFs. Like the original PSFs, the fundamental and harmonic isoimpedance PSFs have very similar characteristics in the three regions of interest. According to Table II, the average magnitudes in the isochronous areas are within 0.8 dB of each other, the average magnitudes in the trailing regions are within 0.9 dB, and in the preceding regions, although there is an 8 dB difference, they are both below −80 dB. Compared to the PSFs with the abdominal layer, or the PSF with all clutter and clutter generating mechanisms present, the fundamental PSF shows greater improvement in the three regions whereas the harmonic PSF shows some improvement in the preceding region but virtually no improvement in the other two regions. Similar effects are observed in the CNRs in Table IV, which showed that, on average, little to moderate improvement occurs in the isoimpedance fundamental image and no improvement in the isoimpedance harmonic image. These results support the hypothesis that harmonic images are only weakly affected by reverberation clutter. However, these results also indicate that the major image degradation source for harmonic imaging is phase aberration. The fundamental image shows moderate improvement when reverberation is removed indicating that image degradation is due to both reverberation clutter and phase aberration.
C. Impact of Phase Aberration
The comparative importance of phase aberration was determined by simulating pulse propagation through an equivalent tissue model with uniform speed of sound but unchanged impedance characteristics. The resultant isochronous region of the isovelocity harmonic PSF (Fig. 8) appears to be very similar to the isochronous region in the homogeneous harmonic PSF. The average magnitudes within the isochronous regions of the two PSFs are within 0.9 dB, indicating that phase aberration is the primary source of degradation within the isochronous area for the harmonic PSF. In the fundamental PSF, there is a substantial amount of energy from the reverberation clutter observable in all three regions. Compared to the respective abdominal PSF, removing phase aberration improves the isochronous area of the fundamental PSF by 3.8 dB and the isochronous area of the harmonic PSF by 10.8 dB. The harmonic PSF therefore demonstrates more susceptibility to phase aberration than the fundamental because of the larger impact on the isochronous area when phase aberration is removed. This is consistent with higher frequencies incurring comparatively larger aberration.
The PSF measurements are consistent with the CNR measurements of the lesions in that near-complete restoration of the original CNR is obtained in the harmonic isovelocity images. Because harmonic imaging effectively removes reverberation clutter and the isovelocity simulation removed clutter resulting from phase aberration, the image of the lesion is nearly equivalent to the homogeneous case. In the fundamental case, the reverberation clutter still remains in the image, and therefore only a partial improvement in CNR is obtained. The differences in CNR improvement observed in the isoimpedance and isovelocity simulations of the fundamental images ultimately depend on the amount of reverberation clutter and phase aberration induced by the abdominal layer.
An interesting result from setting the speed of sound in the abdominal layer to a constant 1540 m/s is that the isovelocity case essentially becomes a system with perfect phase correction. This means that the fundamental isovelocity images of the lesions represent the best possible image that could be obtained with phase correction techniques when overlying tissues are present. Because of the overlying reverberation clutter in the fundamental image, perfect reconstruction of lesions is not possible. These results may help explain why phase aberration correction systems obtain small to moderate improvements in image quality with in vivo human images compared to the large improvements obtained in tissue-mimicking phantom experiments [44, 45].
V. Summary and Conclusions
A numerical method that solves the nonlinear attenuating wave equation in heterogeneous media was used to determine the primary sources of clutter in fundamental and harmonic imaging. The simulation of a 2.1 MHz diagnostic transducer through a realistic model of human abdominal layers were used to generate PSFs and realistic ultrasound images. For this particular imaging system, there are two main conclusions that can be drawn from the presented data. First, the sources of image degradation in the fundamental images are primarily due to phase aberration and reverberation in near-field abdominal structures. The contribution of these two components depend on the abdominal layer. Second, phase aberration is the largest source of clutter in harmonic images, as measurements of reverberation clutter in the PSFs indicate that reverberation clutter is negligible in harmonic images. When phase aberration is removed using an isovelocity simulation, harmonic images exhibit similar characteristics as their homogeneous counterparts.
Acknowledgments
We would like to thank Joshua Baker-LePain for technical support with the computer cluster and the Diagnostic Ultrasound Research Laboratory at the University of Rochester for providing the histological data for the human abdominal wall. This work was supported by NIH grant R21-EB008481.
Contributor Information
Gianmarco F. Pinton, Institut Langevin, ESPCI ParisTech, CNRS UMR 7587, INSERM U979, Paris, France
Gregg E. Trahey, Duke University Medical Center, Department of Radiology, Durham, NC.
Jeremy J. Dahl, Email: jeremy.dahl@duke.edu, Duke University, Department of Biomedical Engineering, Durham, NC.
References
- 1.Tranquart F, Grenier N, Eder V, Pourcelot L. Clinical use of ultrasound tissue harmonic imaging. Ultrasound in Medicine and Biology. 1999 Jul;25(no. 6):889–894. doi: 10.1016/s0301-5629(99)00060-5. [DOI] [PubMed] [Google Scholar]
- 2.Thomas JD, Rubin DN. Tissue harmonic imaging: Why does it work? Journal of the American Society of Echocardiography. 1998 Aug;11(no. 8):803–808. doi: 10.1016/s0894-7317(98)70055-0. [DOI] [PubMed] [Google Scholar]
- 3.Humphrey VF. Nonlinear propagation in ultrasonic fields: Measurements, modelling, and harmonic imaging. Ultrasonics. 2000;38:267–272. doi: 10.1016/s0041-624x(99)00122-5. [DOI] [PubMed] [Google Scholar]
- 4.Choudhry S, Gorman B, Charboneau JW, Tradup DJ, Beck RJ, Kofler JM, Groth DS. Comparison of tissue harmonic imaging with conventional US in abdominal disease. RadioGraphics. 2000;20:1127–1135. doi: 10.1148/radiographics.20.4.g00jl371127. [DOI] [PubMed] [Google Scholar]
- 5.Desser TS, Jeffrey RB, Lane MJ, Ralls PW. Pictorial essay: Tissue harmonic imaging: Utility in abdominal and pelvic sonography. Journal of Clinical Ultrasound. 1999 Mar-Apr;27(no. 3):135–142. doi: 10.1002/(sici)1097-0096(199903/04)27:3<135::aid-jcu6>3.0.co;2-p. [DOI] [PubMed] [Google Scholar]
- 6.Kornbluth M, Liang DH, Paloma A, Schnittger I. Native tissue harmonic imaging improves endocardial border definition and visualization of cardiac structures. Journal of the American Society of Echocardiography. 1998 Jul;11:693–701. doi: 10.1053/je.1998.v11.a90474. [DOI] [PubMed] [Google Scholar]
- 7.Wallace KD, Robinson BS, Holland MR, Rielly MR, Miller JG. Experimental comparisons of the impact of abdominal wall aberrators on linear and nonlinear beam patterns. 2004 IEEE Ultrasonics Symposium. 2004 Aug;2:866–869. [Google Scholar]
- 8.Spencer KT, Bednarz J, Rafter PG, Korcarz C, Lang RM. Use of harmonic imaging without echocardiographic contrast to improve two-dimensional image quality. Am J Cardiol. 1998 Sep;82(no. 6):794–799. doi: 10.1016/s0002-9149(98)00457-3. [DOI] [PubMed] [Google Scholar]
- 9.Varslot T, Masoy S-E, Angelsen TFJB. Aberration in nonlinear acoustic wave propagation. IEEE Transactions on Ultrasonics Ferroelectrics and Frequency Control. 2007 Mar;54(no. 3):470–479. doi: 10.1109/tuffc.2007.271. [DOI] [PubMed] [Google Scholar]
- 10.Bradley C. Mechanisms of image quality improvement in tissue harmonic imaging; Innovations in Nonlinear Acoustics, 17th International Symposium on Nonlinear Acoustics; 2006. pp. 247–254. [Google Scholar]
- 11.Christopher T. Finite amplitude distortion-based inhomogeneous pulse echo ultrasonic imaging. IEEE Transactions on Ultrasonics Ferroelectrics and Frequency Control. 1997;44(no. 1):125–139. doi: 10.1109/58.585208. [DOI] [PubMed] [Google Scholar]
- 12.Christopher T. Experimental investigation of finite amplitude distortion-based, second harmonic pulse echo ultrasonic imaging. IEEE Transactions on Ultrasonics Ferroelectrics and Frequency Control. 1998;45(no. 1):158–162. doi: 10.1109/58.646920. [DOI] [PubMed] [Google Scholar]
- 13.Averkiou MA. Tissue harmonic imaging; IEEE Ultrasonics Symposium; 2000. pp. 1563–1572. [Google Scholar]
- 14.Duck F. Nonlinear acoustics in diagnostic ultrasound. Ultrasound in Medicine and Biology. 2002 Jan;28(no. 1):1–18. doi: 10.1016/s0301-5629(01)00463-x. [DOI] [PubMed] [Google Scholar]
- 15.Goss SA, Johnston RL, Dunn F. Compilation of empirical ultrasonic properties of mammalian tissues. J. Acoust. Soc. Am. 1978;64(no. 2):423–457. doi: 10.1121/1.382016. [DOI] [PubMed] [Google Scholar]
- 16.Goss SA, Johnston RL, Dunn F. Compilation of empirical ultrasonic properties of mammalian tissues, II. J. Acoust. Soc. Am. 1980;68(no. 1):93–108. doi: 10.1121/1.384509. [DOI] [PubMed] [Google Scholar]
- 17.O’Donnell M. Quantitative ultrasonic backscatter measurements in the presence of phase distortion. J. Acoust. Soc. Am. 1982;72(no. 6):1719–1725. [Google Scholar]
- 18.Hassler D, Härer W, Temme G, Schmidt E, Wegener P, Krämmer P. Degradation of image quality by sound velocity fluctuations and its dependence on the aperture size. Proceedings IEEE Ultrasonics Symposium. 1987;2:935–938. [Google Scholar]
- 19.Trahey GE, Freiburger PD, Nock LF, Sullivan DC. In Vivo measurements of ultrasonic beam distortion in the breast. Ultrason. Imaging. 1991;13(no. 1):71–90. doi: 10.1177/016173469101300104. [DOI] [PubMed] [Google Scholar]
- 20.Durgin HW, Freiburger PD, Sullivan DC, Trahey GE. Large aperture phase error measurement and effects. Proceedings IEEE Ultrasonics Symposium. 1992;1:623–627. [Google Scholar]
- 21.Turnbull DH, Foster FS. Simulation of b-scan images from two-dimensional transducer arrays: Part II - comparisons between linear and two-dimensional phased arrays. Ultrason. Imaging. 1992;14(no. 4):344–353. doi: 10.1177/016173469201400402. [DOI] [PubMed] [Google Scholar]
- 22.Zhu Q, Steinberg BD. Large-transducer measurements of wavefront distortion in the female breast. Ultrason. Imaging. 1992;14(no. 3):276–299. doi: 10.1177/016173469201400304. [DOI] [PubMed] [Google Scholar]
- 23.Varslot T, Taraldsen G. Computer simulation of forward wave propagation in soft tissue. IEEE Transactions on Ultrasonics Ferroelectrics and Frequency Control. 2005 Sep;52(no. 9):1473–1482. doi: 10.1109/tuffc.2005.1516019. [DOI] [PubMed] [Google Scholar]
- 24.Cleveland R, Jing Y. Comparison of mechanisms involved in image enhancement of tissue harmonic imaging; Innovations in Nonlinear Acoustics, 17th International Symposium on Nonlinear Acoustics; 2006. pp. 263–266. [Google Scholar]
- 25.Mast TD, Hinkelman LM, Orr MJ, Sparrow VW, Waag RC. Simulation of ultrasonic pulse propagation through the abdominal wall. Journal of the Acoustical Society of America. 1997 Aug;102(no. 2):1177–1190. doi: 10.1121/1.421015. [DOI] [PubMed] [Google Scholar]
- 26.Mast TD. Two- and three-dimensional simulations of ultrasonic propagation through human breast tissue. Acoustics Research Letters Online. 2002;3(no. 2):53–58. [Google Scholar]
- 27.Pinton G, Dahl J, Rosenzweig S, Trahey G. A heterogeneous nonlinear attenuating full-wave model of ultrasound. IEEE Trans. Ultrason., Ferroelec., Freq. Contr. 2009;56(no. 3):474–488. doi: 10.1109/TUFFC.2009.1066. [DOI] [PMC free article] [PubMed] [Google Scholar]
- 28.Li YD, Zagzebski JA. Computer model for harmonic ultrasound imaging. IEEE Transactions on Ultrasonics Ferroelectrics and Frequency Control. 2000 Sep;47(no. 5):1259–1272. doi: 10.1109/58.869075. [DOI] [PubMed] [Google Scholar]
- 29.O’Donnell M, Flax SW. Phase aberration measurements in medical ultrasound: Human studies. Ultrason. Imaging. 1988;10(no. 1):1–11. doi: 10.1177/016173468801000101. [DOI] [PubMed] [Google Scholar]
- 30.Freiburger PD, Sullivan DC, LeBlanc BH, Smith SW, Trahey GE. Two dimensional ultrasonic beam distortion in the breast: In Vivo measurements and effects. Ultrason. Imaging. 1992;14(no. 4):398–414. doi: 10.1177/016173469201400406. [DOI] [PubMed] [Google Scholar]
- 31.Hinkelman LM, Liu D, Metlay LA, Waag RC. Measurements of ultrasonic pulse arrival time and energy level variations produced by propagation through abdominal wall. J. Acoust. Soc. Am. 1994;95:530–541. doi: 10.1121/1.408347. [DOI] [PubMed] [Google Scholar]
- 32.Hinkelman LM, Szabo TL, Waag RC. Measurements of ultrasonic pulse distortion produced by human chest wall. J. Acoust. Soc. Am. 1997;101(no. 4):2365–2373. doi: 10.1121/1.418248. [DOI] [PubMed] [Google Scholar]
- 33.Wells PNT. Biomedical Ultrasonics. 1st ed. New York, New York: Academic Press Inc.; 1977. [Google Scholar]
- 34.Westervelt PJ. Parametric acoustic array. J. Acoust. Soc. Am. 1963;35:535–537. [Google Scholar]
- 35.Hamilton MF, Blackstock DT. Nonlinear Acoustics. San Diego: Academic Press; 1997. [Google Scholar]
- 36.Jensen JA. Field: A program for simulating ultrasound systems. Med. Biol. Eng. Comp., col. 10th Nordic-Baltic Conference on Biomedical Imaging. 1996;4(no. 1):351–353. [Google Scholar]
- 37.Berenger J-P. A perfectly matched layer for the absorption of electromagnetic waves. J. Comp. Phys. 1994;114:185–200. [Google Scholar]
- 38.Chew WC, Liu QH. Perfectly matched layers for elastodynamics: A new absorbing boundary condition. J. Comput. Acoust. 1996;4(no. 4):72–79. [Google Scholar]
- 39.Liu Q-H, Tao J. The perfectly matched layer for acoustic waves in absorbtive media. J. Acoust. Soc. Am. 1997;102(no. 4):2072–2082. [Google Scholar]
- 40.Pinton G. Ph.D. dissertation. Duke University; 2007. Numerical methods for nonlinear wave propagation in ultrasound. [Google Scholar]
- 41.Hinkelman LM, Metlay LA, Churukian CJ, Waag RC. Modified gomori trichrome stain technique for macroscopic tissue slices. J. Histotech. 1996;19(no. 4):321–323. [Google Scholar]
- 42.Tabei M, Mast TD, Waag R. Simulation of ultrasonic focus aberration and correction through human tissue. JASA. 2003;113(no. 2):1166–1176. doi: 10.1121/1.1531986. [DOI] [PubMed] [Google Scholar]
- 43.Szabo TL. Diagnostic ultrasound imaging. Elsevier Academic Press; 2004. [Google Scholar]
- 44.Dahl JJ, McAleavey SA, Pinton GF, Soo MS, Trahey GE. Adaptive imaging on a diagnostic ultrasound scanner at quasi real-time rates. IEEE Trans. Ultrason., Ferroelec., Freq. Contr. 2006;53(no. 10):1832–1843. doi: 10.1109/tuffc.2006.115. [DOI] [PubMed] [Google Scholar]
- 45.Rigby KW, Chalek CL, Haider BH, Lewandowski RS, O’Donnell M, Smith LS, Wildes DG. Improved In Vivo abdominal image quality using real-time estimation and correction of wavefront arrival time errors. Proceedings IEEE Ultrasonics Symposium. 2000;2:1645–1653. [Google Scholar]


