

SUMMARY
Motion detection is an essential component of visual processing. On-Off direction-selective retinal ganglion cells (On-Off DSGCs) detect objects moving along specific axes of the visual field due to their precise retinal circuitry. The brain circuitry of On-Off DSGCs, however, is largely unknown. We report a mouse with GFP expressed selectively by the On-Off DSGCs that detect posterior motion (On-Off pDSGCs), allowing two-photon targeted recordings of their light responses and delineation of their complete map of central connections. On-Off pDSGCs project exclusively to the dorsal lateral geniculate nucleus and superior colliculus and in both targets form synaptic lamina that are separate from a lamina corresponding to non-DSGCs. Thus, individual On-Off DSGC subtypes are molecularly distinct and establish circuits that map specific qualities of directional motion to dedicated subcortical areas. This suggests that each RGC subtype represents a unique parallel pathway whose synaptic specificity in the retina is recapitulated in central targets.
INTRODUCTION
Direction selectivity—the preferential response of a neuron to stimuli moving in one direction of the visual field—is a hallmark feature of the mammalian visual system that is critical for perception and behavior. Direction-selective retinal neurons were first identified nearly a half-century ago (Barlow and Hill, 1963) by recordings from rabbit retinal ganglion cells (RGCs). Direction selectivity has also been described for neurons in retinorecipient nuclei (Simpson, 1984) and in visual cortex (Hubel and Wiesel, 1962). Understanding the circuitry that underlies direction selectivity at each stage of visual processing—retinal, subcortical, and cortical—remains an intensive focus, both for understanding visual perception and as a general model for exploring how neural circuits encode specific features of the sensory environment.
There are three categories of direction-selective ganglion cells (DSGCs): On DSGCs respond to global motion in one of three directions: upward, downward, or posterior (Oyster, 1968; Sun et al., 2006). Off DSGCs respond to upward motion (Kim et al., 2008). The third category, On-Off DSGCs, includes four subtypes, each responding to motion in one cardinal direction: anterior, posterior, superior, or inferior (Oyster, 1968; Weng et al., 2005). On-Off DSGCs are the most numerous DSGCs and are specialized for detecting object motion (Vaney et al., 2000). The current model is that the unique directional tuning of each On-Off DSGC subtype arises from an asymmetric pattern of inhibitory inputs that are different for each subtype (Fried and Masland, 2007; Demb, 2007). Remarkably, this subtype-specific connectivity is established independent of visual experience (Chan and Chiao, 2008; Chen et al., 2008; Elstrott et al., 2008). Together, these features suggest that each On-Off DSGC subtype is molecularly distinct. However, evidence of a unique molecular signature for individual On-Off DSGC subtypes has not been provided.
Despite the importance of On-Off DSGCs for detecting object motion, very little is known about their patterns of central projections (reviewed in Berson, 2008). There is evidence in rabbits that On-Off DSGCs project to the SC (Vaney et al., 1981) and dLGN (Stewart et al., 1971), but those may not be their exclusive targets (Pu and Amthor, 1990), and it is unclear if those results apply to other species. Moreover, how the axonal connections of individual On-Off DSGC subtypes are arranged within their targets is completely unknown. Thus, how object motion detected by the retina is represented in the brain and contributes to higher-order visual processing remains unclear. Here we report a transgenic mouse with GFP selectively expressed by On-Off DSGCs that respond to posterior motion, allowing us to resolve the complete pattern of axonal connections unique to this On-Off DSGC subtype.
RESULTS
During a screen to identify mice with GFP selectively expressed by individual RGC subtypes, we examined retinas from transgenic mice with GFP expressed under the control of the dopamine receptor 4 promoter (DRD4-EGFP) (Gong et al., 2003). In these mice, GFP+ cells are present throughout the ganglion cell layer (Figures 1A and 1B) but not in other retinal layers (Figure 1C). Close examination revealed two distinct bands of GFP+ dendrites in the inner plexiform layer (IPL) (Figure 1C), suggesting the GFP+ cells were bistratified. Dendritic bistratification is a defining characteristic of On-Off DSGCs (Vaney et al., 2000; Berson, 2008). We therefore conducted a series of experiments to determine whether the GFP+ cells were in fact On-Off DSGCs and, if so, whether they belonged to a single subtype.
Figure 1. A Mosaic of GFP+ On-Off RGCs in DRD4-GFP Mice.
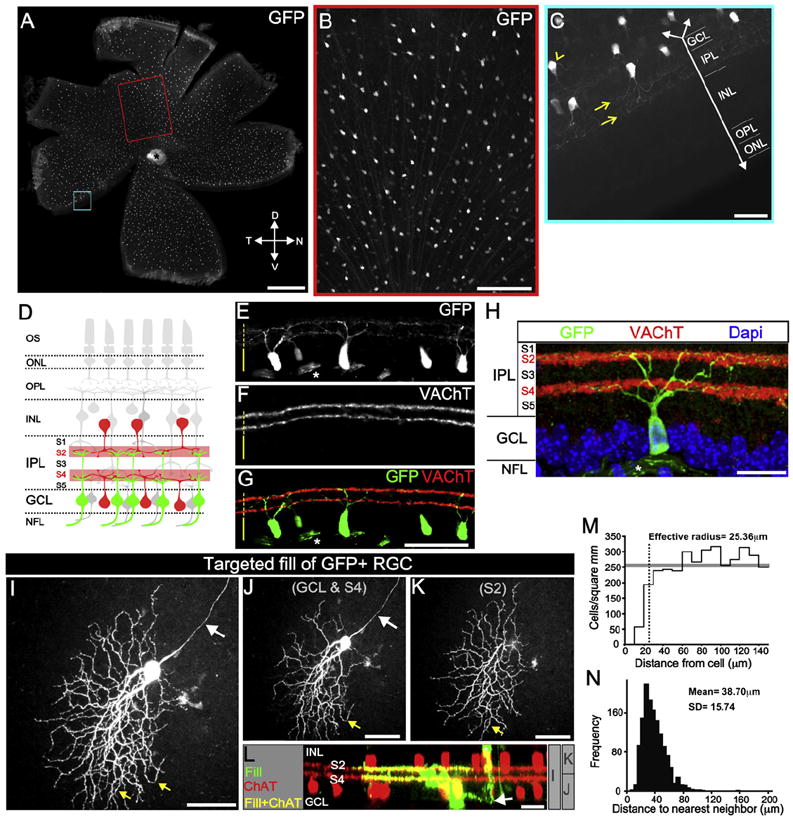
(A) Fluorescence image of whole-mount DRD4-GFP retina. T, temporal; N, nasal; D, dorsal; V, ventral. Scale bar, 500 μm.
(B) Red-framed region in (A). Scale bar, 200 μm.
(C) Blue-framed region in (A). Downward arrow, axis perpendicular to retinal layers. GFP+ dendrites (yellow arrows) in the inner plexiform layer (IPL). INL, inner nuclear layer; OPL, outer plexiform layer; ONL, outer nuclear layer. Arrowhead, GFP+ axon. Scale bar, 50 μm.
(D) Starburst amacrine cell (SBAC) somas (red) and dendrites (pale red) in IPL sublamina 2 (S2) and S4. On-Off DGSCs (green) project dendrites to S2 and S4. Labels as in (C), plus NFL, nerve fiber layer; and OS, outer segments.
(E–H) DRD4-GFP retinas stained for GFP (E), VAChT (F), and merged (G and H). Asterisks, GFP+ axons. Dashed line, IPL. Solid line, GCL. (E–G) Scale bar, 100 μm.
(H) Scale bar, 50 μm.
(I–L). Biocytin-filled GFP+ RGC and ChAT+ SBACs. (I) Complete view of filled RGC. White arrow, axon. Yellow arrows, “looping” arborizations. (J) The portion of the RGC in GCL-S4 and, (K) in S2. (L) Side view of the filled RGC (green) and ChAT+ SBACs (red) and their overlap (yellow). Arrow, axon. Asterisk, amacrine cell. Gray bars, depths of view for (I)–(K). Scale bar, 50 μm (I–K) and 25 μm (L).
(M) Density recovery profile (Rodieck, 1991). Gray bar, average cell density. Dashed line, effective radius, within which it was rare to observe another GFP+ soma.
(N) Distribution of the distances between nearest-neighbor GFP+ RGCs.
First, all the GFP+ cells were RGCs because every GFP+ cell had an axon (Figures 1B, 1C, and 1I), and all GFP+ cells disappeared following optic nerve transection (data not shown). Second, the GFP+ dendrites costratified with the processes of starburst amacrine cells (SBACs) in the IPL (Figures 1E–1H)—the anatomical feature most closely associated with the On-Off DSGC classification (Figure 1D) (Demb, 2007; Fried and Masland, 2007).
Next we filled individual GFP+ RGCs with biocytin, then immunostained the retina for ChAT, which labels SBAC somas and processes. In every case (n = 13 cells), the On and Off dendritic arbors of the filled GFP+ RGC costratified with the processes of SBACs (Figures 1I–1L.). Also, the dendritic fields of the RGCs were ovoid-shaped and exhibited “looping” arborizations (Figures 1I–1K)—additional characteristics of mouse DSGCs (Weng et al., 2005; Sun et al., 2006). Some GFP+ RGCs exhibited asymmetric arbors (e.g., Figure 1I), but this varied across cells. Previous work established that there is no relationship between dendritic asymmetry and preferred direction of an On-Off DSGC (Chan and Chiao, 2008; Yang and Masland, 1994).
The above data strongly suggested that all GFP+ cells in the retinas of DRD4-GFP mice were On-Off DSGCs. The somas of RGCs belonging to the same subtype are nonrandomly distributed (Wässle, 2004). We therefore analyzed the spatial distribution of GFP+ somas and discovered that they form a regular mosaic (Figure 1M) (regularity index = 2.46; p < 0.0001 versus a random distribution; n = 205), with ~40 μm between GFP+ somas (Figure 1N). The average density of GFP+ RGCs was 275 (±79) cells/mm2 (n = 20 fields; n = 5 mice), which is 5%–9% of the total RGC population (Jeon et al., 1998; Lin et al., 2004), which is within the range of other mouse RGC subtypes (Sun et al., 2002). Collectively, our findings support the hypothesis that, in DRD4-GFP mice, GFP is expressed by one subtype of On-Off DSGCs.
To confirm that the GFP+ RGCs represented a single subtype of On-Off DSGCs, we recorded their light responses. Under conventional fluorescent optics, exposure of the retina to the excitation wavelength for GFP would significantly bleach the photoreceptors. Therefore, we performed two-photon targeted patch-clamp recordings (Margrie et al., 2003) in which an infrared femtosecond laser, tuned to a wavelength (920 nm) outside the absorption band of mouse photoreceptors, was used to localize a patch pipette filled with a fluorescent dye and the GFP+ cells (Figure S2 available online). Once the pipette and a GFP+ cell were localized to the same field of view, infrared optics was used to obtain loose-patch recordings.
In response to drifting square-wave gratings, nearly all GFP+ cells (18/21) had a strong directional response (Figures 2A and 2B1). Remarkably, all the direction-selective GFP+ cells exhibited a strong preference for motion toward the nasal pole of the retina, which in visual coordinates corresponds to posterior motion (Figure 2C). Most GFP+ cells exhibited both ON and OFF responses to flashes of a white spot centered on the soma (Figure 2B2), although the amplitudes of the ON and OFF responses varied between cells. Furthermore, both the brightest and less-bright GFP+ RGCs exhibited On-Off responses with strong posterior direction tuning (Figure S3). Hence, the GFP+ cells in the retinas of DRD4-GFP mice are the posterior-motion-preferring subtype of On-Off DSGCs (On-Off pDSGCs).
Figure 2. Two-Photon Targeted Recordings of GFP+ Cells Reveal a Preference for Posterior Motion.
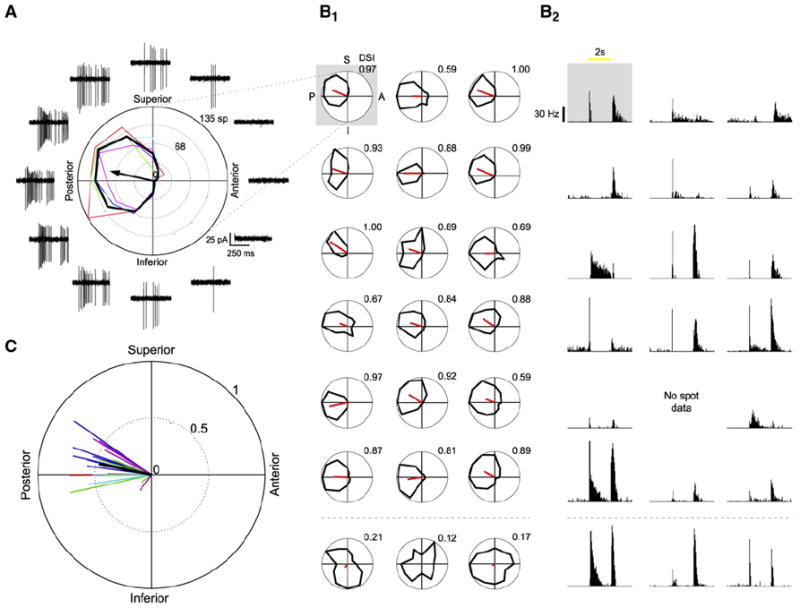
(A) A GFP+ RGC’s responses to drifting gratings. Black tuning curve shows the mean response (spike count during 3 s of gratings); colored curves show the responses for each repetition (red, green, blue, cyan, magenta). Black arrow indicates the vector sum of responses. Traces show the data for the first 500 ms of gratings stimuli (two periods). Frequent presentation of edges in the gratings stimulus makes resolving the on and off responses difficult.
(B) Light responses for all recorded cells. (B1) Responses to drifting gratings. Black curve shows the mean response for each cell. Red line shows the vector sum of the responses (see Supplemental Experimental Procedures). Gray box indicates the cell shown in (A). Cells with DSI lower than 0.5 are shown in the last row. (B2) Spike-density histograms of corresponding On and Off spike responses to a 100 μm spot shown centered on the soma (ten repetitions, 50 ms bins). Yellow bar represents the time of the spot stimuli.
(C) Vector sums of all recorded cells (n = 21 cells from 5 retinas, 5 mice). Each color indicates a different retinal preparation. The black line shows the mean vector sum of all the cells.
In DRD4-GFP mice, GFP is present in the soma, dendrites, and axons of On-Off pDSGCs (Figure 1). Moreover, there are no GFP+ neurons within or projecting to retinorecipient nuclei. This raised the unprecedented opportunity to delineate all the brain regions that receive synaptic input from On-Off pDSGCs and to reveal the subtype-specific patterns of connections made within their targets.
First, we labeled all RGC axons by injecting CTb-594 into both eyes. Then, to determine the connections specifically made by On-Off pDSGCs, we examined each retinorecipient area for axons that were both CTb-594+ and GFP+. No GFP+ axons were observed in the hypothalamus, vLGN, IGL, pretectum, or accessory optic system (Figure S4). GFP+ axons were, however, visible in the optic nerves, chiasm, and tracts (Figures 3, 4, and S4) and in the synaptic neuropil of the dLGN and SC (Figures 3 and 4). Thus, in mice, On-Off pDSGCs project exclusively to the dLGN and SC.
Figure 3. On-Off pDSGCs Form Laminar-Specific Connections in the dLGN.
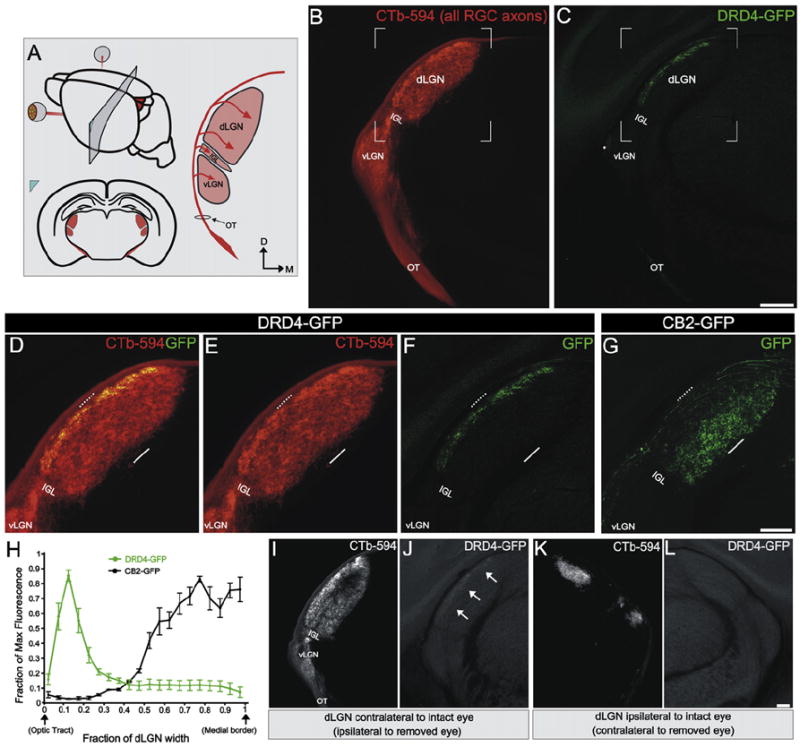
(A) Schematic of region shown in (B)–(L) and RGC axons entering the dLGN (arrows). Red, RGC axons from both eyes labeled with CTb-594; OT, optic tract; vLGN, ventral lateral geniculate nucleus; IGL, intergeniculate leaflet; dLGN, dorsal lateral geniculate nucleus. D, dorsal; M, medial.
(B) CTb+ RGC axons at the level depicted in (A). (C) GFP+ On-Off pDSGC axons at the level depicted in (A). (B and C) Scale bar, 400 μm.
(D–F) Area framed in (B) and (C). Dashed line, lateral dLGN; solid line, medial dLGN. (D) Merge of CTb+ and GFP+ RGC axons. (E) CTb+ RGC axons. (F) GFP+ On-Off pDSGC axons.
(G) GFP+ tOff-αRGCs axons (Huberman et al., 2008). (D–G) Scale bar, 200 μm.
(H) Fluorescence intensity across the dLGN width in DRD4-GFP and CB2-GFP mice. (n = 2 CB2 mice and n = 3 DRD4 mice; ±SEMs).
(I–L) CTb+ (I and K) and GFP+ (J and L) axons in the in dLGN contralateral (I and J) and ipsilateral (K and L) to the intact eye of a DRD-GFP mouse with one eye removed. (J) arrows, GFP+ On-Off DSGC lamina. (L) No GFP+ axons are present. Scale bar, 100 μm.
Figure 4. On-Off pDSGCs Form Laminar-Specific Connections in the SC.
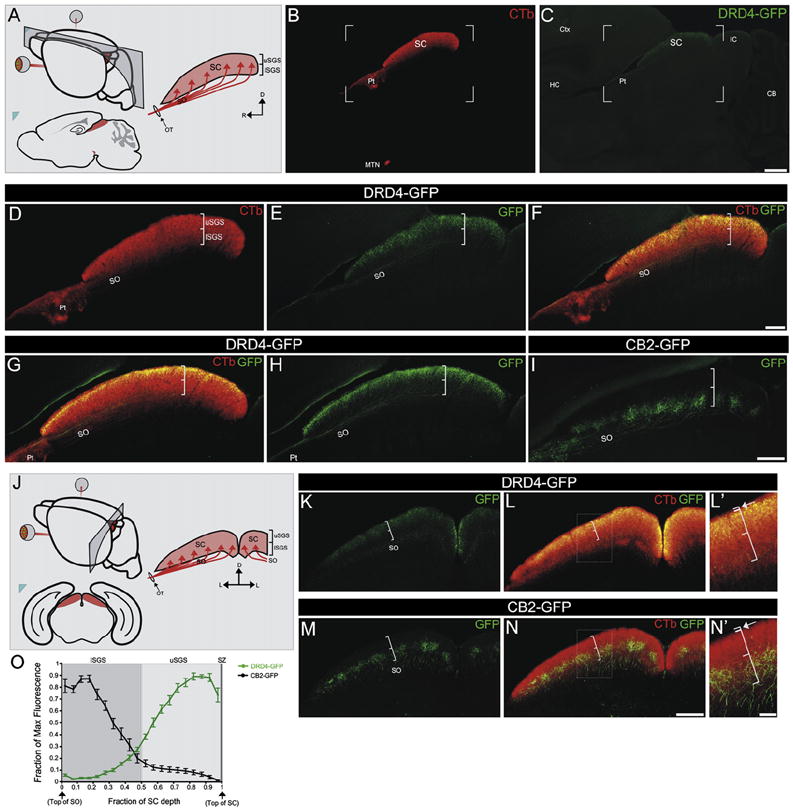
(A) Schematic of regions shown in (B)–(I) and sagittal view of RGC axons entering the SC (red arrows). SC, superior colliculus; SO, stratum opticum; brackets denote the uSGS (upper stratum griseum superficialis) and lSGS (lower stratum griseum superficialis). R, rostral; C, caudal; D, dorsal.
(B) CTb+ axons in the SC. Pt, pretectum; MTN, medial terminal nucleus. (C) GFP+ On-Off pDSGC axons in the SC. (B and C) Scale bar, 500 μm.
(D–F) Framed area in (B) and (C). (D) CTb+ axons in the SO and SGS. Brackets denote uSGS and lSGS as in (A). (E) GFP+ On-Off pDSGC axons in the SO and uSGS. (F) Merge of (D) and (E). Scale bar, 200 μm.
(G) Merged view of CTb+ and GFP+ On-Off pDSGC axons in the SC and (H) GFP+ axons viewed alone. (I) GFP+ tOff-αRGC axons targeting the lSGS, wherein they form columns (Huberman et al., 2008). (G–I) Scale bar, 200 μm.
(J) Schematic of the region in (K)–(N) and coronal view of RGC axons entering the SC. L, lateral.
(K–L′) GFP+ On-Off pDSGC axons (K) and merged with CTb+ axons (L) in the SC. (L′) Boxed region in (L). Brackets denote lSGS and uSGS. The thinner bracket (arrow) straddles the stratum zonale (SZ), a thin retinorecipient lamina above the uSGS.
(M–N′) GFP+ tOff-αRGC axons (M) and merged with CTb+ axons (N) in the SC. (N′) Boxed region in (N). Conventions as in (L′).
(K–N) Scale bar, 200 μm. (L′ and N′) Scale bar, 50 μm.
(O) Fluorescence intensity along the SC depth in DRD4-GFP and CB2-GFP mice (n = 5 CB2 mice and n = 5 DRD4 mice; ±SEMs).
What are the specific connections made by On-Off pDSGCs in their targets? Whereas CTb+ axons terminated throughout the dLGN (Figures 3B, 3D, and 3E), the axons of On-Off pDSGCs were limited to a distinct lamina along the lateral dLGN (Figures 3C, 3D, and 3F). This was obvious at all dorsal-ventral and rostral-caudal positions in the dLGN (i.e., the entire retinotopic map), indicating that every GFP+ On-Off pDSGC that projects to this target faithfully restricts its axonal arbor to a specific laminar depth (Figure 3H). All GFP+ axons disappeared from the contralateral dLGN following unilateral eye removal (Figures 3I–3L). The GFP+ lamina in the dLGN of DRD-GFP mice therefore represents On-Off pDSGC axons from the contralateral eye.
In CB2-GFP mice, transient Off-alpha (tOff-α) RGCs express GFP and project to a specific lamina in the dLGN (Huberman et al., 2008). Interestingly, the lamina formed by tOff-αRGCs and the lamina formed by On-Off pDSGCs were separated from one another along the width of the dLGN (Figures 3D–3H). Thus, despite a lack of cellular lamination, the mouse dLGN contains multiple, highly organized, laminar-specific parallel pathways.
On-Off pDSGC projections to the SC were also laminar specific. CTb+ axons entered the SC through the stratum opticum (SO) and arborized throughout the overlying stratum griseum superficialis (SGS) (Figures 4A, 4B, and 4D). By contrast, the axons of On-Off pDSGCs terminated exclusively in the upper half of the SGS (uSGS), forming a distinct GFP+ lamina (Figures 4C–4H and 4O). Laminar specificity of On-Off pDSGC projections to the uSGS was clearly evident in both the sagittal (Figures 4A–4H) and coronal (Figures 4J–4L) view of the SC (Figures 4J–L′) and thus the entire retinotopic map. Dye injections into the SC retrogradely labeled every GFP+ cell in the contralateral retina but no GFP+ cells in the ipsilateral retina (data not shown). Together, these findings indicate that (1) the GFP+ axons in the dLGN are collaterals of GFP+ axons that also target the SC and (2) all On-Off pDSGCs projections to the SC arise from the contralateral eye, are laminar specific, and targeted to the uSGS.
In the SC, the projections of On-Off pDSGCs were spatially distinct from the projections of tOff-αRGCs, which targeted the lSGS (Figures 4I and 4M–4O) (Huberman et al., 2008). Indeed, the lamina for these two RGC subtypes were complementary throughout the SC (Figures 4H–4O). Thus, tOFF-αRGCs and On-Off pDSGCs that reside next to each other project their axons to the same topographic location in the contralateral SC. At that topographic location, however, On-Off pDSGCs ensure they position their synapses dorsal to those of tOFF-αRGCs. Interestingly, whereas tOff-αRGCs axons form patches (columns) in the SC (Figures 4I, 4M, and 4N) (Huberman et al., 2008), columns of On-Off pDSGC axon arbors were never observed; instead they established a uniform map of posterior motion.
DISCUSSION
Since their discovery nearly 50 years ago (Barlow and Hill, 1963), On-Off DSGCs have been the focus of intense study. However, because of an inability to selectively and completely label On-Off DSGCs, their brain circuitry remained poorly understood. Our data provide a complete map of central projections for one On-Off DSGC subtype and thereby reveal a highly precise laminar map of posterior object motion. These findings have several implications for understanding how different parallel pathways exiting the retina are translated into specific patterns of circuitry in the brain.
First, On-Off pDSGCs project to the dLGN and SC but not to any other retinorecipient areas (Figures 3, 4, and S4), including the accessory optic nuclei. The accessory optic nuclei are the targets of On DSGCs, which respond to global movement of the visual scene and thereby contribute to image stabilization (Simpson, 1984). Thus, the outputs of retinal circuits that locally detect posterior motion are segregated into entirely different targets from the outputs of retinal circuits that detect global visual motion, and visa versa. Knowledge of where On DSGCs project in the brain led to an understanding of their specific contributions to visual processing and behavior (Simpson, 1984; Yonehara et al., 2009). The genetically identified central projection map of On-Off pDSGCs provided here can now be used to explore how DGSCs that detect local object motion contribute to visual perception and behavior.
Second, the dLGN and SC neurons that receive input from On-Off pDSGCs should be influenced by posterior motion and, in the case of dLGN neurons, relay that information to visual cortex. Mouse dLGN receptive fields have been described as center-surround, with linear spatial summation and exclusively On-center or Off-center responses (Grubb and Thompson, 2003). Posterior direction-selective dLGN or SC neurons have not been reported, but it is unclear if recordings have ever been made from neurons directly postsynaptic to On-Off pDSGCs. Another possibility is that dLGN and SC receptive fields are built from the inputs of more than one RGC subtype and thus are more broadly tuned. Here we provide a genetically labeled spatial map of On-Off pDSGC central connections that can be used to guide exploration of how this highly specific visual processing stream is combined with other retinal outputs and local circuit connections in the dLGN and SC.
Third, each RGC subtype is known to encode a unique aspect of the visual world due to the subtype-specific pattern of synaptic input it receives in the IPL (Roska and Werblin, 2001). Our results, combined with other recent findings (Huberman et al., 2008; Kim et al., 2008; Yonehara et al., 2009) now indicate that the axonal connections of each RGC subtype are also subtype specific, thereby distributing unique visual information to highly specific locations in the brain. Those axonal connections can be laminar specific, as shown here, or they may rely on precise subcellular targeting. A prime example of subcellular specificity occurs in the retina where all four On-Off DSGC subtypes project their dendrites to the same two IPL sublamina, and yet each On-Off DSGC subtype responds to motion along a different axis of the visual field, due to the unique pattern of synaptic input it receives within those sublamina (Demb, 2007). To achieve such a remarkable degree of wiring specificity, apparently identical RGCs may in fact be molecularly distinct. Here we provide evidence that one of the On-Off DSGC subtypes indeed has a unique molecular signature, indicating that functional and molecular identity rather than laminar specificity per se dictates the wiring diagram between the eye and the brain.
EXPERIMENTAL PROCEDURES
DRD4-GFP Mice
Mice were obtained from MMRRC (http://www.mmrrc.org/strains/231/0231.html) (see Gong et al., 2003) and crossed to C57/Bl6 in our laboratory. Physiology was carried out on C57/Bl6 mice.
Retinal and Brain Histology
Immunostaining and CTb protocols are as in Huberman et al. (2008).
Quantification of Axonal Projections
Using a rectangular window, we measured GFP pixel intensity along the width of the retinorecipient dLGN and depth of the SC. We normalized the width and depth (SC) values to be a fraction of the total width/depth in that section and normalized the raw fluorescence signal (Fraw) at each position as follows:
where Fmin was the minimum fluorescence value and Fmax was the maximum fluorescence value in a given section. Normalized fluorescence values were binned at 5% intervals and averaged across animals.
Quantification of GFP+ RGC Mosaics and Density
The x and y coordinates and density of GFP+ RGCs were determined from four fields, 0.25 mm2 each (n = 5 retinas; 20 fields total). For all cells in a given field, the distance to its nearest neighbor (NN) was calculated by dividing the mean NN distance by the standard deviation. Regularity indices were compared to random distributions of the same number of cells (Cook, 1996). Density was calculated across fields taken from different retinal quadrants and eccentricity. Autocorrelograms (ACGs) were prepared for each field, and a density recovery profile (DRP) was constructed (Rodieck, 1991) (see Supplemental Experimental Procedures).
Electrophysiology
All retinas were P26–P34 in age. Mice were anesthetized with isofluorane and decapitated. Retinas (4 right eye, 1 left eye; n = 5 mice) were isolated from pigment epithelium in oxygenated Ames’ medium (Sigma) under IR illumination, cut into dorsal and ventral halves, and mounted photoreceptors down over a hole of 1–1.5 mm2 on filter paper (Millipore). Retinas were kept dark at room temperature in Ames’ medium bubbled with 95% O2/5% CO2 until use (0–7 hr). All animal procedures were approved by the UC Berkeley Institutional Animal Care and Use Committee and conformed to the NIH Guide for the Care and Use of Laboratory Animals, the Public Health Service Policy, and the SFN Policy on the Use of Animals in Neuroscience Research.
Two-Photon Targeted Recording from GFP-Labeled Retinal Ganglion Cells
Filter-paper-mounted retinas were placed under the microscope and superfused with warmed (~32°C) Ames’ medium. An image of the GCL was formed by IR illumination (>850 nm) through the condenser, acquired by a CCD camera, and displayed on a TV monitor. Glass microelectrodes filled with Ames’ medium and 20 μM Alexa 568 were placed right above the inner limiting membrane (ILM). GFP and Alexa 568 fluorescence were detected with a custom-built two-photon microscope based on a Fluoview laser-scanning system and a Ti: Sapphire laser (Coherent) running at 920 nm to avoid bleaching of photoreceptors. GFP cells were identified by their relative position to the Alexa-filled electrodes and mapped to the transmitted light image on the TV monitor. The ILM above the target GFP cell was then carefully dissected with the glass electrode. Loose-patch voltage-clamp recordings (holding voltage set to “OFF”) were performed with a new glass electrode (3–5 MΩ) filled with Ames’ medium and 20 μM Alexa 568. Data was acquired through an Axopatch 200B (Molecular Devices) and digitized at a sampling rate of 10 kHz. The Alexa-filled electrode and its attached GFP cell were imaged again with the two-photon microscope at the end of the recording to confirm correct targeting and the integrity of the plasma membrane of the recorded cell (see Figure S2).
Visual Stimulation
Visual stimuli were generated using an Intel core duo computer with a Windows XP OS running a white, monochromatic organic light-emitting display (OLED-XL, eMagin, Bellevue, WA, 800 × 600 pixel resolution, 85 Hz refresh rate). Custom stimuli were developed using Matlab and the Psychophysics Toolbox (Brainard, 1997; Pelli, 1997). The display image was projected through the same 60x water-immersion objective used for targeting cells (LUMPlanFl/IR, NA = 0.9) via the side port of the microscope (Figure S2), centered on the soma of the recorded cell, and focused on the photoreceptor layer. The diameter of the entire display on the retina was 225 μm across, with a gray screen intensity of ~1.2 × 10¹³ 514 nm equivalent photons/s/cm2. We used ten repetitions of a 100 μm white spot (2 s black, 2 s white, 2 s black) to test on and off responses. To test directional responses, we presented five repetitions of drifting square-wave gratings (spatial frequency = 225 μm/cycle, temporal frequency 4 cycles/second, ~30 deg/s in 12 pseudorandomly chosen directions spaced at 30 degree intervals, with each presentation lasting 3 s followed by 500 ms of gray screen.
Data Analysis
We used custom Matlab software to bandpass filter the data between 80 and 2000 Hz and extract spike times. The preferred direction of each cell and the direction selective index (DSI) were computed as described (Elstrott et al., 2008; Supplemental Experimental Procedures). Occasionally, cells would show high tonic firing independent of light stimulation. Therefore, we excluded cells if background firing before the spot stimulus (defined as maximal firing during the initial 2 s of black screen) was greater than 40% of the maximum stimulus-evoked response.
Intracellular Filling and Immunostaining Filled Cells
Retinas mounted on filter papers were placed under the microscope and superfused with warmed (~32°C) and oxygenated artificial CSF (ACSF) (in mM: 119 NaCl, 2.5 KCl, 1.3 MgCl2, 1.0 K2HPO4, 2.5 CaCl2, 26.2 NaHCO3, and 11 D-glucose). GFP-expressing cells were identified by epifluorescence. Glass microelectrode (3–5 M Ω) filled with an internal solution (containing 98.3 mM potassium-gluconate, 1.7 mM KCl, 0.6 mM EGTA, 5 mM MgCl2, 2 mM Na2-ATP, 0.3 mM GTP, and 40 mM HEPES, pH 7.25 with KOH, 20 μM Alexa Fluor 488, and 3 mg/ml biocytin [Sigma]) was used to deliver biocytin into GFP-expressing cells in the whole-cell patch-clamp configuration for 10–20 min. Alexas do not cross gap junctions between RGCs. The electrodes were then carefully withdrawn, the retina fixed with 4% PFA for 15 min and then processed for visualization of biocytin and ChAT (see Supplemental Experimental Procedures).
Supplementary Material
Acknowledgments
We thank Jay Demas for assistance with the OLED stimulation, Mariko Howe for surgery assistance, and Stephen Baccus, Tom Clandinin, and David Feldheim for their suggestions. This work was supported by NIH RO1 EY011310-13 (B.A.B), NIH R21 EY018320 (B.A.B), RO1 EY13528 (M.B.F), and NSF IOS0818983 (M.B.F). J.E. was supported by a NSF Graduate Research Fellowship. B.K.S. was supported by a UCSC Chancellors Fellowship. A.D.H. was supported by a Helen Hay Whitney Postdoctoral Fellowship.
Footnotes
SUPPLEMENTAL DATA The Supplemental Data include four figures and Supplemental Experimental Procedures and can be found with this article online at http://www.neuron.org/supplemental/S0896-6273(09)00295-5.
References
- Barlow HB, Hill RM. Selective sensitivity to direction of movement in ganglion cells of the rabbit retina. Science. 1963;139:412–414. doi: 10.1126/science.139.3553.412. [DOI] [PubMed] [Google Scholar]
- Berson DM. Retinal ganglion cell types and their central projections. In: Albright TD, Masland R, editors. The Senses: A Comprehensive Reference. Vol. 1. San Diego: Academic Press; 2008. pp. 491–520. Vision 1. [Google Scholar]
- Brainard DH. The psychophysics toolbox. Spat Vis. 1997;10:433–436. [PubMed] [Google Scholar]
- Chan YC, Chiao CC. Effect of visual experience on the maturation of ON–OFF direction selective ganglion cells in the rabbit retina. Vision Res. 2008;48:2466–2475. doi: 10.1016/j.visres.2008.08.010. [DOI] [PubMed] [Google Scholar]
- Chen M, Weng S, Deng Q, Xu Z, He S. Physiological properties of direction-selective ganglion cells in early postnatal and adult mouse retina. J Physiol. 2008;587:819–828. doi: 10.1113/jphysiol.2008.161240. [DOI] [PMC free article] [PubMed] [Google Scholar]
- Cook JE. Spatial properties of retinal mosaics: an empirical evaluation of some existing measures. Vis Neurosci. 1996;13:15–30. doi: 10.1017/s0952523800007094. [DOI] [PubMed] [Google Scholar]
- Demb JB. Cellular mechanisms for direction selectivity in the retina. Neuron. 2007;55:179–186. doi: 10.1016/j.neuron.2007.07.001. [DOI] [PubMed] [Google Scholar]
- Elstrott J, Anishchenko A, Greschner M, Sher A, Litke AM, Chichilnisky EJ, Feller MB. Direction selectivity in the retina is established independent of visual experience and cholinergic retinal waves. Neuron. 2008;58:499–506. doi: 10.1016/j.neuron.2008.03.013. [DOI] [PMC free article] [PubMed] [Google Scholar]
- Fried SI, Masland RH. Image processing: how the retina detects the direction of image motion. Curr Biol. 2007;17:R63–R66. doi: 10.1016/j.cub.2006.12.013. [DOI] [PubMed] [Google Scholar]
- Gong S, Zheng C, Doughty ML, Losos K, Didkovsky N, Schambra UB, Nowak NJ, Joyner A, Leblanc G, Hatten ME, Heintz N. A gene expression atlas of the central nervous system based on bacterial artificial chromosomes. Nature. 2003;425:917–925. doi: 10.1038/nature02033. [DOI] [PubMed] [Google Scholar]
- Grubb MS, Thompson ID. Quantitative characterization of visual response properties in the mouse dorsal lateral geniculate nucleus. J Neurophysiol. 2003;90:3594–3607. doi: 10.1152/jn.00699.2003. [DOI] [PubMed] [Google Scholar]
- Hubel DH, Wiesel TN. Receptive fields, binocular interaction and functional architecture in the cat’s visual cortex. J Physiol. 1962;160:106–154. doi: 10.1113/jphysiol.1962.sp006837. [DOI] [PMC free article] [PubMed] [Google Scholar]
- Huberman AD, Manu M, Koch S, Susman M, Lutz A, Ullian E, Baccus S, Barres BA. Architecture and activity-mediated refinement of axonal projections from a mosaic of genetically identified retinal ganglion cells. Neuron. 2008;59:425–438. doi: 10.1016/j.neuron.2008.07.018. [DOI] [PMC free article] [PubMed] [Google Scholar]
- Jeon CJ, Strettoi E, Masland RH. The major cell populations of the mouse retina. J Neurosci. 1998;18:8936–8946. doi: 10.1523/JNEUROSCI.18-21-08936.1998. [DOI] [PMC free article] [PubMed] [Google Scholar]
- Kim I, Zhang Y, Yamagata M, Meister M, Sanes JR. Molecular identification of a retinal cell type that responds to upward motion. Nature. 2008;452:478–482. doi: 10.1038/nature06739. [DOI] [PubMed] [Google Scholar]
- Lin B, Wang SW, Masland RH. Retinal ganglion cell type, size, and spacing can be specified independent of homotypic dendritic contacts. Neuron. 2004;43:475–485. doi: 10.1016/j.neuron.2004.08.002. [DOI] [PubMed] [Google Scholar]
- Margrie T, Meyer A, Caputi A, Monyer H, Hasan M, Schaefer A, Denk W, Brecht M. Targeted whole-cell recordings in the mammalian brain in vivo. Neuron. 2003;39:911–918. doi: 10.1016/j.neuron.2003.08.012. [DOI] [PubMed] [Google Scholar]
- Oyster CW. The analysis of image motion by the rabbit retina. J Physiol. 1968;199:613–635. doi: 10.1113/jphysiol.1968.sp008671. [DOI] [PMC free article] [PubMed] [Google Scholar]
- Pelli DG. The VideoToolbox software for visual psychophysics: transforming numbers into movies. Spat Vis. 1997;10:437–442. [PubMed] [Google Scholar]
- Pu ML, Amthor FR. Dendritic morphologies of retinal ganglion cells projecting to the nucleus of the optic tract in the rabbit. J Comp Neurol. 1990;302:657–674. doi: 10.1002/cne.903020319. [DOI] [PubMed] [Google Scholar]
- Rodieck RW. The density recovery profile: a method for the analysis of points in the plane applicable to retinal studies. Vis Neurosci. 1991;6:95–111. doi: 10.1017/s095252380001049x. [DOI] [PubMed] [Google Scholar]
- Roska B, Werblin B. Vertical interactions across ten parallel, stacked representations in the mammalian retina. Nature. 2001;410:583–587. doi: 10.1038/35069068. [DOI] [PubMed] [Google Scholar]
- Simpson JI. Theaccessory optic system. Annu Rev Neurosci. 1984;7:13–41. doi: 10.1146/annurev.ne.07.030184.000305. [DOI] [PubMed] [Google Scholar]
- Stewart DL, Chow KL, Masland RH. Receptive-field characteristics of lateral geniculate neurons in the rabbit. J Neurophysiol. 1971;34:139–147. doi: 10.1152/jn.1971.34.1.139. [DOI] [PubMed] [Google Scholar]
- Sun W, Li N, He S. Large-scale morphological survey of mouse retinal ganglion cells. J Comp Neurol. 2002;451:115–126. doi: 10.1002/cne.10323. [DOI] [PubMed] [Google Scholar]
- Sun W, Deng Q, Levick WR, He S. ON direction-selective cells in the mouse retina. J Physiol. 2006;576:197–202. doi: 10.1113/jphysiol.2006.115857. [DOI] [PMC free article] [PubMed] [Google Scholar]
- Vaney DI, Peichl L, Wässle H, Illing RB. Almost all ganglion cells in the rabbit retina project to the superior colliculus. Brain Res. 1981;212:447–453. doi: 10.1016/0006-8993(81)90476-5. [DOI] [PubMed] [Google Scholar]
- Vaney DI, He S, Taylor R, Levick W. Direction-selective ganglion cells in the retina. In: Zanker JM, Zeil J, editors. Motion Vision: Computational, Neural, and Ecological Constraints. Berlin: Springer; 2000. pp. 13–56. [Google Scholar]
- Wässle H. Parallel processing in the mammalian retina. Nat Rev Neurosci. 2004;5:747–757. doi: 10.1038/nrn1497. [DOI] [PubMed] [Google Scholar]
- Weng S, Sun W, He S. Identification of ON-OFF direction-selective ganglion cells in the mouse retina. J Physiol. 2005;562:915–923. doi: 10.1113/jphysiol.2004.076695. [DOI] [PMC free article] [PubMed] [Google Scholar]
- Yang G, Masland RH. Receptive fields and dendritic structure of directionally selective retinal ganglion cells. J Neurosci. 1994;14:5267–5280. doi: 10.1523/JNEUROSCI.14-09-05267.1994. [DOI] [PMC free article] [PubMed] [Google Scholar]
- Yonehara K, Ishikane H, Sakuta H, Shintani T, Nakamura-Yonehara K, Kamiji N, Usui S, Noda M, Iwaniuk A. Identification of retinal ganglion cells and their projections involved in central transmission of information about upward and downward image motion. PLoS ONE. 2009;4:e4320. doi: 10.1371/journal.pone.0004320. [DOI] [PMC free article] [PubMed] [Google Scholar]
Associated Data
This section collects any data citations, data availability statements, or supplementary materials included in this article.