

Abstract
Background
Obese women with polycystic ovary syndrome (PCOS) manifest impaired insulin-stimulated release of a d-chiro-inositol-containing inositolphosphoglycan (DCI-IPG) insulin mediator during oral glucose tolerance testing (OGTT), which appears to be restored by the administration of metformin. This suggests that either obesity or PCOS is associated with a defect in the coupling of the stimulation of the insulin receptor by insulin to the release of the DCI-IPG mediator. The objective of this study was to compare the release of bioactive DCI-IPG between normal nonobese women and obese PCOS women during stimulation with two different concentrations of insulin when glucose levels are clamped.
Methods
We performed a cross-sectional case–control study at the clinical research center of an academic medical center. A two-step euglycemic–hyperinsulinemic clamp was carried out in 8 nonobese normal and 8 obese PCOS women, during which DCI-IPG bioactivity was monitored.
Results
At baseline, PCOS women were significantly more obese, hyperinsulinemic, and insulin resistant than the controls. During the clamp studies, DCI-IPG bioactivity increased significantly over the first 45 min of the low-insulin step of the clamp in normal nonobese women (P = 0.046) and then decreased to baseline levels; DCI-IPG increased again after initiation of the high-insulin step (P = 0.029). Despite higher insulin levels during the clamp in PCOS women, DCI-IPG bioactivity remained flat throughout both insulin steps and was thus significantly lower than in controls during the initial periods of both steps.
Conclusions
The coupling between insulin action and the release of the DCI-IPG mediator is selectively impaired in obese PCOS women, which may contribute to the insulin resistance in these women.
Introduction
Polycystic ovary syndrome (PCOS) is the most common form of anovulatory infertility in the United States, affecting 6%–10% of women of reproductive age.1–3 Most women with PCOS are obese and are recognized to have hyperinsulinemic insulin resistance related both to their obesity and to a form of insulin resistance intrinsic to the syndrome. Insulin resistance places these women at increased risk for the development of cancer, hypertension, dyslipidemia, impaired glucose tolerance or type 2 diabetes, and cardiovascular disease.3,4 Furthermore, insulin resistance and/or compensatory hyperinsulinemia appear to play a key role in the pathophysiology of this disorder.3,5–8 Reduction of insulin or insulin resistance with acarbose, diazoxide, weight loss, or insulin-sensitizing drugs improves ovulatory frequency,9–11 corrects oligomenorrhea, and reduces hyperandrogenism11–17 and hirsutism18 in PCOS. However, the subcellular mechanisms underlying the insulin resistance in this disorder are unclear.
The inositol phosphoglycans (IPGs) are putative mediators in a nonclassical insulin signaling cascade for glucose uptake and use. In vitro, d-chiro-inositol (DCI)-containing IPGs (DCI-IPGs) have been shown to stimulate pyruvate dehydrogenase and activate glycogen synthase activities in muscle and adipose tissue, similar to the effects of insulin.19 DCI-containing glycosylphosphatidylinositols are bound to the extracellular matrix of cells and then cleaved by phospholipase Cγ1,20–23 after which the DCI-IPG mediator can be actively transported intracellularly.24 Insulin’s binding to the insulin receptor has been shown to stimulate IPG release from the extracellular matrix via G-protein activation of phospholipase C.25,26 In this manner, insulin’s action is coupled to DCI-IPG mediator activity.25
Insulin-resistant and hyperinsulinemic women with or without PCOS display increased urinary clearance of DCI (uClDCI) and decreased insulin-stimulated release of DCI-IPG during an oral glucose tolerance test (OGTT), as compared to control women,27,28 and the higher uClDCI correlates with insulin resistance and hyperinsulinemia.27,28 Furthermore, our group29,30 and others31 have also demonstrated that oral supplementation with DCI to women with PCOS enhances insulin sensitivity and improves clinical features of the syndrome. Collectively, these studies support the concept that depletion of circulating DCI due to increased renal clearance, or other factors, is associated with hyperinsulinemia and insulin resistance, and that supplementation with DCI can improve these anomalies in women with PCOS.
However, it is unclear whether obese women with PCOS are simply deficient in DCI and DCI-IPG or whether some women may also display defective coupling of DCI-IPG to insulin, resulting in relative inactivity of this pathway in response to insulin. This latter possibility is supported by evidence that administration of metformin to obese PCOS women enhances insulin-stimulated release of DCI-IPG during an OGTT.32 Thus, we hypothesized that obese women with PCOS are insulin resistant in part due to defective coupling between insulin action and release of the DCI-IPG mediator. To test this hypothesis, insulin secretion was suppressed by administration of diazoxide and then insulin was exogenously administered in a dose-dependent manner via a two-step euglycemic–hyperinsulinemic clamp, during which insulin-mediated release of bioactive DCI-IPG was determined both in obese PCOS women and nonobese normal women.
Materials and Methods
Subjects
We performed a cross-sectional case–control study involving obese [body mass index (BMI) >30 kg/m2] women with PCOS and nonobese (BMI <30 kg/m2) normal women between the ages of 18–40 years old. We chose nonobese normal women as the control group, because either obesity, PCOS itself, or the combination of the two factors could be responsible for the proposed coupling defect.
PCOS was defined using consensus criteria developed at the National Institute of Child Health and Human Development (NICHD) 1990 consensus conference on PCOS,33,34 which are in agreement with the 2003 Rotterdam conference’s diagnostic criteria33,34: (1) presence of oligomenorreha as defined as eight or fewer menstrual periods in the last year; and (2) presence of hyperandrogenism (acne, hirsutism, or elevated plasma-free testosterone concentration). Hyperprolactinemia, thyroid dysfunction, and late-onset adrenal hyperplasia were excluded by the appropriate tests.
Normal women had regular menstrual cycles, absence of acne and hirsutism, and normal androgen levels. None of the women took oral contraceptives or any medication known to affect insulin sensitivity for at least 3 months prior to study. Women with type 2 diabetes mellitus (T2DM) were excluded as determined by OGTT, but impaired glucose tolerance (IGT) was not an exclusion criterion because of the high prevalence of IGT in obese PCOS women. The study was approved by the institutional review board of Virginia Commonwealth University, and each woman gave written informed consent.
Study protocol
All women entered the study during the equivalent of the follicular phase of the menstrual cycle, as documented by a plasma progesterone concentration ≤6.5 nmol/L (2 ng/mL) 24 h prior to the start of the study. On day 1, the women came to the General Clinical Research Center (GCRC) after a 12-h overnight fast, where their weight, height, waist circumference, and supine blood pressure were measured and a history and physical exam were performed. Blood samples were taken at 0820 h, 0830 h, and 0845 h, and equal volumes of the plasma pooled for measurement of fasting insulin, glucose, total testosterone, and sex hormone-binding globulin (SHBG) concentrations. At 0845 h, each woman consumed 75 grams of oral glucose solution, and blood samples were drawn every 15 min for 120 min for the determination of plasma glucose and insulin. From the OGTT, the Matsuda insulin sensitivity index (ISIOGTT = square root [10,000/(glucose0 × insulin0 × mean glucose during OGTT × mean insulin during OGTT)]),35 the insulinogenic index at 15 min (IGI15 = [insulin15 − insulin0]/[glucose15 − glucose0]),36 and the disposition index (DI = ISIOGTT × IGI15) were calculated. Subjects were given instructions to self-administer diazoxide 100 mg three times daily for 5 days. Diazoxide is a drug that inhibits insulin secretion by the pancreatic β-cell and is used clinically for the treatment of hyperinsulinism due to nesidioblastosis; diazoxide is not known to directly affect insulin sensitivity.
On day 5, while patients were still taking diazoxide and after 12-h overnight fasting, patients were readmitted to the GCRC for a two-step insulin-glucose clamp study, which was conducted according to the technique described by Ferranini et al.37 using sequential insulin infusion rates of 0.4 and 1.0 mU/kg per min. Each infusion rate was continued for 3 h to establish steady-state dynamics and to ensure adequate time to measure a dose–response increase in DCI-IPG mediator activity. An intravenous catheter was placed into a forearm vein for the infusion of insulin and 20% dextrose supplemented with 20 mM postassium phosphate. Another catheter was placed in retrograde fashion into a vein of the contralateral hand, which was placed in a plexiglass box heated to 60°C to obtain arterialized venous blood samples. The total infusion time was 6 h. Blood samples were obtained every 15 min for the first 2 h of each step, and then every 30 min for the following hour of each step, for measurement of plasma insulin, glucose, and DCI-IPG mediator activity. Euglycemia was maintained by a variable infusion of glucose based on bedside plasma glucose measurements performed every 5 min, using the YSI Glucose Analyzer. Of note, it was not possible to calculate insulin-mediated glucose disposal, that is, the insulin sensitivity index derived from the clamp, because glucose infusion rates were not available in this study.
Laboratory assays
Blood samples were centrifuged immediately, and plasma was stored at −70°C until assayed. All hormones were assayed as previously described,38,39 except for plasma total testosterone, which was determined using an enzymatic immunoassay (Diagnostic Systems Laboratories Inc., Webster, TX). Blood glucose and insulin levels were determined by the core laboratory of the General Clinical Research Center of the Virginia Commonwealth University Health System. All other analytes were assayed in Dr. Nestler’s laboratory at Virginia Commonwealth University. Plasma-free testosterone was calculated by the method of Sodergard et al.40 using an albumin concentration of 40 g/L. To avoid interassay variation, all samples were analyzed in duplicate in a single assay for each hormone. The intraassay coefficient of variation for the insulin assay was 5.5%, and this value was less than 10% for all steroid hormone assays.
DCI-IP insulin mediator bioactivity assay
Blood samples were centrifuged immediately, and sera were stored at −70°C until processed. DCI-IPG mediator was isolated from plasma as previously described.32 To date, it has not been possible to measure the content of extracted DCI-IPG because its structure and exact mass are unknown, and no specific antibody suitable for an immunoassay has been developed. Therefore, DCI-IPG mediator bioactivity was determined using the specific activation of pyruvate dehydrogenase (PDH) phosphatase, as previously validated in women with PCOS and described in detail elsewhere.32 The interassay coefficient of variation of the bioassay was 17.4%. Intraassay coefficients of variation of the entire method (extraction and assay) were 10.7% and 8.5% for the absolute values of basal and peak DCI-IPG bioactivity, respectively.
To adjust for variation in basal PDH activity from one assay to the other, and therefore from subject to subject, the water-blank activity was subtracted from the bioactivity of DCI-IPG released into plasma during the clamp, which was then expressed as the percentage of its bioactivity at baseline (0 min).
Statistical analyses
Results not normally distributed were log-transformed for all statistical analyses and reported back-transformed in their original units. Normally distributed data were reported as means with standard error of the mean and log-transformed data, as geometric means with 95% confidence interval (CI). The response of glucose and insulin after the oral administration of glucose were analyzed by calculating the areas under the corresponding response curves (AUC) by the trapezoidal rules using absolute values. Results of the clamp studies were analyzed separately for baseline, and for low-dose and high-dose insulin steps. Each step was divided into three time periods: early periods (>0 to ≤45 min and >180 to ≤225 min), median periods (>45 to ≤90 min and >225 to ≤270 min), and late periods ( >90 to ≤180 min and >270 to ≤360 min). AUCs of DCI-IPG bioactivity were calculated for each time period and corrected for the duration of each period by dividing the AUC by the period’s duration. Of note, 4 subjects had too many glucose data unavailable during the clamp and were excluded from the analyses of glucose during the clamp. Similarly, 1 subject had too many insulin data unavailable during the clamp and was excluded from the analyses of insulin during the clamp. This was due to poor sample quality or assay difficulties and explains why numbers of subjects are different in Figs. 1 and 2 (below). Complete data were available for DCI-IPG.
FIG. 1.
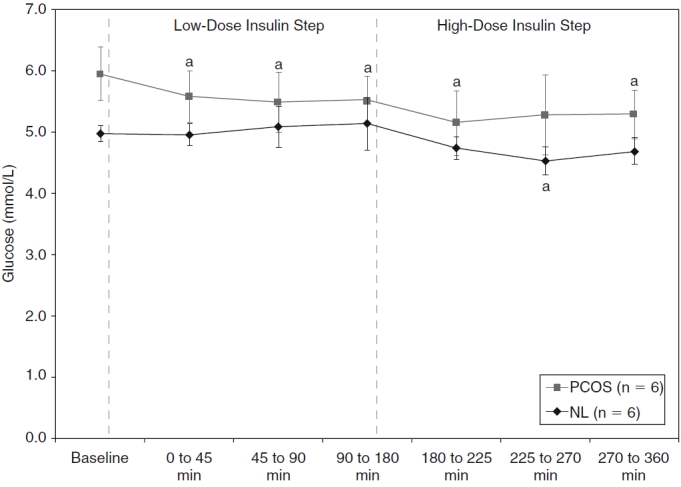
Plasma glucose levels at baseline, during fasting, and during low-dose and high-dose insulin steps for normal (NL) (♦) and polycystic ovary syndrome (PCOS) (▪) women. Of note, 2 normal and 2 PCOS women had too many unavailable glucose data and were excluded only for these analyses. Data are shown as means with standard error of the mean (SEM). aP ≤ 0.03 versus baseline within subgroup of PCOS or normal women (based on paired Student t-tests).
FIG. 2.
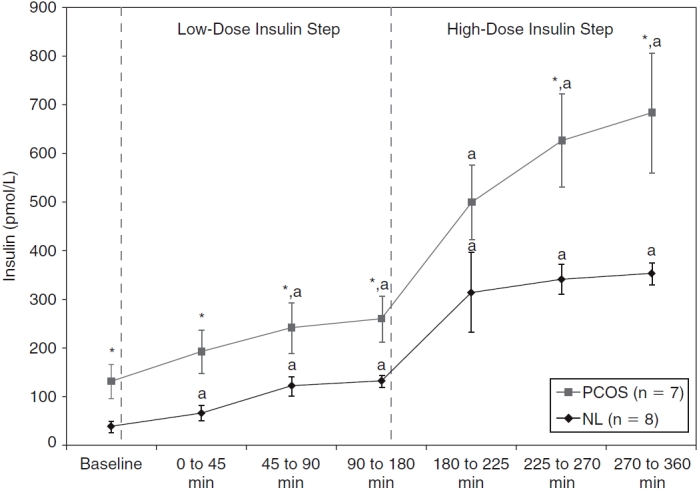
Plasma insulin levels at baseline (fasting, after 5 days of diazoxide) and during low-dose and high-dose insulin steps for normal (NL) (♦) and polycystic ovary syndrome (PCOS) (▪) women. Of note, 1 PCOS woman had too many unavailable insulin data and was excluded only for these analyses. Data are shown as means with standard error of the mean (SEM). *P < 0.04 versus normal women (based on unpaired Student t-tests). aP ≤ 0.04 versus baseline within a subgroup of PCOS or normal women (based on paired Student t-tests).
Variable comparisons between groups were made by unpaired ttests, and comparisons between baseline and each time period of the clamp within one group were performed using paired ttests. All unpaired and paired comparisons were also tested with nonparametrical Wilcoxon tests, which resulted in very similar P values and are therefore not reported. Correlation analyses were performed using Spearman nonparametric correlation tests. P values less than or equal to 0.05 were considered significant. All analyses were performed using JMP© 7.0 software (SAS Institute, Cary, NC).
Results
Initial clinical and biochemical characteristics
A total of 8 obese women with PCOS and 8 nonobese control normal women completed the study (Table 1). Women with PCOS did not differ significantly from normal control women with respect to age, systolic blood pressure (SBP), and diastolic blood pressure (DBP). By design, their BMI was significantly higher (P = 0.002). Calculated free testosterone levels were increased by 72% in obese women with PCOS as compared to control women, but this difference did not attain statistical significance (P = 0.26). However, SHBG levels were significantly lower in obese women with PCOS compared with controls (P = 0.03).
Table 1.
Clinical and Laboratory Characteristics Before Research Protocol
| Characteristics | Obese PCOS women (n = 8) | Nonobese controls (n = 8) | P valuea |
|---|---|---|---|
| Age (years) | 26.8 ± 1.5 | 25.6 ± 2.0 | 0.65 |
| BMI (kg/m2) | 36.6 ± 2.3 | 24.2 ± 2.3 | 0.002 |
| SBP (mmHg) | 123 ± 14 | 113 ± 3 | 0.36 |
| DBP (mmHg) | 68 ± 2 | 68 ± 1 | 0.81 |
| Calculated free testosterone (pmol/L)b,c | 304 [132–700] | 177 [90–350] | 0.26 |
| SHBG (nmol/L) | 14.4 ± 2.4 | 33.7 ± 7.9 | 0.03 |
| Impaired glucose tolerance (%) | 37.5% | 12.5% | 0.57d |
| Fasting glucose (mmol/L) | 4.9 ± 0.2 | 4.6 ± 0.2 | 0.32 |
| AUCglucose (mmol · min/L) | 896 ± 71 | 738 ± 41 | 0.07 |
| Fasting insulin (pmol/L)b | 112 [51–248] | 31 [20–47] | 0.003 |
| AUCinsulin (μmol · min/L)b | 101 [47–217] | 28 [20–41] | 0.002 |
| ISIOGTT (mmol−1 · L · pmol−1 · L)b | 5.0 [2.2–11.4] | 21.5 [13.8–33.4] | 0.002 |
| IGI15 (pmol · L−1 · mmol−1 · L)b | 177 [81–388] | 104 [66–162] | 0.16 |
| DI (mmol−2 · L−2) | 1,247 ± 279 | 2,510 ± 496 | 0.05 |
Mean ± SEM, except when specified otherwise.
To convert values for free testosterone to ng/dL, divide by 34.7; for SHBG to μg/dL, divide by 34.7; for glucose to mg/dL, divide by 0.0556; and for insulin to μIU/mL (mIU · min/mL for AUCinsulin), divide by 6.945.
aTwo-tailed unpaired Student t-tests, except when mentioned otherwise.
bLog-transformed for analyses and results are expressed as geometrical means with 95% confidence intervals.
cFree testosterone was calculated by the method of Sodergard et al. 40
dFisher exact test.
Abbreviations: BMI, body mass index; PCOS, polycystic ovary syndrome; SBP, systolic blood pressure; DBP, diastolic blood pressure; SHBG, sex-hormone binding globulin; ISIOGTT, Matsuda insulin sensitivity index during oral glucose tolerance test (square root [10,000/[glucose0 × insulin0 × mean glucose during OGTT × mean insulin during OGTT]]); IGI15, insulinogenic index at 15 minduring oral glucose tolerance test ([insulin15 − insulin0]/[glucose15 − glucose0]); DI, disposition index (ISIOGTT × IGI15).
Obese women with PCOS displayed inferior glucose tolerance as manifested by an increase in the proportion of IGT subjects (P = 0.32) and a higher mean AUCglucose (P = 0.07), but these trends were not significant. Insulin levels during fasting and the OGTT were both increased by more than 3.5-fold in obese women with PCOS compared to normal women (P = 0.003 and 0.002, respectively). Obese PCOS women were also characterized by a greater than 4-fold decrease in their insulin sensitivity (measured by ISIOGTT) as compared with the normal women (P = 0.002). The index of insulin secretion, IGI15, was increased by 70% in obese women with PCOS, but this was not significant (P = 0.16). Finally, the DI was significantly reduced by half in obese PCOS women (P = 0.05). This index estimates the ability of the pancreas to compensate for the degree of insulin resistance, and a lower value suggests that pancreatic β-cell function is impaired.
Glucose and insulin levels during clamp studies
After 5 days of diazoxide administration, baseline fasting glucose levels were higher in obese PCOS women as compared to nonobese normal women (P = 0.056). Thus, glucose levels were allowed to decrease slightly from baseline in the obese PCOS group so that they might match the glucose levels in the control group. As shown in Fig. 1, glucose levels were kept relatively stable and very similar in both groups throughout the two steps of the clamp studies. Accordingly, there was no significant difference in mean glucose concentrations between groups for either period. As noted in the statistical analyses section, 2 normal and 2 PCOS women were excluded from these analyses due to missing data.
Insulin levels increased significantly from baseline during both steps in both groups. As shown in Fig. 2, insulin levels were significantly higher than baseline during the median period of the low-insulin step in obese PCOS women and during the early period in normal women. However, insulin levels were significantly higher in obese women with PCOS compared with the normal women at baseline (P = 0.008) and almost throughout both insulin steps (P values <0.04, except P = 0.13 for the early period of the high-dose insulin step, based on unpaired t-tests for each period). Finally, insulin levels plateaued at the end of the low-insulin step in both groups and at the end of the high-insulin step in the normal group. As noted in the statistical analyses section, 1 PCOS woman was excluded from these analyses due to missing data.
Plasma DCI-IPG bioactivity during clamp studies
DCI-IPG bioactivity increased rapidly and significantly during the early period (P = 0.046) in normal women (Fig. 3), and then decreased progressively until it no longer differed from baseline levels. In distinct contrast, DCI-IPG bioactivity was essentially flat throughout the low-insulin step of the clamp in obese women with PCOS. Accordingly, mean DCI-IPG bioactivity was significantly higher in normal than in obese PCOS women during the first 45 min (P = 0.018) and the subsequent 45–90 min (P = 0.043) of the low-insulin step. When assessing DCI-IPG bioactivity by periods using AUCs, AUCDCI-IPG was significantly higher in normal women for the early (P = 0.019) and median (P = 0.028) periods of the low-insulin step compared with obese PCOS women (Fig. 4).
FIG. 3.
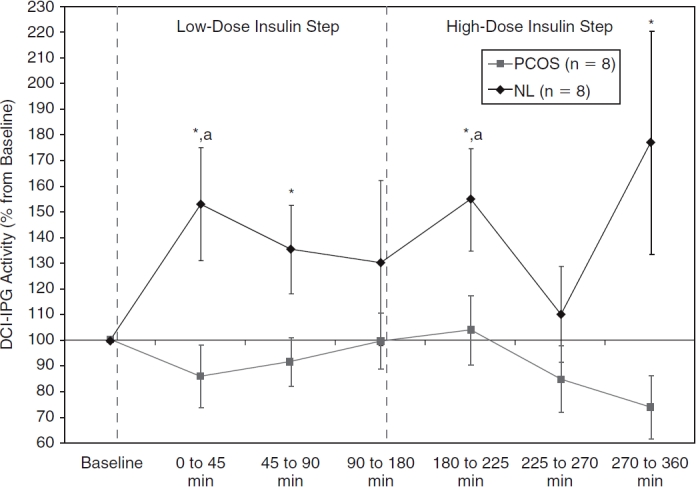
Plasma d-chiro-inositol-containing inositolphosphoglycan (DCI-IPG) bioactivity at baseline, during fasting, and during low-dose and high-dose insulin steps for normal (NL) (♦) and polycystic ovary syndrome (PCOS) (▪) women. Data are shown as means with SEM. *P ≤ 0.05 versus PCOS women (based on unpaired Student t-tests). aP < 0.05 versus baseline within subgroup of normal women (based on paired Student t-tests).
FIG. 4.
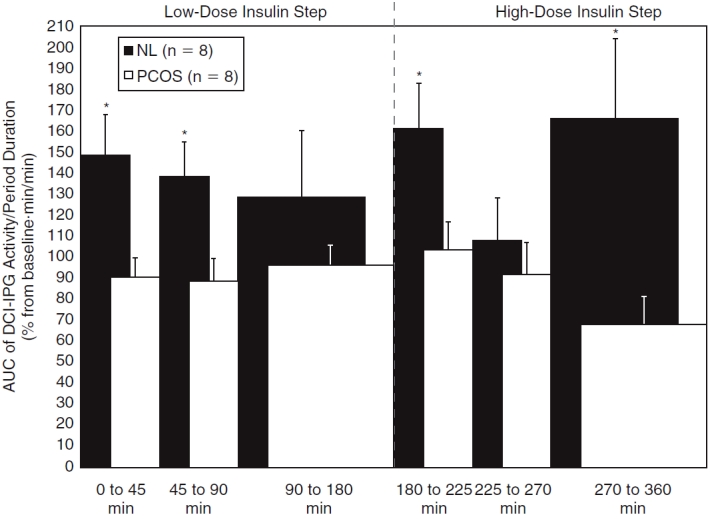
Area under the curves (AUCs) of plasma d-chiro-inositol-containing inositolphosphoglycan (DCI-IPG) bioactivity during each period of the low-dose and high-dose insulin steps for normal (NL) (□) and polycystic ovary syndrome (PCOS) (▪) women. AUCs were corrected for the duration of each period by dividing AUCs by the periods’ durations. Data are shown as means with standard error of the mean (SEM). *P ≤ 0.036 versus PCOS women (using the unpaired Student t-test).
Regarding the high-insulin step, DCI-IPG bioactivity increased again briskly after the further increase in the rate of the insulin infusion in the normal group (P = 0.029 vs. baseline), with a subsequent decrease in DCI-IPG during the median phase (Fig. 3) and very variable results during the late phase that tended to be elevated (P = 0.12 vs. baseline). Conversely, DCI-IPG bioactivity in the obese PCOS group seemed to remain flat or even decrease throughout the high-insulin step (P = 0.12 vs. baseline for the late period). Due to this divergence in the DCI-IPG bioactivity curves, DCI-IPG release was again significantly higher in normal women compared to obese PCOS women during the early (P = 0.05) and late periods (P = 0.05) of the high-insulin step of the clamp. Similarly, AUCDCIIPG for the early (P = 0.035) and late (P = 0.036) periods of the high-insulin step were increased in normal women compared to obese PCOS women (Fig. 4).
Correlation between early DCI-IPG bioactivity during the low-dose insulin step of clamp studies and other study parameters
Because the early response of insulin-stimulated DCI-IPG bioactivity differed between groups, we sought to identify the determinants of the early release of DCI-IPG. As shown in Table 2, fasting insulin levels, group status, ISIOGTT, BMI, and AUCinsulin were significantly associated with such a response. However, these factors were not independent from one another. For example, BMI was highly associated with fasting insulin (P < 0.001), ISIOGTT (P < 0.001), and AUCinsulin (P < 0.001) by Spearman correlation tests. Consequently, no more than one of these factors was independently associated with the acute DCI-IPG response to insulin. The power of the study was too small for multiple linear regression analyses, and we were unable to determine if the difference in early response of insulin-stimulated DCI-IPG bioactivity between groups was independent of BMI or not.
Table 2.
Association of Selected Variables With DCI-IPG Bioactivity During the Early Period of the Low-Insulin Step (>0 to ≤45 min)
| Characteristics | Spearman ρ | P valuea |
|---|---|---|
| Fasting insulin levels (before diazoxide administration) | –0.64 | 0.011 |
| Group status | – | 0.021 |
| ISIOGTT (mmol−1 · L · pmol−1 · L) | +0.58 | 0.023 |
| BMI | –0.56 | 0.025 |
| AUCinsulin (μmol · min/L) | –0.56 | 0.031 |
aAll tests were nonparametrical (for better comparison between them): Spearman correlation tests for continuous and Wilcoxon tests for dichotomous independent variables.
Abbreviations: DCI-IPG, d-chiro-inositol-containing inositolphosphoglycan; ISI, insulin sensitivity index; OGTT, oral glucose tolerance test; BMI, body mass index; AUC, area under the curve.
Discussion
This study shows that, when plasma glucose is maintained at stable levels and plasma insulin is acutely raised and maintained at constant levels, the circulating DCI-IPG insulin mediator is released rapidly and briefly in normal women. Indeed, DCI-IPG bioactivity measured in plasma increased significantly during the initial 45-min period of the low-dose insulin–glucose clamps, and then declined progressively during the median and late periods. Similarly, after a further increase in insulin dose, DCI-IPG bioactivity again increased during the ensuing 45 min in normal women, with a subsequent decline during the median period.
Notably and in marked contrast, this early coupling between insulin action and DCI-IPG release was entirely absent in obese women with PCOS, despite the fact that higher insulin levels were attained in the obese PCOS women than in the controls. In contrast again to the normal women, DCI-IPG bioactivity tended to decrease progressively throughout the high-insulin clamp studies, falling below baseline, suggesting an exhaustion of the ability to release DCI-IPG in obese PCOS women after approximately 4 h of continuous insulin stimulation. The release of bioactive DCI-IPG, quantified as means or AUCs, was thus significantly lower in obese PCOS women compared to controls during the early and median periods of the low-dose insulin step, as well as during the early and late periods of the high-dose insulin step of the hyperinsulinemic–euglycemic clamps. Collectively, these findings strongly suggest that the ability of insulin to induce release of the DCI-IPG mediator of insulin action is defective in women with obese PCOS, which may contribute to their insulin resistance.
Possible explanations for these findings are a deficit in intracellular DCI, the substrate for DCI-IPG, and/or a defect in incorporation of the substrate DCI with membrane phosphoglycans to generate the DCI-IPG mediator. Either scenario, alone or in combination, would result in lower levels of membrane-bound DCI-IPG mediator. Indeed, we have reported increased urinary clearance of DCI, with resultant decreased plasma DCI levels, in two populations of hyperinsulinemic women with or without PCOS.27,28 This may explain a deficit in circulating DCI substrate due to abnormal renal handling of DCI in some women.
Decreased urinary DCI excretion relative to normal controls has been reported in subjects with either impaired glucose tolerance41 or T2DM41–44 and in first-degree relatives of diabetic individuals43; this may have been related to decreased levels of circulating DCI as well. The possibility that a deficit in circulating DCI, or its precursor myo-inositol, is responsible for defective insulin-stimulated release of DCI-IPG mediator in PCOS is further supported by the findings that oral supplementation with DCI29–31 or myo-inositol45,46 to both lean and obese PCOS women improved their insulin resistance and clinical features.
We also demonstrated that release of DCI-IPG mediator is impaired in response to insulin during an OGTT in women with PCOS, along with increased urinary excretion of DCI.27,28 Similarly, Shashkin et al.47 reported that the relative increase in the bioactivity of DCI-IPG during an OGTT is abolished in obese men with T2DM as compared to healthy men. Moreover, membrane-bound DCI-IPG in muscle biopsies obtained before and after euglycemic–hyperinsulinemic clamp studies increased 6-fold in normal subjects but were undetectable in patients with T2DM.42
A deficiency in membrane-bound DCI-IPG may be due not only to decreased availability of substrate (i.e., DCI) but also to decreased activity of a cellular epimerase responsible for conversion of myo-IPG to DCI-IPG. For instance, data in type 2 diabetic GK rats suggest that such defective conversion occurs in this rodent species.48,49
Finally, defective DCI-IPG release in response to insulin could be due to a qualitative (rather than quantitative) defect in the insulin signalling mechanism that triggers DCI-IPG mediator release from the membrane. For example, there may be either a primary defect in the coupling of the insulin receptor β-subunit to the G-protein or a defect in G-protein activation of phospholipase C. Chronic hypersinsulinemia itself could be responsible for down-regulation of the cascade of DCI-IPG activation. For example, Sleight et al.50 demonstrated in normal Sprague–Dawley rat liver that DCI-IPG activity increases in a dose-dependent manner up to insulin concentrations of 0.6 nM, above which DCI-IPG mediator activity rapidly declines to baseline, noninsulin-stimulated levels. Insulin levels exceeding 0.6 nM were achieved in our study during the median and late period of the high-dose insulin step and were associated with DCI-IPG bioactivity close to baseline in normal women (at least for the median period) and below baseline in obese PCOS women.
Moreover, lower early release of bioactive DCI-IPG mediator was significantly associated with hyperinsulinemia in our study (pre-diazoxide fasting insulin levels: r = −0.64, P = 0.011). These data suggest that the chronic hyperinsulinemia found in insulin-resistant PCOS women may actually down-regulate the insulin-coupled activity along the DCI-IPG cascade.
It is important to point out that a reduced acute insulin-stimulated DCI-IPG response during the clamp was also significantly associated with insulin resistance (ISIOGTT, r = +0.58, P = 0.023) and obesity (BMI, r = −0.56, P = 0.025). This suggests that uncoupling due to insulin resistance per se, secondary to obesity and/or PCOS status, may play a direct role in this defective DCI-IPG response, and not only abnormal handling of the DCI precursor. We have shown that the administration of the insulin-sensitizer metformin to PCOS women enhances insulin-stimulated release of DCI-IPG mediator during an OGTT,32 which further supports the hypothesis that defective coupling between insulin action and DCI-IPG release may contribute to the insulin resistance of PCOS women.
Of note, the prevalence of obesity is higher in PCOS women than in non-PCOS women.51 Therefore, we purposefully chose nonobese normal women as controls to determine if a defect of coupling of insulin to DCI-IPG release exists in obese women with PCOS, because the defect could be related to either obesity and/or PCOS status. Therefore, at this time, it is not possible to determine if the observed defect in DCI-IPG release during the early phase of the clamp was due to PCOS per se, to the obesity that characterizes women with PCOS, to a combination of PCOS and obesity, or to other factors that were not assessed. Further studies, comparing women with PCOS to BMI-matched normal women, will be conducted to address this issue.
Despite interesting and significant results, there are two additional limitations to our study. First, the total number of subjects is relatively small, which is explained by the complex protocol and studies performed. Therefore, it was not possible to ascertain whether nonsignificant differences between PCOS women and controls were due to random distribution instead of true physiological differences. However, because parametrical and nonparametrical tests were performed to test a priori a specific hypothesis, it is highly unlikely that significant findings could be explained by chance. Second, because only normal and obese PCOS women were studied, inference to other insulin-resistant populations would be speculative.
In conclusion, results of the present study demonstrate that there is significant uncoupling between insulin action and the early release of bioactive DCI-IPG in obese women with PCOS as compared to nonobese normal women, under conditions where glucose is maintained stable and insulin is increased acutely. This finding suggests that defective insulin-mediated release of the DCI-IPG mediator may contribute to the insulin resistance that characterizes obese PCOS women. However, it is unknown whether this defect is due to defective insulin signalling, or to a deficit in membrane-bound DCI-IPG, or to both, and whether it is specific only to obese women with PCOS or any obese woman.
Acknowledgments
Funding for this work was provided by the National Institutes of Health (R01HD35629 and K24HD40237 to J.E.N.) and by the Fonds de Recherche en Santé du Québec (Award #3158 to J.-P.B.).
Contributor Information
Jean-Patrice Baillargeon, M.D., M.Sc., Department of Medicine, Division of Endocrinology, Université de Sherbrooke, Sherbrooke, Quebec, Canada.
Maria J. Iuorno, M.D., M.Sc., Department of Medicine, Virginia Commonwealth University, Richmond, Virginia.
Teimuraz Apridonidze, M.D., M.Sc., Department of Medicine, Virginia Commonwealth University, Richmond, Virginia.
John E. Nestler, M.D., Department of Medicine, Virginia Commonwealth University, Richmond, Virginia. Department of Obstetrics and Gynecology, Virginia Commonwealth University, Richmond, Virginia.
Author Disclosure Statement
No competing financial interests exist.
References
- 1.Allen SE, Potter HD, Azziz R. Prevalence of hyperandrogenemia among nonhirsute oligo-ovulatory women. Fertil Steril. 1997;67:569–572. doi: 10.1016/s0015-0282(97)80089-1. [DOI] [PubMed] [Google Scholar]
- 2.Knochenhauer ES, Key TJ, Kahsar-Miller M, Waggoner W, Boots LR, Azziz R. Prevalence of the polycystic ovary syndrome in unselected black and white women of the southeastern United States: A prospective study. J Clin Endocrinol Metab. 1998;83:3078–3082. doi: 10.1210/jcem.83.9.5090. [DOI] [PubMed] [Google Scholar]
- 3.Baillargeon JP, Iuorno MJ, Nestler JE. Insulin sensitizers for polycystic ovary syndrome. Clin Obstet Gynecol. 2003;46:325–340. doi: 10.1097/00003081-200306000-00011. [DOI] [PubMed] [Google Scholar]
- 4.Cattrall FR, Healy DL. Long-term metabolic, cardiovascular and neoplastic risks with polycystic ovary syndrome. Best Pract Res Clin Obstet Gynecol. 2004;18:803–812. doi: 10.1016/j.bpobgyn.2004.05.005. [DOI] [PubMed] [Google Scholar]
- 5.Baillargeon JP, Nestler JE. Polycystic Ovary Syndrome: A Syndrome of Ovarian Hypersensitivity to Insulin? J Clin Endocrinol Metab. 2006;91:22–24. doi: 10.1210/jc.2005-1804. [DOI] [PMC free article] [PubMed] [Google Scholar]
- 6.Baillargeon JP. Use of insulin sensitizers in polycystic ovarian syndrome. Curr Opin Investig Drugs. 2005;6:1012–1022. [PubMed] [Google Scholar]
- 7.Nestler JE. Role of hyperinsulinemia in the pathogenesis of the polycystic ovary syndrome, and its clinical implications. Semin Reprod Endocrinol. 1997;15:111–122. doi: 10.1055/s-2007-1016294. [DOI] [PubMed] [Google Scholar]
- 8.De Leo V, la Marca A, Petraglia F. Insulin-lowering agents in the management of polycystic ovary syndrome. Endocr Rev. 2003;24:633–667. doi: 10.1210/er.2002-0015. [DOI] [PubMed] [Google Scholar]
- 9.Moghetti P, Castello R, Negri C, Tosi F, Perrone F, Caputo M, Zanolin E, Muggeo M. Metformin effects on clinical features, endocrine and metabolic profiles, and insulin sensitivity in polycystic ovary syndrome: A randomized, double-blind, placebo-controlled 6-month trial, followed by open, long-term clinical evaluation. J Clin Endocrinol Metab. 2000;85:139–146. doi: 10.1210/jcem.85.1.6293. [DOI] [PubMed] [Google Scholar]
- 10.Nestler JE, Jakubowicz DJ, Evans WS, Pasquali R. Effects of metformin on spontaneous and clomiphene-induced ovulation in the polycystic ovary syndrome. N Engl J Med. 1998;338:1876–1880. doi: 10.1056/NEJM199806253382603. [DOI] [PubMed] [Google Scholar]
- 11.Vandermolen DT, Ratts VS, Evans WS, Stovall DW, Kauma SW, Nestler JE. Metformin increases the ovulatory rate and pregnancy rate from clomiphene citrate in patients with polycystic ovary syndrome who are resistant to clomiphene citrate alone. Fertil Steril. 2001;75:310–315. doi: 10.1016/s0015-0282(00)01675-7. [DOI] [PubMed] [Google Scholar]
- 12.Nestler JE, Jakubowicz DJ. Decreases in ovarian cytochrome P450c17β activity and serum free testosterone after reduction in insulin secretion in women with polycystic ovary syndrome. N Engl J Med. 1996;335:617–623. doi: 10.1056/NEJM199608293350902. [DOI] [PubMed] [Google Scholar]
- 13.Nestler JE, Jakubowicz DJ. Lean women with polycystic ovary syndrome respond to insulin reduction with decreases in ovarian P450c17β activity and serum androgens. J Clin Endocrinol Metab. 1997;82:4075–4079. doi: 10.1210/jcem.82.12.4431. [DOI] [PubMed] [Google Scholar]
- 14.Jakubowicz DJ, Nestler JE. 17β-Hydroxyprogesterone response to leuprolide and serum androgens in obese women with and without polycystic ovary syndrome after dietary weight loss. J Clin Endocrinol Metab. 1997;82:556–560. doi: 10.1210/jcem.82.2.3753. [DOI] [PubMed] [Google Scholar]
- 15.Nestler JE, Barlascini CO, Matt DW, Steingold KA, Plymate SR, Clore JN, Blackard WG. Suppression of serum insulin by diazoxide reduces serum testosterone levels in obese women with polycystic ovary syndrome. J Clin Endocrinol Metab. 1989;68:1027–1032. doi: 10.1210/jcem-68-6-1027. [DOI] [PubMed] [Google Scholar]
- 16.Penna IA, Canella PR, Reis RM, Silva de Sa MF, Ferriani RA. Acarbose in obese patients with polycystic ovarian syndrome: a double-blind, randomized, placebo-controlled study. Hum Reprod. 2005;20:2396–2401. doi: 10.1093/humrep/dei104. [DOI] [PubMed] [Google Scholar]
- 17.Ciotta L, Calogero AE, Farina M, De Leo V, la Marca A, Cianci A. Clinical, endocrine and metabolic effects of acarbose, an alpha-glucosidase inhibitor, in PCOS patients with increased insulin response and normal glucose tolerance. Hum Reprod. 2001;16:2066–2072. doi: 10.1093/humrep/16.10.2066. [DOI] [PubMed] [Google Scholar]
- 18.Azziz R, Ehrmann D, Legro RS, Whitcomb RW, Hanley R, Fereshetian AG, O’Keefe M, Ghazzi MN. Troglitazone improves ovulation and hirsutism in the polycystic ovary syndrome: a multicenter, double blind, placebo-controlled trial. J Clin Endocrinol Metab. 2001;86:1626–1632. doi: 10.1210/jcem.86.4.7375. [DOI] [PubMed] [Google Scholar]
- 19.Larner J, Huang LC, Schwartz CF, Oswald AS, Shen TY, Kinter M, Tang GZ, Zeller K. Rat liver insulin mediator which stimulates pyruvate dehydrogenase phosphate contains galactosamine and D-chiroinositol. Biochem Biophys Res Commun. 1988;151:1416–1426. doi: 10.1016/s0006-291x(88)80520-5. [DOI] [PubMed] [Google Scholar]
- 20.Pak Y, Huang LC, Lilley KJ, Larner J. In vivo conversion of [3H]myoinositol to [3H]chiroinoistol in rat tissues. J Biol Chem. 1992;267:16904–16910. [PubMed] [Google Scholar]
- 21.Varela I, Alvarez JF, Clemente R, Ruiz-Albusac JM, Mato JM. Asymmetric distribution of the phosphatidylinositol-linked phospho-oligosaccharide that mimics insulin action in the plasma membrane. Eur J Biochem. 1990;188:213–218. doi: 10.1111/j.1432-1033.1990.tb15392.x. [DOI] [PubMed] [Google Scholar]
- 22.Romero G, Gámez G, Huang LC, Lilley K, Luttrell L. Anti-inositolglycan antibodies selectively block some of the actions of insulin in intact BC3H1 cells. Proc Natl Acad Sci USA. 1990;87:1476–1480. doi: 10.1073/pnas.87.4.1476. [DOI] [PMC free article] [PubMed] [Google Scholar]
- 23.Macaulay SL, Larkins RG. Phospholipase C mimics insulin action on pyruvate dehydrogenase and insulin mediator generation but not glucose transport or utilization. Cell Signal. 1990;2:9–19. doi: 10.1016/0898-6568(90)90028-9. [DOI] [PubMed] [Google Scholar]
- 24.Alvarez JF, Sanchez-Arias JA, Guadano A, Estevez F, Varela I, Feliu JE, Mato JM. Transport in isolated rat hepatocytes of the phospho-oligosaccharide that mimics insulin action. Effects of adrenalectomy and glucocorticoid treatment. Biochemical J . 1991;274:369–374. doi: 10.1042/bj2740369. [DOI] [PMC free article] [PubMed] [Google Scholar]
- 25.Saltiel AR. Second messengers of insulin action. Diabetes Care. 1990;13:244–256. doi: 10.2337/diacare.13.3.244. [DOI] [PubMed] [Google Scholar]
- 26.Pak Y, Paule CR, Bao YD, Huang LC, Larner J. Insulin stimulates the biosynthesis of chiro-inositol-containing phospholipids in a rat fibroblast line expressing the human insulin receptor. Proc Natl Acad Sci USA. 1993;90:7759–7763. doi: 10.1073/pnas.90.16.7759. [DOI] [PMC free article] [PubMed] [Google Scholar]
- 27.Baillargeon J-P, Diamanti-Kandarakis E, Ostlund REJ, Apridonidze T, Iuorno MJ, Nestler JE. Altered D-chiro-inositol urinary clearance in women with polycystic ovary syndrome. Diabetes Care. 2006;29:300–305. doi: 10.2337/diacare.29.02.06.dc05-1070. [DOI] [PubMed] [Google Scholar]
- 28.Baillargeon JP, Nestler JE, Ostlund REJ, Apridonidze T, Diamanti-Kandarakis E. Greek hyperinsulinemic women with or without polycystic ovary syndrome display altered inositols metabolism. Hum Reprod. 2008;23:1439–1446. doi: 10.1093/humrep/den097. [DOI] [PMC free article] [PubMed] [Google Scholar]
- 29.Nestler JE, Jakubowicz DJ, Reamer P, Gunn RD, Allan G. Ovulatory and metabolic effects of D-chiro-inositol in the polycystic ovary syndrome. N Engl J Med. 1999;340:1314–1320. doi: 10.1056/NEJM199904293401703. [DOI] [PubMed] [Google Scholar]
- 30.Iuorno MJ, Jakubowicz DJ, Baillargeon JP, Dillon P, Gunn RD, Allan G, Nestler JE. Effects of D-chiro-inositol in lean women with the polycystic ovary syndrome. Endocr Pract. 2002;8:417–423. doi: 10.4158/EP.8.6.417. [DOI] [PubMed] [Google Scholar]
- 31.Gerli S, Mignosa M, Di Renzo GC. Effects of inositol on ovarian function and metabolic factors in women with PCOS: A randomized double blind placebo-controlled trial. Eur Rev Med Pharmacol Sci. 2003;7:151–159. [PubMed] [Google Scholar]
- 32.Baillargeon JP, Iuorno MJ, Jakubowicz DJ, Apridonidze T, He N, Nestler JE. Metformin therapy increases insulin-stimulated release of D-chiro-inositol-containing inositolphosphoglycan mediator in women with polycystic ovary syndrome. J Clin Endocrinol Metab. 2004;89:242–249. doi: 10.1210/jc.2003-030437. [DOI] [PubMed] [Google Scholar]
- 33.Zawadzki JK, Dunaif A. Diagnostic criteria for polycystic ovary syndrome: Towards a rational approach. In: Dunaif A, Givens JR, Haseltine FP, et al., editors. Current Issues in Endocrinology and Metabolism: Polycystic Ovary Syndrome. Cambridge, MA: Blackwell Scientific Publications; 1992. [Google Scholar]
- 34.The Rotterdam ESHRE/ASRM-sponsored PCOS consensus workshop group Revised 2003 consensus on diagnostic criteria and long-term health risks related to polycystic ovary syndrome (PCOS) Hum Reprod. 2004;19:41–47. doi: 10.1093/humrep/deh098. [DOI] [PubMed] [Google Scholar]
- 35.Matsuda M, DeFronzo RA. Insulin sensitivity indices obtained from oral glucose tolerance testing: comparison with the euglycemic insulin clamp. Diabetes Care. 1999;22:1462–1470. doi: 10.2337/diacare.22.9.1462. [DOI] [PubMed] [Google Scholar]
- 36.Hanson RL, Pratley RE, Bogardus C, Narayan KM, Roumain JM, Imperatore G, Fagot-Campagna A, Pettitt DJ, Bennett PH, Knowler WC. Evaluation of simple indices of insulin sensitivity and insulin secretion for use in epidemiologic studies. Am J Epidemiol. 2000;151:190–198. doi: 10.1093/oxfordjournals.aje.a010187. [DOI] [PubMed] [Google Scholar]
- 37.DeFronzo RA, Ferrannini E. Insulin resistance. A multifaceted syndrome responsible for NIDDM, obesity, hypertension, dyslipidemia, and atherosclerotic cardiovascular disease. Diabetes Care. 1991;14:173–194. doi: 10.2337/diacare.14.3.173. [DOI] [PubMed] [Google Scholar]
- 38.Nestler JE, Powers LP, Matt DW, Steingold KA, Plymate SR, Rittmaster RS, Clore JN, Blackard WG. A direct effect of hyperinsulinemia on serum sex hormone-binding globulin levels in obese women with the polycystic ovary syndrome. J Clin Endocrinol Metab. 1991;72:83–89. doi: 10.1210/jcem-72-1-83. [DOI] [PubMed] [Google Scholar]
- 39.Nestler JE, Beer NA, Jakubowicz DJ, Beer RM. Effects of a reduction in circulating insulin by metformin on serum dehydroepiandrosterone sulfate in nondiabetic men. J Clin Endocrinol Metab. 1994;78:549–554. doi: 10.1210/jcem.78.3.8126125. [DOI] [PubMed] [Google Scholar]
- 40.Sodergard R, Backstrom T, Shanbhag V, Carstensen H. Calculation of free and bound fractions of testosterone and estradiol-17 beta to human plasma proteins at body temperature. J Steroid Biochem. 1982;16:801–810. doi: 10.1016/0022-4731(82)90038-3. [DOI] [PubMed] [Google Scholar]
- 41.Suzuki S, Kawasaki H, Satoh Y, Ohtomo M, Hirai M, Hirai A, Hirai S, Onoda M, Marsumoto M, Hinokio Y. Urinary chiro-inositol excretion is an index marker of insulin sensitivity in Japanese type II diabetes. Diabetes Care. 1994;17:1465–1468. doi: 10.2337/diacare.17.12.1465. [DOI] [PubMed] [Google Scholar]
- 42.Kennington AS, Hill CR, Craig J, Bogardus C, Raz I, Ortmeyer HK, Hansen BC, Romero G, Larner J. Low urinary chiro-inositol excretion in non-insulin-dependent diabetes mellitus. N Engl J Med. 1990;323:373–378. doi: 10.1056/NEJM199008093230603. [DOI] [PubMed] [Google Scholar]
- 43.Craig JW, Larner J, Asplin CM. Chiro-inositol deficiency and insulin resistance. In: Draznin B, LeRoith D, editors. Molecular Biology of Diabetes II. Totowa, NJ: Humana Press; 1998. pp. 343–362. [Google Scholar]
- 44.Ostlund REJ, McGill JB, Herskowitz I, Kipnis DM, Santiago JV, Sherman WR. D-chiro-inositol metabolism in diabetes mellitus. Proc Natl Acad Sci USA. 1993;90:9988–9992. doi: 10.1073/pnas.90.21.9988. [DOI] [PMC free article] [PubMed] [Google Scholar]
- 45.Papaleo E, Unfer V, Baillargeon JP, Fusi F, Occhi F, De Santis L. Myo-inositol may improve oocyte quality in intracytoplasmic sperm injection cycles. A prospective, controlled, randomized trial. Fertil Steril. 2009;91:1750–1754. doi: 10.1016/j.fertnstert.2008.01.088. [DOI] [PubMed] [Google Scholar]
- 46.Papaleo E, Unfer V, Baillargeon JP, De Santis L, Fusi F, Brigante C, Marelli G, Cino I, Redaelli A, Ferrari A. Myo-inositol in patients with polycystic ovary syndrome: A novel method for ovulation induction. Gynecol Endocrinol. 2007;23:700–703. doi: 10.1080/09513590701672405. [DOI] [PubMed] [Google Scholar]
- 47.Shashkin PN, Shashkina EF, Fernqvist-Forbes E, Zhou YP, Grill V, Katz A. Insulin mediators in man: effects of glucose ingestion and insulin resistance. Diabetologia. 1997;40:557–563. doi: 10.1007/s001250050715. [DOI] [PubMed] [Google Scholar]
- 48.Pak Y, Hong Y, Kim S, Piccariello T, Farese RV, Larner J. In vivo chiro-inositol metabolism in the rat: A defect in chiro-inositol synthesis from myo-inositol and an increased incorporation of chiro-[3H]inositol into phospholipid in the Goto-Kakizaki (G.K) rat. Mol Cells. 1998;8:301–309. [PubMed] [Google Scholar]
- 49.Sun TH, Heimark DB, Nguygen T, Nadler JL, Larner J. Both myo-inositol to chiro-inositol epimerase activities and chiro-inositol to myo-inositol ratios are decreased in tissues of GK type 2 diabetic rats compared to Wistar controls. Biochem Biophys Res Commun. 2002;293:1092–1098. doi: 10.1016/S0006-291X(02)00313-3. [DOI] [PubMed] [Google Scholar]
- 50.Sleight S, Wilson BA, Heimark DB, Larner J. G(q/11) is involved in insulin-stimulated inositol phosphoglycan putative mediator generation in rat liver membranes: Co-localization of G(q/11) with the insulin receptor in membrane vesicles. Biochem Biophys Res Commun. 2002;295:561–569. doi: 10.1016/s0006-291x(02)00701-5. [DOI] [PubMed] [Google Scholar]
- 51.Essah PA, Nestler JE. The metabolic syndrome in polycystic ovary syndrome. J Endocrinol Invest. 2006;29:270–280. doi: 10.1007/BF03345554. [DOI] [PubMed] [Google Scholar]