

Abstract
J Clin Hypertens (Greenwich). 2011;13:479–486.©2011 Wiley Periodicals, Inc.
The authors analyzed data on 9950 participants taking antihypertensive medications in the nationwide Reasons for Geographic and Racial Differences in Stroke (REGARDS) study to determine the association between medication adherence and incident stroke symptoms. Medication adherence was assessed using a validated 4‐item self‐report scale and participants were categorized into 4 groups (scores of 0, 1, 2, and 3 or 4, with higher scores indicating worse adherence). The incidence of 6 stroke symptoms (sudden weakness on one side of the body, numbness, painless loss of vision in one or both eyes, loss of half vision, losing the ability to understand people, and losing the ability to express oneself verbally or in writing) was assessed via telephone interviews every 6 months. During a median of 4 years, the incidence of any stroke symptom was 14.6%, 17.9%, 20.2%, and 24.9% among participants with adherence scores of 0, 1, 2, and 3 or 4, respectively (P<.001). The multivariable adjusted hazard ratio (95% confidence interval) for any stroke symptom associated with adherence scores of 1, 2, and 3 or 4, vs 0, was 1.20 (1.04–1.39), 1.23 (0.94–1.60), and 1.59 (1.08–2.33), respectively (P<.001). Worse adherence was also associated with higher multivariable adjusted hazard ratios for each of the 6 stroke symptoms.
Population‐based studies indicate that stroke symptoms are common among individuals without a prior medical diagnosis of stroke or transient ischemic attack (TIA). 1 , 2 Stroke symptoms may indicate a minor stroke and are associated with worse quality of life and an increased risk for future stroke events. 3 , 4 , 5 However, few data are available on the risk factors for stroke symptoms.
Hypertension is one of the most important risk factors for stroke, and antihypertensive medications are often required to achieve blood pressure (BP) control. 6 , 7 However, low adherence to antihypertensive medications is a common problem. 8 , 9 , 10 In prior studies, the prevalence of low antihypertensive medication adherence has frequently exceeded 20% 11 , 12 , 13 and low adherence to antihypertensive therapies has consistently been found to be associated with uncontrolled hypertension. 12 , 14 , 15 , 16 , 17 For example, in a study of 1367 patients by Morisky and colleagues, 12 43.3%, 54.5%, and 67.2% of individuals with high, medium, and low adherence, assessed via a self‐report scale, had uncontrolled hypertension. Beyond hypertension control, few data are available on health outcomes associated with low antihypertensive medication adherence.
The goal of the present analysis was to assess whether individuals with low medication adherence have a higher risk for developing stroke symptoms. To do so, we analyzed data on participants taking antihypertensive medication from the population‐based Reasons for Geographic and Racial Differences in Stroke (REGARDS) study. Specifically, we determined the incidence of new stroke symptoms during a median of 4 years of follow‐up associated with level of medication adherence among individuals without stroke, TIA, or stroke symptoms at baseline.
Materials and Methods
The REGARDS study is a nationwide prospective cohort study among US adults aged 45 years and older. 18 The study was designed to oversample African Americans and to provide approximate equal representation of men and women. Overall, 30,239 African American and white US adults were enrolled between January 2003 and October 2007. The current analysis was limited to participants with hypertension who were taking antihypertensive medication, confirmed via self‐report and pill bottle review, and had no prior history of stroke, TIA, or stroke symptoms at baseline. Individuals without complete medication adherence and follow‐up data were also excluded. Of the participants taking antihypertensive medications (n=14,692), 2222 reported a history of stroke or TIA at baseline, 2054 reported a history of stroke symptoms at baseline, 243 had missing items on the adherence screener, and 223 had no follow‐up data, leaving 9950 participants for analysis.
Data Collection
Sociodemographic and clinical data were collected at baseline through a telephone interview, a self‐administered questionnaire, and an in‐home examination. Trained interviewers conducted computer‐assisted telephone interviews to obtain information on participants’ demographics, current cigarette smoking and alcohol consumption, self‐rated health, annual household income, education, symptoms of depression, cognitive impairment, and self‐reports of prior physician‐diagnosed major comorbid conditions (eg, diabetes, hypertension, stroke, TIA, atrial fibrillation, and myocardial infarction). Symptoms of depression were defined as being present for participants with scores ≥4 on the 4‐item Centers for Epidemiologic Studies of Depression scale. 19 Cognitive impairment was assessed using a 6‐item test of global cognitive function that includes recall and temporal orientation items. 20
Trained and certified health professionals conducted in‐home study visits that included the review of medication pill bottles, a physical examination, electrocardiography, and the collection of blood and urine samples. Participants were asked to provide the bottles for all medications they had taken in the past 2 weeks, and medication names were recorded and subsequently coded into drug classes. Antihypertensive medication classes were defined using those listed in the Seventh Report of the Joint National Committee on Prevention, Detection, Evaluation, and Treatment of High Blood Pressure (JNC 7). 21 BP was measured two times using aneroid sphygmomanometers following a standardized protocol. A history of coronary artery disease was defined as a self‐report of myocardial infarction, percutaneous coronary intervention, coronary artery bypass graft, or evidence of a myocardial infarction on the study electrocardiogram collected during the in‐home examination. Body mass index (BMI) was calculated as weight in kilograms divided by height in meters squared. Diabetes was defined as a serum glucose ≥126 mg/dL for participants who had fasted ≥8 hours prior to their blood draw, serum glucose ≥200 mg/dL for those who had not fasted, or self‐report of a prior diagnosis of diabetes and current use of insulin or oral hypoglycemic medications. Dyslipidemia was defined as serum total cholesterol ≥240 mg/dL, low‐density lipoprotein cholesterol ≥160 mg/dL or high‐density lipoprotein cholesterol <40 mg/dL, or a self‐reported prior diagnosis of high cholesterol and current use of cholesterol‐lowering medications. Using isotope‐dilution mass spectrometry (IDMS)–traceable serum creatinine, estimated glomerular filtration rate (eGFR) was calculated using the Chronic Kidney Disease Epidemiology Collaboration (CKD‐EPI) equation. 22 Albuminuria was calculated as the ratio of urinary albumin to urinary creatinine, which were collected via a random spot urine collection. C‐reactive protein was measured using a high‐sensitivity, particle‐enhanced immunonepholometric assay.
Adherence Scale
Medication adherence was assessed using a validated 4‐item scale. 23 In a prior study, this scale was reported to have acceptable internal consistency (Cronbach’s α=0.61), the items maintained a high item‐to‐total correlation (>0.4 for each item), and scores were correlated with BP control. 23 The 4 items have response options of “no” or “yes” and are listed in the Appendix. One point was assigned to each “yes” response, the points were summed, and medication adherence was grouped into 4 levels: scores of 0, 1, 2, and 3 or 4, with a higher score indicating worse adherence. 24 Scores of 3 and 4 were pooled together for analysis due to a low number of participants in these groups.
Outcomes
Incident stroke symptoms were ascertained during biannual follow‐up telephone interviews. Using the Questionnaire for Verifying Stroke‐Free Status (QVSFS), participants were asked about the sudden onset of each of 6 stroke symptoms (Appendix). 25 The QVSFS is a validated questionnaire proposed as a quick screening instrument for identification of stroke‐free individuals in the general population. 26 , 27 Incident stroke symptoms included follow‐up through March 2010. At the time of this analysis, participants had completed up to 14 follow‐up interviews (median=7 follow‐up interviews).
The REGARDS protocol was approved by the institutional review boards governing research in human subjects at the participating centers and all participants provided informed consent.
Statistical Analysis
Participant characteristics were calculated by adherence scale scores (0, 1, 2, and 3 or 4) as means for continuous variables and proportions for categoric variables. The statistical significance of trends across adherence scale scores was determined using least squares and maximum likelihood, as appropriate. The percent of participants developing each stroke symptom, any stroke symptom, and the total number of stroke symptoms was calculated by adherence scale score. The hazard ratio for developing each, as well as any, stroke symptom during follow‐up was calculated for adherence scale scores of 1, 2, and 3 or 4, with participants having scores of 0 (indicating the highest level of adherence) serving as the reference group. Initial regression models included adjustment for age, race, sex, and region of residence (stroke belt, stroke buckle, or other region) with subsequent models including additional adjustment for education, household income, current smoking, alcohol consumption, physical activity, self‐rated health, cognitive impairment, symptoms of depression, BMI, systolic BP, health insurance, number of antihypertensive medication drug classes, total number of prescription and nonprescription drugs being taken, dyslipidemia, diabetes, atrial fibrillation, coronary artery disease, log‐transformed C‐reactive protein, eGFR, and log‐transformed albuminuria. Since the exact date a participant developed stroke symptoms was not known (ie, stroke symptoms were assessed at 6‐month intervals), we used interval‐censored regression models to calculate hazard ratios. 28 , 29 Participants who died were right‐censored on their date of death. Those who did not develop stroke symptoms were right‐censored on the date of their last REGARDS follow‐up interview, and those developing a stroke symptom were left‐ or interval‐censored. Linear trends across level of medication adherence were assessed using adherence scale scores as a continuous variable in the regression models. In a secondary analysis, the incidence and hazard ratios for developing any stroke symptoms associated with level of medication adherence was calculated for whites and African Americans separately. Differences in the association between medication adherence and incident stroke symptoms by race was evaluated by including an interaction term in the multivariable‐adjusted regression model. All analyses were performed using SAS version 9.2 (SAS Institute, Cary, NC).
Results
The mean age of the REGARDS study sample who were taking antihypertensive medication and were included in the current analysis was 66.0 (standard deviation, 8.8) years, 57.2% were women, and 48.1% were African American. Also, 70.1% had adherence scores of 0 (best adherence) and 23.1%, 5.0%, and 1.9% had scores of 1, 2, and 3 or 4 (worst adherence), respectively. Those with worse medication adherence at baseline were more likely to be younger, African American, female, and reside outside the stroke belt region of the United States (Table I). Additionally, lower income, lack of health insurance, being physically inactive, current smoking, symptoms of depression, and worse self‐rated health were associated with worse medication adherence. Cognitive impairment was more common among participants with the best and worst levels of adherence. Levels of BMI, systolic and diastolic BP levels, C‐reactive protein, eGFR, and albuminuria were higher among individuals with worse adherence.
Table I.
Characteristics of REGARDS Study Participants With Hypertension Taking Antihypertensive Medication by Level of Adherence
| Adherence Score | |||||
|---|---|---|---|---|---|
| 0 (Best Adherence) (n=6969) | 1 (n=2301) | 2 (n=495) | 3 or 4 (Worst Adherence) (n=185) | P Value | |
| Age, y | 66.4 (8.8) | 65.2 (8.8) | 63.8 (8.8) | 64.7 (9.7) | <.001 |
| African American, % | 47.5 | 45.7 | 60.8 | 67.0 | <.001 |
| Women, % | 56.6 | 56.6 | 64.4 | 66.5 | <.001 |
| Region, % | |||||
| Non‐belt | 42.7 | 42.8 | 45.7 | 55.1 | ref |
| Stroke belt | 35.4 | 36.4 | 37.4 | 33.0 | .321 |
| Stroke buckle | 21.9 | 20.8 | 17.0 | 11.9 | <.001 |
| High school education, % | 86.8 | 88.0 | 83.2 | 83.8 | .245 |
| Income | |||||
| <$20,000 | 20.6 | 19.0 | 27.9 | 33.3 | ref |
| $20,000–$34,999 | 28.7 | 30.5 | 28.2 | 30.8 | .092 |
| $35,000–$74,999 | 34.7 | 35.4 | 33.1 | 25.2 | .003 |
| ≥$75,000 | 16.0 | 15.1 | 10.8 | 10.7 | <.001 |
| Health insurance, % | 95.0 | 94.1 | 91.7 | 93.5 | .003 |
| Inactive, % | 35.6 | 38.0 | 40.0 | 48.9 | <.001 |
| Current smoking, % | 12.0 | 12.8 | 17.6 | 13.5 | .004 |
| Alcohol consumptiona, % | |||||
| None | 64.4 | 64.1 | 67.2 | 64.0 | Reference |
| Moderate | 31.9 | 31.2 | 28.5 | 34.8 | .524 |
| Heavy | 3.7 | 4.7 | 4.3 | 1.1 | .624 |
| Symptoms of depression, % | 8.7 | 11.1 | 17.1 | 16.9 | <.001 |
| Cognitive impairment, % | 8.1 | 6.4 | 5.1 | 9.5 | .040 |
| Self‐rated health, % | |||||
| Excellent | 11.0 | 8.6 | 6.5 | 5.4 | Reference |
| Very good | 30.2 | 27.2 | 22.0 | 22.8 | .031 |
| Good | 39.9 | 44.4 | 41.5 | 42.4 | <.001 |
| Fair | 16.5 | 17.2 | 24.0 | 21.2 | <.001 |
| Poor | 2.6 | 2.7 | 6.1 | 8.2 | <.001 |
| Body mass index, kg/m2 | 30.5 (6.4) | 31.2 (6.3) | 31.2 (6.5) | 32.0 (6.6) | <.001 |
| SBP, mm Hg | 130.4 (15.9) | 131.5 (17.1) | 132.8 (18.0) | 136.3 (17.9) | <.001 |
| DBP, mm Hg | 77.4 (9.4) | 77.8 (10.1) | 79.7 (10.7) | 82.5 (11.5) | <.001 |
| Number of antihypertensive medication classes | 1.95 (0.90) | 1.94 (0.91) | 1.90 (0.88) | 1.92 (0.92) | .256 |
| Number of pills consumedb | 6.8 (3.8) | 7.1 (3.9) | 6.9 (3.9) | 6.6 (3.8) | .263 |
| Diabetes, % | 27.7 | 28.9 | 30.7 | 29.7 | .092 |
| High cholesterol, % | 63.7 | 65.9 | 61.8 | 65.2 | .487 |
| Atrial fibrillation, % | 8.7 | 8.3 | 8.4 | 11.5 | .734 |
| History of CAD,c% | 24.9 | 25.4 | 23.7 | 32.2 | .255 |
| C‐reactive protein, mg/L | 2.5 (1.1–5.8) | 2.7 (1.2–6.0) | 3.5 (1.4–6.8) | 2.7 (1.2–5.6) | .004 |
| eGFR, mL/min/1.73 m2 | 81.7 (21.3) | 82.6 (21.2) | 84.0 (22.4) | 85.1 (25.1) | .001 |
| Albuminuria, mg/g | 8.1 (5.0–18.6) | 8.3 (5.1–20.0) | 9.9 (5.8–24.9) | 10.0 (5.7–26.8) | <.001 |
Abbreviations: CAD, coronary artery disease; DBP, diastolic blood pressure; eGFR, estimated glomerular filtration rate; SBP, systolic blood pressure. Values are expressed as mean (standard deviation) or percentage except C‐reactive protein and albuminuria, which are median (25–75 percentiles). Adherence scores are based on the 4‐item Morisky Medication Adherence Scale. aModerate and heavy alcohol consumption were defined using National Institute on Alcohol Abuse and Alcoholism guidelines as some but <7 drinks a week for women (14 for men) and ≥7 (14 for men), respectively. bIncludes prescription medications, nonprescription medications, vitamins, and supplements for hypertension and conditions other than hypertension. cIncludes history of myocardial infarction, evidence of a myocardial infarction on the Reasons for Geographic and Racial Differences in Stroke (REGARDS) study baseline electrocardiogram, coronary artery revascularization, or coronary artery bypass surgery.
During a median of 4 years of follow‐up (maximum follow‐up, 7 years), 16.6% of the study sample developed stroke symptoms. The incidence of any stroke symptom was 14.6%, 17.9%, 20.2%, and 24.9% among participants with adherence scores of 0, 1, 2, and 3 or 4, respectively (P<.001). The incidence of each stroke symptom was higher among individuals with worse adherence (Figure 1; P<.001 each). Additionally, the incidence of multiple stroke symptoms was more common among individuals with worse adherence (Figure 2). For example, the incidence of ≥3 stroke symptoms was 1.9%, 1.9%, 3.6%, and 7.0% among individuals with medication adherence scores of 0, 1, 2, and 3 or 4, respectively.
Figure 1.
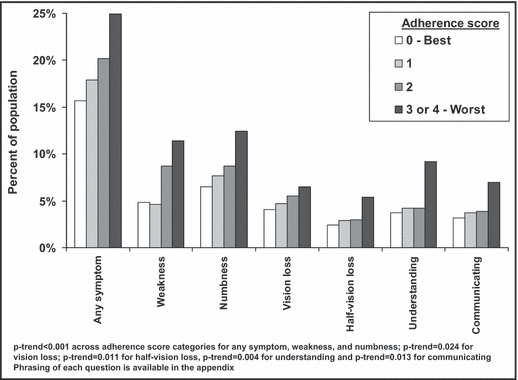
Percent of Reasons for Geographic and Racial Differences in Stroke (REGARDS) study participants developing incident stroke symptoms during a median follow‐up of 4 years by level of medication adherence.
Figure 2.
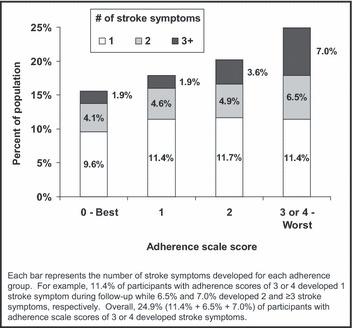
Number of incident stroke symptoms among Reasons for Geographic and Racial Differences in Stroke (REGARDS) study participants occurring during a median follow‐up of 4 years by level of medication adherence.
After adjustment for age, race, sex, and region of residence and compared with their peers with an adherence scale score of 0 (best adherence), the hazard ratios for any stroke symptom were 1.29 (95% confidence interval [CI], 1.11–1.50), 1.53 (95% CI, 1.16–2.01), and 2.05 (95% CI, 1.39–3.04) among individuals with adherence scale scores of 1, 2, and 3 or 4 (worst adherence), respectively (Table II). Graded associations were present between worse adherence and higher hazard ratios for each individual stroke symptom. The association of lower adherence with a higher hazard ratio for any stroke symptoms, as well as each stroke symptom except sudden painless loss of vision in one or both eyes (P=.056 after multivariable adjustment), was attenuated but remained statistically significant after multivariable adjustment.
Table II.
Age, Race, Sex, Region and Multivariable‐Adjusted Hazard Ratios for Stroke Symptoms Associated With Medication Adherence Among REGARDS Study Participants With Hypertension Taking Antihypertensive Medication
| Adherence Score | P Value | ||||
|---|---|---|---|---|---|
| 0 (Best Adherence) (n=6969) | 1 (n=2301) | 2 (n=495) | 3 or 4 (Worst Adherence) (n=185) | ||
| Any symptom | |||||
| Age‐, race‐, sex‐, region‐adjusted | 1 (reference) | 1.29 (1.11–1.50) | 1.53 (1.16–2.01) | 2.05 (1.39–3.04) | <.001 |
| Multivariable‐adjusted | 1 (reference) | 1.20 (1.04–1.39) | 1.23 (0.95–1.61) | 1.57 (1.07–2.30) | <.001 |
| Sudden weakness | |||||
| Age‐, race‐, sex‐, region‐adjusted | 1 (reference) | 0.98 (0.73–1.31) | 2.20 (1.43–3.39) | 2.97 (1.62–5.46) | <.001 |
| Multivariable‐adjusted | 1 (reference) | 0.92 (0.69–1.23) | 1.72 (1.13–2.62) | 2.04 (1.13–3.67) | .008 |
| Sudden numbness | |||||
| Age‐, race‐, sex‐, region‐adjusted | 1 (reference) | 1.31 (1.01–1.69) | 1.43 (0.90–2.29) | 2.47 (1.29–4.72) | .001 |
| Multivariable‐adjusted | 1 (reference) | 1.22 (0.94–1.57) | 1.06 (0.69–1.69) | 1.81 (0.97–3.36) | .037 |
| Sudden painless loss of vision in one or both eyes | |||||
| Age‐, race‐, sex‐, region‐adjusted | 1 (reference) | 1.22 (0.97–1.55) | 1.52 (0.99–2.33) | 1.72 (0.92–3.20) | .006 |
| Multivariable‐adjusted | 1 (reference) | 1.16 (0.92–1.47) | 1.29 (0.85–1.95) | 1.33 (0.72–2.45) | .056 |
| Sudden loss of half vision | |||||
| Age‐, race‐, sex‐, region‐adjusted | 1 (reference) | 1.31 (0.96–1.79) | 1.42 (0.79–2.55) | 2.56 (1.26–5.18) | .004 |
| Multivariable‐adjusted | 1 (reference) | 1.28 (0.94–1.76) | 1.20 (0.68–2.11) | 1.92 (0.95–3.88) | .038 |
| Suddenly lost ability to understand people | |||||
| Age, race, sex, region adjusted | 1 (reference) | 1.24 (0.98–1.56) | 1.36 (0.87–2.13) | 2.86 (1.72–4.76) | <.001 |
| Multivariable‐adjusted | 1 (reference) | 1.22 (0.97–1.55) | 1.06 (0.69–1.63) | 2.06 (1.26–3.36) | .009 |
| Suddenly lost ability to express self verbally or in writing | |||||
| Age‐, race‐, sex‐, region‐adjusted | 1 (reference) | 1.26 (0.96–1.66) | 1.39 (0.82–2.36) | 2.52 (1.34–4.75) | .003 |
| Multivariable‐adjusted | 1 (reference) | 1.23 (0.93–1.61) | 1.17 (0.70–1.95) | 1.84 (1.00–3.38) | .033 |
Abbreviation: REGARDS, Reasons for Geographic and Racial Differences in Stroke. Multivariable adjustment includes age, race, sex, region of residence, high school education, current smoking, alcohol consumption (none, moderate, or heavy), household income (<$20,000, $20,000–$34,999, $35,000–$74,999, ≥$75,000), symptoms of depression, body mass index, systolic blood pressure, number of antihypertensive classes (1, 2, 3, or ≥4), diabetes, high cholesterol, history of coronary artery disease, C‐reactive protein (log‐transformed), estimated glomerular filtration rate, albuminuria (log‐transformed).
Race‐Stratified Associations
During follow‐up, 14.2% of whites and 19.3% of African Americans developed stroke symptoms. The cumulative incidence of stroke symptoms associated with medication adherence scores of 0, 1, 2, and 3 or 4 was 13.5%, 15.5%, 16.0%, and 23.0%, respectively, among whites and 18.2%, 20.7%, 22.9%, and 25.8%, respectively, among African Americans (each P<.001). After multivariable adjustment for age, sex, region of residence, high school education, current smoking, alcohol consumption, household income, symptoms of depression, BMI, systolic BP, number of antihypertensive classes, diabetes, high cholesterol, history of coronary artery disease, C‐reactive protein, eGFR, albuminuria, the hazard ratio for developing any stroke symptoms associated with medication adherence scores of 1, 2, and 3 or 4, vs 0, was 1.20 (95% CI, 0.99–1.46), 1.32 (95% CI, 0.86–2.04), and 1.90 (95% CI, 1.00–3.62), respectively (P=.014) among whites. The analogous multivariable‐adjusted hazard ratios for incident stroke symptoms were 1.21 (95% CI, 0.98–1.51), 1.31 (95% CI, 0.93–1.85), and 1.55 (95% CI, 0.95–2.53) among African Americans (P=.017). Test for statistical interaction between medication adherence and stroke symptoms by race was not significant (P=.692).
Discussion
Few studies have investigated risk factors for incident stroke symptoms. In the current study of individuals with hypertension, a graded association was present between worse medication adherence and a higher risk for developing new stroke symptoms. Among individuals with the worst level of adherence, 24.9% developed stroke symptoms during the 4‐year follow‐up period. The relationship between worse adherence and increased stroke symptoms was not explained by potential confounding variables including sociodemographic factors, comorbid conditions, number of antihypertensive medication classes being taken, and systolic BP. Additionally, worse levels of medication adherence were associated with increased hazard ratios for each of the 6 stroke symptoms studied except sudden painless loss of vision in one or both eyes.
Stroke symptoms in the absence of a diagnosis of stroke or TIA may reflect the occurrence of a cerebral infarction that has not come to clinical attention. 30 Importantly, stroke symptoms are associated with an increased risk for clinically diagnosed stroke in the future. 3 , 4 For example, among 1077 participants in the Rotterdam Scan Study, the presence of silent brain infarcts was associated with a multivariable‐adjusted hazard ratio of 3.9 (95% CI, 2.3–6.8) for subsequent clinically recognized stroke. 5
Brain imaging to assess silent strokes was not available in the REGARDS study. However, questionnaires are more feasible in large population‐based epidemiologic studies. High sensitivity (sensitivity >80%) but only moderate specificity (specificity of 60–70%) have been reported for the questionnaire we used to identify stroke symptoms. 25 , 26 , 27 The positive and negative predictive values of this scale have been reported to be 71% and 96%, respectively. 26
About 4 million US adults have a history of clinically diagnosed strokes. 31 However, there may be as many as 10 million adults with prevalent “whispering” subclinical strokes in the United States. 2 Additionally, the prevalence of stroke symptoms without a clinical stroke diagnosis was 18% among white and African American US adults aged 45 years and older at the baseline REGARDS study visit. 1 Given the high burden of stroke symptoms among US adults, many of which are not recognized as stroke but may well represent small ischemic strokes, there may be a tremendous benefit in identifying modifiable risk factors for stroke symptoms.
Low adherence to medication is a well‐recognized barrier to controlling hypertension. 8 , 16 , 32 , 33 , 34 Despite the availability of effective antihypertensive medications, only 69% of US adults who report taking such treatment have their BP controlled to recommended targets. 35 In prior studies, antihypertensive medication adherence rates have differed widely depending on the population, but generally exceed 20%. 36 Consistent with prior studies, 27% of REGARDS study participants reported at least one inappropriate medication‐taking behavior at baseline. 14
Few studies are available on the relationship between low antihypertensive medication adherence and the incidence of cardiovascular disease and mortality. A meta‐analysis on medication adherence and mortality published in 2006 found no observational cohort studies reporting this association for antihypertensive medication adherence. 37 A case‐control study using pharmacy fill databases published in 2009 found patients who filled ≥80% of their antihypertensive medications had a 22% lower risk of stroke. 38 In 2010, an association between worse antihypertensive medication adherence, assessed via pharmacy fill persistency, and higher stroke and all‐cause mortality was reported among Medicaid recipients in Tennessee. 39 While pharmacy fill data provide an objective measure of access to pills in order to achieve high adherence, it is unknown whether patients filling their medications were actually taking them as prescribed. 40 The current study provides data on self‐reported adherence to antihypertensive medication. Self‐report scales, like the one used in the current study, are relatively simple and economically feasible and also have the advantage of soliciting information regarding situational factors, which act as barriers to medication adherence.
Limitations and Strengths
The current analysis should be interpreted within the context of several limitations. To date, too few stroke events have occurred in the REGARDS study to provide adequate statistical power for analyzing medication adherence and stroke outcomes among participants taking antihypertensive medication. The adherence scale used in the REGARDS study assessed medication adherence in general and was not specific to antihypertensive medication. Medication adherence was assessed during a single study visit and we were unable to ascertain the persistency of medication adherence during follow‐up. Despite these limitations, the current analysis maintains several strengths. The REGARDS study includes a nationwide population‐based sample of white and African American US adults. Many prior studies of medication adherence have included select populations (eg, randomized trial participants, members of large managed care organizations, patients with Medicaid health insurance) and, thus, had limited generalizability. 37 , 38 , 39 , 41 The REGARDS study recruited individuals irrespective of socioeconomic or health insurance status. Additionally, the REGARDS study uses standardized protocols with stringent quality control procedures for data collection and has active follow‐up, which allowed for the unbiased assessment of stroke symptoms over several years of follow‐up.
Conclusions
In the current nationwide study of white and African American US adults, low medication adherence was associated with an increased risk for the incidence of stroke symptoms. These associations were strong, graded, and present before and after multivariable adjustment including systolic BP. Further work is required to understand the factors that lead to low medication adherence, interventions to improve adherence, and whether improving adherence reduces the incidence of stroke symptoms as well as other adverse clinical outcomes. In the meantime, health care providers should continue to discuss medication adherence with their patients, and, among patients with low adherence, try to assist them in overcoming barriers to taking their medication.
Conflicts of Interest: The authors report no conflicts of interest.
Acknowledgments
Acknowledgments and disclosures: This research project is supported by a cooperative agreement U01 NS041588 from the National Institute of Neurological Disorders and Stroke, National Institutes of Health, Department of Health and Human Services. The content is solely the responsibility of the authors and does not necessarily represent the official views of the National Institute of Neurological Disorders and Stroke or the National Institutes of Health. Representatives of the funding agency have been involved in the review of the manuscript but not directly involved in the collection, management, analysis, or interpretation of the data. The authors thank the investigators, staff, and participants of the REGARDS study for their valuable contributions. A full list of participating REGARDS investigators and institutions can be found at http://www.regardsstudy.org. Drs Muntner and Krousel‐Wood received support from the National Institute on Aging grant number R01 AG022536. Drs Safford, Halanych, and Durant received support from grant number R01 HL80477.
Adherence scale and stroke symptom questionnaire used in the REGARDS study.
| 4‐Item adherence scale |
| 1. Do you ever forget to take medications? |
| 2. Are you ever careless in taking your medications? |
| 3. Do you ever miss taking your medications when you are feeling better? |
| 4. Do you ever miss taking any of your medications because you are feeling sick? |
| Stroke symptoms from the questionnaire for verifying stroke‐free status used during the REGARDS study follow‐up |
| 1. Since the last time we talked, have you had sudden numbness or a dead feeling on one side of your body? |
| 2. Since the last time we talked, have you had sudden painless weakness on one side of your body? |
| 3. Since the last time we talked, have you had sudden painless loss of vision in one or both eyes? |
| 4. Since the last time we talked, have you had suddenly lost one half of your vision? |
| 5. Since the last time we talked, have you suddenly lost the ability to understand what people were saying? |
| 6. Since the last time we talked, have you suddenly lost the ability to express yourself verbally or in writing? |
References
- 1. Howard VJ, McClure LA, Meschia JF, et al. High prevalence of stroke symptoms among persons without a diagnosis of stroke or transient ischemic attack in a general population: the REasons for Geographic And Racial Differences in Stroke (REGARDS) study. Arch Intern Med. 2006;166(18):1952–1958. [DOI] [PubMed] [Google Scholar]
- 2. Leary MC, Saver JL. Annual incidence of first silent stroke in the United States: a preliminary estimate. Cerebrovasc Dis. 2003;16(3):280–285. [DOI] [PubMed] [Google Scholar]
- 3. Chambless LE, Shahar E, Sharrett AR, et al. Association of transient ischemic attack/stroke symptoms assessed by standardized questionnaire and algorithm with cerebrovascular risk factors and carotid artery wall thickness. The ARIC Study, 1987–1989. Am J Epidemiol. 1996;144(9):857–866. [DOI] [PubMed] [Google Scholar]
- 4. Chambless LE, Toole JF, Nieto FJ, et al. Association between symptoms reported in a population questionnaire and future ischemic stroke: the ARIC study. Neuroepidemiology. 2004;23(1‐2):33–37. [DOI] [PubMed] [Google Scholar]
- 5. Vermeer SE, Hollander M, van Dijk EJ, et al. Silent brain infarcts and white matter lesions increase stroke risk in the general population: the Rotterdam Scan Study. Stroke. 2003;34(5):1126–1129. [DOI] [PubMed] [Google Scholar]
- 6. Kannel WB, Wolf PA, McGee DL, et al. Systolic blood pressure, arterial rigidity, and risk of stroke. The Framingham study. JAMA. 1981;245(12):1225–1229. [PubMed] [Google Scholar]
- 7. O’Donnell MJ, Xavier D, Liu L, et al. Risk factors for ischaemic and intracerebral haemorrhagic stroke in 22 countries (the INTERSTROKE study): a case–control study. Lancet. 2010;376(9735):112–123. [DOI] [PubMed] [Google Scholar]
- 8. Krousel‐Wood M, Thomas S, Muntner P, et al. Medication adherence: a key factor in achieving blood pressure control and good clinical outcomes in hypertensive patients. Curr Opin Cardiol. 2004;19(4):357–362. [DOI] [PubMed] [Google Scholar]
- 9. World Health Orgainzation . Adherence To Long‐Term Therapies: Evidence For Action. Geneva, Switzerland: World Health Organization; 2003. [Google Scholar]
- 10. Elliott WJ. Compliance—and improving it—in hypertension. Manag Care. 2003;12(8 Suppl Hypertension):56–61. [PubMed] [Google Scholar]
- 11. Hyre AD, Krousel‐Wood MA, Muntner P, et al. Prevalence and predictors of poor antihypertensive medication adherence in an urban health clinic setting. J Clin Hypertens (Greenwich). 2007;9(3):179–186. [DOI] [PMC free article] [PubMed] [Google Scholar]
- 12. Morisky DE, Ang A, Krousel‐Wood M, et al. Predictive validity of a medication adherence measure in an outpatient setting. J Clin Hypertens (Greenwich). 2008;10(5):348–354. [DOI] [PMC free article] [PubMed] [Google Scholar] [Retracted]
- 13. Kim MT, Hill MN, Bone LR, et al. Development and testing of the Hill‐Bone Compliance to High Blood Pressure Therapy Scale. Prog Cardiovasc Nurs. 2000;15(3):90–96. [DOI] [PubMed] [Google Scholar]
- 14. Muntner P, Judd SE, Krousel‐Wood M, et al. Low medication adherence and hypertension control among adults with CKD: data From the REGARDS (Reasons for Geographic and Racial Differences in Stroke) Study. Am J Kidney Dis. 2010;56(3):447–457. [DOI] [PMC free article] [PubMed] [Google Scholar]
- 15. Krousel‐Wood M, Islam T, Webber LS, et al. New medication adherence scale versus pharmacy fill rates in seniors with hypertension. Am J Manag Care. 2009;15(1):59–66. [PMC free article] [PubMed] [Google Scholar]
- 16. Krousel‐Wood MA, Muntner P, Islam T, et al. Barriers to and determinants of medication adherence in hypertension management: perspective of the cohort study of medication adherence among older adults. Med Clin North Am. 2009;93(3):753–769. [DOI] [PMC free article] [PubMed] [Google Scholar]
- 17. DiMatteo MR, Giordani PJ, Lepper HS, et al. Patient adherence and medical treatment outcomes: a meta‐analysis. Med Care. 2002;40(9):794–811. [DOI] [PubMed] [Google Scholar]
- 18. Howard VJ, Cushman M, Pulley L, et al. The reasons for geographic and racial differences in stroke study: objectives and design. Neuroepidemiology. 2005;25(3):135–143. [DOI] [PubMed] [Google Scholar]
- 19. Radloff LS. The CES‐D scale: a self‐report depression scale for research in the general population. Appl Psychol Measure. 1977;1:385–401. [Google Scholar]
- 20. Callahan CM, Unverzagt FW, Hui SL, et al. Six‐item screener to identify cognitive impairment among potential subjects for clinical research. Med Care. 2002;40(9):771–781. [DOI] [PubMed] [Google Scholar]
- 21. Chobanian AV, Bakris GL, Black HR, et al. The Seventh Report of the Joint National Committee on Prevention, Detection, Evaluation, and Treatment of High Blood Pressure: the JNC 7 report. JAMA. 2003;289(19):2560–2572. [DOI] [PubMed] [Google Scholar]
- 22. Levey AS, Stevens LA, Schmid CH, et al. A new equation to estimate glomerular filtration rate. Ann Intern Med. 2009;150(9):604–612. [DOI] [PMC free article] [PubMed] [Google Scholar]
- 23. Morisky DE, Green LW, Levine DM. Concurrent and predictive validity of a self‐reported measure of medication adherence. Med Care. 1986;24(1):67–74. [DOI] [PubMed] [Google Scholar]
- 24. Shalansky SJ, Levy AR, Ignaszewski AP. Self‐reported Morisky score for identifying nonadherence with cardiovascular medications. Ann Pharmacother. 2004;38(9):1363–1368. [DOI] [PubMed] [Google Scholar]
- 25. Meschia JF, Brott TG, Chukwudelunzu FE, et al. Verifying the stroke‐free phenotype by structured telephone interview. Stroke. 2000;31(5):1076–1080. [DOI] [PubMed] [Google Scholar]
- 26. Jones WJ, Williams LS, Meschia JF. Validating the Questionnaire for Verifying Stroke‐Free Status (QVSFS) by neurological history and examination. Stroke. 2001;32(10):2232–2236. [DOI] [PubMed] [Google Scholar]
- 27. Meschia JF, Lojacono MA, Miller MJ, et al. Reliability of the questionnaire for verifying stroke‐free status. Cerebrovasc Dis. 2004;17(2‐3):218–223. [DOI] [PubMed] [Google Scholar]
- 28. Allison P. Estimating Parametric Regression Models with PROC LIFEREG. Survival Analysis Using SAS: A Practical Guide. Cary, NC: SAS Publishing; 2008:61–110. [Google Scholar]
- 29. Finkelstein DM. A proportional hazards model for interval‐censored failure time data. Biometrics. 1986;42(4):845–854. [PubMed] [Google Scholar]
- 30. Howard G, Safford MM, Meschia JF, et al. Stroke symptoms in individuals reporting no prior stroke or transient ischemic attack are associated with a decrease in indices of mental and physical functioning. Stroke. 2007;38(9):2446–2452. [DOI] [PubMed] [Google Scholar]
- 31. Muntner P, DeSalvo KB, Wildman RP, et al. Trends in the prevalence, awareness, treatment, and control of cardiovascular disease risk factors among noninstitutionalized patients with a history of myocardial infarction and stroke. Am J Epidemiol. 2006;163(10):913–920. [DOI] [PubMed] [Google Scholar]
- 32. Patient behavior for blood pressure control. Guidelines for professionals. JAMA. 1979;241(23):2534–2537. [DOI] [PubMed] [Google Scholar]
- 33. Alderman MH. Barriers to blood pressure control. Am J Hypertens. 1999;12(12 Pt 1‐2):1268–1269. [DOI] [PubMed] [Google Scholar]
- 34. Sackett DL, Snow JC. The magnitude of compliance and noncompliance. In: Haynes RB, Taylor DW, Sackett DL, eds. Compliance in Health Care. Baltimore, MD: Johns Hopkins University Press; 1992:11–22. [Google Scholar]
- 35. Egan BM, Zhao Y, Axon RN. US trends in prevalence, awareness, treatment, and control of hypertension, 1988–2008. JAMA. 2010;303(20):2043–2050. [DOI] [PubMed] [Google Scholar]
- 36. DiMatteo MR. Variations in patients’ adherence to medical recommendations: a quantitative review of 50 years of research. Med Care. 2004;42(3):200–209. [DOI] [PubMed] [Google Scholar]
- 37. Simpson SH, Eurich DT, Majumdar SR, et al. A meta‐analysis of the association between adherence to drug therapy and mortality. BMJ. 2006;333(7557):15. [DOI] [PMC free article] [PubMed] [Google Scholar]
- 38. Kettani FZ, Dragomir A, Cote R, et al. Impact of a better adherence to antihypertensive agents on cerebrovascular disease for primary prevention. Stroke. 2009;40(1):213–220. [DOI] [PubMed] [Google Scholar]
- 39. Bailey JE, Wan JY, Tang J, et al. Antihypertensive medication adherence, ambulatory visits, and risk of stroke and death. J Gen Intern Med. 2010;25(6):495–503. [DOI] [PMC free article] [PubMed] [Google Scholar]
- 40. Krousel‐Wood M, Hyre A, Muntner P, et al. Methods to improve medication adherence in patients with hypertension: current status and future directions. Curr Opin Cardiol. 2005;20(4):296–300. [DOI] [PubMed] [Google Scholar]
- 41. Maddox TM, Ross C, Tavel HM, et al. Blood pressure trajectories and associations with treatment intensification, medication adherence, and outcomes among newly diagnosed coronary artery disease patients. Circ Cardiovasc Qual Outcomes. 2010;3(4):37–47. [DOI] [PMC free article] [PubMed] [Google Scholar]