

Abstract
A hallmark of mammalian evolution is the structural and functional complexity of the cerebral cortex. Within the cerebral cortex, the neocortex, or isocortex, is a 6-layered complexly organized structure that is comprised of multiple interconnected sensory and motor areas. These areas and their precise patterns of connections arise during development, through a process termed arealization. Intrinsic, activity-independent and extrinsic, activity-dependent mechanisms are involved in the development of neocortical areas and their connections. The intrinsic molecular mechanisms involved in the establishment of this sophisticated network are not fully understood. In this report (I) and the companion report (II), we present the first lifespan analysis of ipsilateral intraneocortical connections (INCs) among multiple sensory and motor regions, from the embryonic period to adulthood in the mouse. Additionally, we characterize the neocortical expression patterns of several developmentally regulated genes that are of central importance to studies investigating the molecular control of arealization from embryonic day 13.5 to postnatal day (P) 3 (I) and P6 to 50 (II). In this analysis, we utilize novel methods to correlate the boundaries of gene expression with INCs and developing areal boundaries, in order to better understand the nature of gene–areal relationships during development.
Keywords: arealization, connections, neocortex, development, gene expression
Introduction
The mammalian neocortex contains a densely interconnected network of anatomically and functionally distinct areas. The organization of these areas and their connections, both within the neocortex and with other non-cortical brain regions, creates a complex system that allows the animal to perform a sophisticated set of behaviors. Specific anatomical, physiological, and functional characteristics of this system are established during development. The mechanisms involved in the division of the cortical sheet into distinct areas, a process termed “arealization,” are not fully understood and have been the topic of great debate, from which 2 major developmental theories have emerged (Rakic 1988; O'Leary 1989; Huffman et al. 1999, Rubenstein and Rakic 1999; Rubenstein et al. 1999, Krubitzer and Huffman 2000; Pallas 2001; Ruiz i Altaba et al. 2001; Cecchi 2002; Grove and Fukuchi-Shimogori 2003; Huffman et al. 2004; Sur and Rubenstein 2005; O'Leary and Sahara 2008; Rakic et al. 2009). The Protomap hypothesis, first postulated by Rakic (1988), states that the development of discrete neocortical areas is dependent on a mechanism intrinsic to the neocortex. Specifically, molecules in the proliferative zone and in postmitotic cells prespecify the tissue to become a certain cortical area or at least an area within a particular sensory system (e.g., a “visual” cortical area). The opposing idea, referred to as the Protocortex hypothesis, emphasizes the role of thalamic input in the determination of neocortical areal fate (for review, see O'Leary et al. 1994). This hypothesis rests on the idea that cortical precursor cells are nonspecific, establishing their identity later in development, thus giving the developing cortical neuroepithelium a tabula rasa character. In this construct, the thalamic afferents, particularly those from sensory projection nuclei, “assign” cortical territories and provide the activity-related input needed for normal function.
Although neocortical areas could not function properly without input from the peripheral nervous system, there is mounting evidence that molecular mechanisms within the developing neocortex play a major role in arealization, thus providing support for the Protomap hypothesis (Donoghue and Rakic 1999; Miyashita-Lin et al. 1999; Nakagawa et al. 1999; Bishop et al. 2000; Liu et al. 2000; Zhou et al. 2001; Yun et al. 2003; Fukuchi-Shimogori and Grove 2003; Shimogori et al. 2004; Abu-Khalil et al. 2004; Funatsu et al. 2004; Hamasaki et al. 2004; Huffman et al. 2004; Sansom et al. 2005; Bai et al. 2006; Mallamaci and Stoykova 2006; O'Leary et al. 2007; Cholfin and Rubenstein 2008; Joshi et al. 2008). Although neocortical expression patterns of some genes, such as Id2, Cadherin6, and COUP-TFI have been described and implicated in this developmental process, exactly when, where, and what role these genes play in arealization is not completely understood (Rubenstein et al. 1999; Garel et al. 2003; Huffman et al. 2004; Armentano, et al. 2007; Kudo et al. 2007; Faedo et al. 2008; Piñon et al. 2008). Additionally, no single study has provided a lifespan assay of the relationship between neocortical gene expression and areal development. Interestingly, genes are sometimes considered “markers” for certain neocortical areas in the young or embryonic mouse, without a comprehensive demonstration of how the gene expression boundaries coregister with actual early areal boundaries. Some molecular markers, such as Id2, Cadherin6, RZRß, Cadherin8, COUP-TFI, and EphA7 have been referred to as “areal markers” based primarily on neocortical position (Piñon et al. 2008). In some cases, features of a cortical area have been correlated with the expression of a particular gene (e.g., barrels and EphrinA5 expression in the young mouse, Vanderhaeghen et al. 2000), but a more thorough analysis of how gene expression relates to the development of multiple sensory and motor areas is required.
In order to understand the potential role of gene expression in the establishment of areal boundaries, we must have a way to identify such boundaries during the time when they gain their identity. One important, defining characteristic of a neocortical area is its pattern of intraneocortical connections (INCs) (Kaas 1982), and these connections have been used to define putative areal boundaries in the embryonic and early postnatal mouse (Huffman et al. 2004). Although the timing of thalamocortical axon development has been studied in the mouse (Molnar and Blakemore 1995; Auladell et al. 2000), developmental timing of ipsilateral INCs within and between multiple sensory and motor areas has not been fully described. Furthermore, the development of INCs has not been correlated with patterns of gene expression. While some studies have described the relationship between development of gene expression and neocortical connections, most of these have been conducted with mutant mouse models. For example, FGF8 hypomorphic mutants exhibit both rostrally shifted patterning of many neocortical molecular markers at P0 and altered ipsilateral INC patterns, where cells in the caudal cortex ectopically project axons to a position far rostral compared with the wild type (Huffman et al. 2004). Despite abnormal INCs, these mutants demonstrate a normal pattern of thalamocortical connectivity (Garel et al. 2003). Likewise, the thalamocortical connections appear normal in the Pax6 mutant, despite the rostral shift of several neocortical molecular markers (Piñon et al. 2008).
Using anatomical tracing techniques, we characterize the development of INCs in developing motor and sensory neocortex in a specific time-course analysis in the wild-type mouse from embryonic day (E) 12.5 to postnatal day (P) 3 (current report, I) and from P6 to P50 (companion report, II). These patterns of connections are used to distinguish areal boundaries in the embryonic and early postnatal period, to adulthood. In parallel, using in situ hybridization, we create “gene maps” that demonstrate the timing, location, and gradient of neocortical gene expression that is thought to distinguish the developing areas and regions of the neocortex. These genetic boundaries are coregistered with cortical areal boundaries identified through the analysis of connection patterns. Given that major features of sensory areas are established during the late-embryonic and early postnatal periods (E16.5–P3; e.g., the barrel field in somatosensory cortex, Rice and Van der Loos 1977), the correlation of gene expression patterns with areal subdivisions delineated through analysis of cortical circuitry is an important and previously untested method to examine the arealization process. Our results support the notion that gene expression is playing a major, if not dominant role in cortical parcellation, particularly in terms of INC development (Huffman et al. 2004). This lifespan analysis is a significant contribution to our understanding of the development of neocortical connections and gene expression in mice and provides valuable information regarding the relationships between the 2 phenomena.
Materials and Methods
Mouse Colony
All breeding and experimental studies were conducted in strict accordance with protocol guidelines approved by the Institutional Animal Care and Use Committee at the University of California, Riverside. All mice were maintained in a CD1 background and originally purchased from Jackson Laboratories. For staging of embryonic embryos and mouse pups, E0.5 was set at noon of the day of vaginal plug visualization, and P0 was the day of birth.
Tissue Preparation
To obtain E12.5, E13.5, E14.5, E16.5, and E18.5 embryos, pregnant mothers were sacrificed via cervical dislocation and decapitation at noon on either the 12th, 13th, 14th, 16th, or 18th day of pregnancy. The embryos were surgically removed from the uterus. E12.5, E13.5, and E14.5 embryos were euthanized via hypothermia, followed by decapitation. Older animals (E16.5–P3) were euthanized via hypothermia and transcardially perfused with 4% paraformaldehyde (PFA) in 0.1 M phosphate buffer (pH 7.4). In all cases, the brain was removed from the skull, hemisected, and initially postfixed in 4% PFA depending on age and experiment. For each case, one hemisphere was used for postmortem tracing, and the opposite hemisphere was used for in situ hybridization. This method has been published previously (Huffman et al. 2004). Overall postfixation time was determined by the experimental procedure (3–6 weeks after dye injections for tracing experiments and overnight for in situ RNA hybridization). After initial postfixation, cortices solely devoted to in situ RNA hybridization were step immersed into methanol for dehydration and stored at −20°C.
Anatomical Tracing Techniques
1,1′-Dioctadecyl-3,3,3′,3′-tetramethylindocarbocyanine perchlorate (DiI) and 4-(4-(dihexadecylamino)styryl)-N-methylpyridinium iodide (DiA) crystals were used to identify ipsilateral INCs in embryonic and young postnatal wild-type mice; this method has been described previously (Godement et al. 1987; Garel et al. 2003; Huffman et al. 2004). To determine the developmental progression of INCs in the mouse, single crystals of DiI and DiA were placed in different locations in the developing neocortex of mice at the following ages: E12.5, E13.5, E14.5, E16.5, E18.5, P0, and P3. Dye crystals were placed in 4 locations: rostral–frontal (putative motor cortex), rostral–parietal (putative somatosensory cortex), caudal–medial (putative visual cortex), or temporal–lateral (putative auditory cortex) in the developing neocortex, with a maximum of 2 dye placement locations (DPLs) per hemisphere. Each crystal was placed in a morphologically defined location, using a dye placement grid to enhance reliability of crystal placement (see dye placement methods in Huffman et al. 2004). After dye placement, brains were immersed in 4% PFA and stored in darkness at room temperature for 3–5 weeks (embryonic) and 4–6 weeks (postnatal) to allow for transport of tracer. Our postmortem dye-tracing methods do not include the use of heat, in order to prevent nonspecific diffusion of tracer at the DPL. Prior to sectioning, each brain E16.5 or older was examined to verify transport of tracer to thalamic nuclei, and later, in sectioned tissue, the dye placement positions were verified using thalamocortical labeling; for example, a “visual cortex” injection was only included as such if retrogradely labeled cells were present in the lateral geniculate nucleus (LGN) of the thalamus (see thalamic labeling in Fig. 2). Cortices were sectioned in the coronal plane at 100 μm using a Vibratome. Sections were stained for 4′, 6-diamidine-2-phenylindole dihydrochloride crystallized (DAPI, Roche), mounted onto glass slides, coverslipped with Vectashield mounting medium for fluorescence (Vector Laboratories, Inc.), and photographed as described below. For each age and DPL, 4 successful replicates were assessed.
Figure 2.
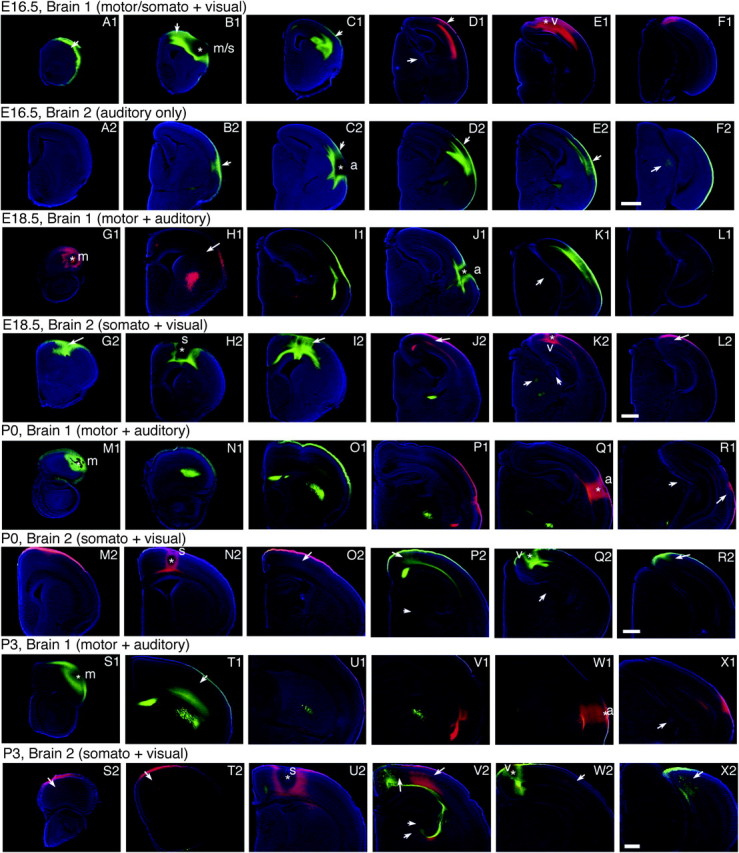
Analysis of INC formation during late embryogenesis and postnatal stages; 100-μm coronal sections of E16.5 (A1–F1, A2–F2), E18.5 (G1–L1, G2–L2), P0 (M1–R1, M2–R2), and P3 (S1–X1, S2–X2) hemispheres following DiI or DiA dye placement, conventions as in previous. E16.5, Brain 1: DPLs in putative somatosensory/motor (B1) and visual (E1) cortex; Brain 2: DPL in presumptive auditory cortex (C2). For ages E18.5–P3, Brain 1 DPLs in motor (G1, M1, S1) and auditory cortex (J1, Q1, W1); Brain 2 DPLs in somatosensory (H2, N2, U2) and visual cortex (K2, Q2, W2). Thalamic arrows indicate retrogradely labeled cells in the following nuclei: LGN (D1 medial, K2, Q2, and V2 lateral); medial geniculate nucleus (F2, K1, R1 medial, and X1); ventral posterior nucleus (K2 medial, P2 ventral, and V2 medial). Top left arrow in V2 indicates the visual–somatosensory boundary. All other arrows indicate retrogradely labeled cells. m, putative motor; s, putative somatosensory; a, putative auditory; and v, putative visual areas. Scale bars = 500 μm.
Gene Expression Assays
Gene expression assays in wild-type mouse brains were conducted using standard protocols and methods for nonradioactive free-floating in situ RNA hybridization (Shimamura et al. 1994; Garel et al. 1999; Huffman et al. 2004). The following probes were used to identify the patterns of neocortical gene expression in the developmental period from E13.5 to P3: COUP-TF1, Id2, RZRß, EphA7, EphrinA5 (gifts from John Rubenstein, UCSF), Lhx2 (a gift from Juan Botas, Baylor College of Medicine), Cadherin8 (Cad8, a gift from Masatoshi Takeichi, Riken Center for Developmental Biology, Japan). To prepare tissue for in situ RNA hybridization, hemispheres reserved for hybridization (opposite hemispheres to those used in dye-tracing studies) were embedded in gelatin–albumin and sectioned coronally or sagittally at 100 μm using a Vibratome. After hybridization, all sections were mounted in glycerol onto glass slides, coverslipped, and photographed as described below. In order to be included in this study, at least 3 successful replicates for each gene at each age in each plane of section were obtained.
Analysis of Dye-Tracings and Gene Expression Assays
All images were captured using a digital high-resolution Zeiss Axio camera (HRm) using Axiovision software (Version 4.7) connected to a PC. For the analysis of dye-tracing experiments, all sections were digitally imaged 3 times using a Zeiss Axio Imager Upright Microscope equipped with fluorescence. Three filters used were as follows: blue for DAPI counterstain, red for DiI, and green for DiA labeling (excitation wavelengths: blue: DAPI—359 nm, red: Cy 3—550 nm, green: GFP—470 nm; emission wavelengths: blue: DAPI—461 nm, red: Cy 3—570 nm, green: GFP—509 nm). Images were then merged and saved in high-resolution format for analysis. Sections processed for in situ RNA hybridization were digitally imaged using bright field on a Zeiss Stereo Discovery V12 stereomicroscope and imaged with the same Zeiss Axio camera described above.
Reconstruction of Ipsilateral INCs and Gene Expression
In order to facilitate coregistration of early areal boundaries determined from INCs and gene expression patterns, we have combined an INC flattening procedure (used previously by the corresponding author) with a novel gene expression flattening procedure. The INC flattening method of data reconstruction illustrates the INC data in a lateral view of the cortex; this has been shown previously to be an effective method of analysis (Huffman et al. 2004, Fig. 3). Additionally, a similar technique has been presented previously, from microarray data (Hawrylycz et al. 2010). We have now amended this method to allow us to reconstruct complex gene expression data as shown in Figures 4–10 of this report and present the expression pattern on a “lateral” view of the neocortex. The coregistration of the flattened reconstructions from the 2 data sets allows a clear demonstration of their correlation. The specific details of these reconstructions methods and their coregistration are described in Supplementary Materials.
Figure 3.
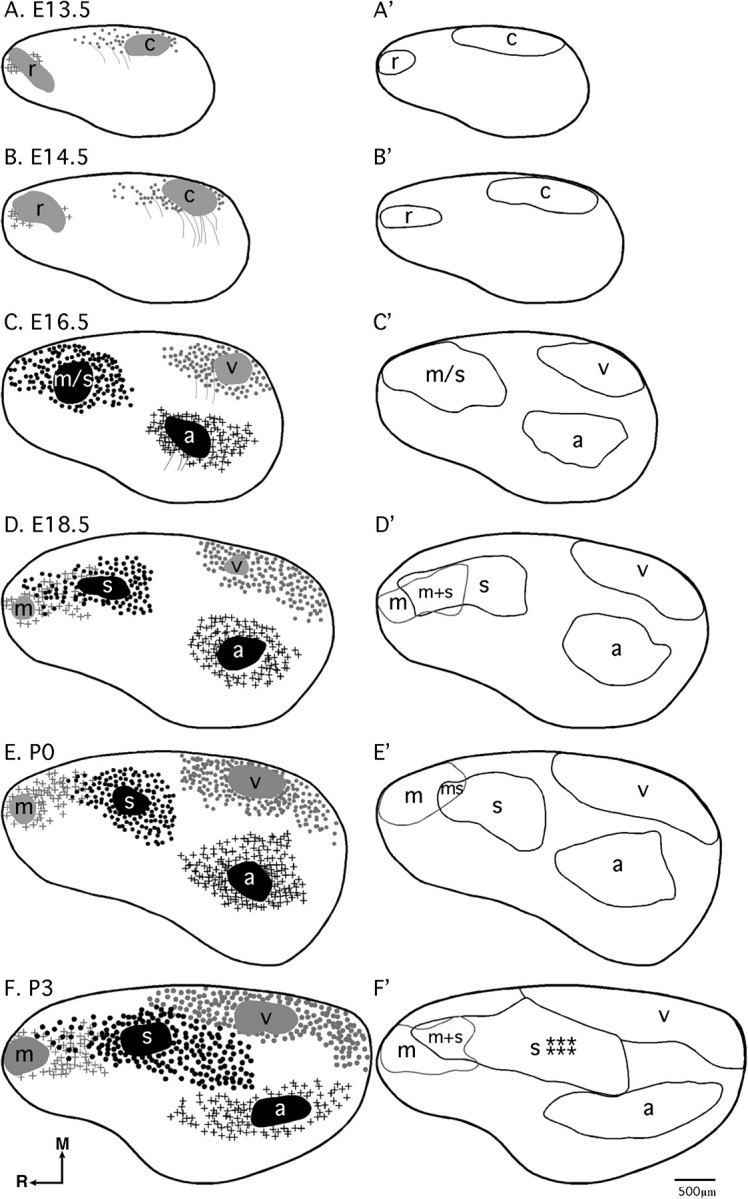
Reconstruction of areal boundaries through analysis of INCs. All panels represent a lateral view of one hemisphere. Panels (A–F) DPLs and organization of retrogradely labeled cells (black or gray patches = DPL plus dye spread; gray filled circles = retrogradely labeled cells in putative caudal/visual cortex; gray lines = processes; gray plus signs = retrogradely labeled cells in putative rostral/motor cortex; black filled circles: retrogradely labeled cells in putative motor/somatosensory or somatosensory cortex; black plus signs= retrogradely labeled cells in putative auditory cortex; thick black line = hemisphere outline). Panels (A′–F′): lateral view reconstructions of putative areal boundaries as determined by INC analyses (gray and black lines = putative cortical areas as labeled; r, putative rostral area; c, putative caudal area; m, putative motor cortex; m + s, putative sensory–motor amalgam; m/s or s, putative motor/somatosensory or somatosensory cortex; a, putative auditory cortex; v, putative visual cortex). Stars denote location of putative barrel field. Oriented medial (M) up and rostral (R) to the left. Scale bar = 500 μm.
Figure 4.
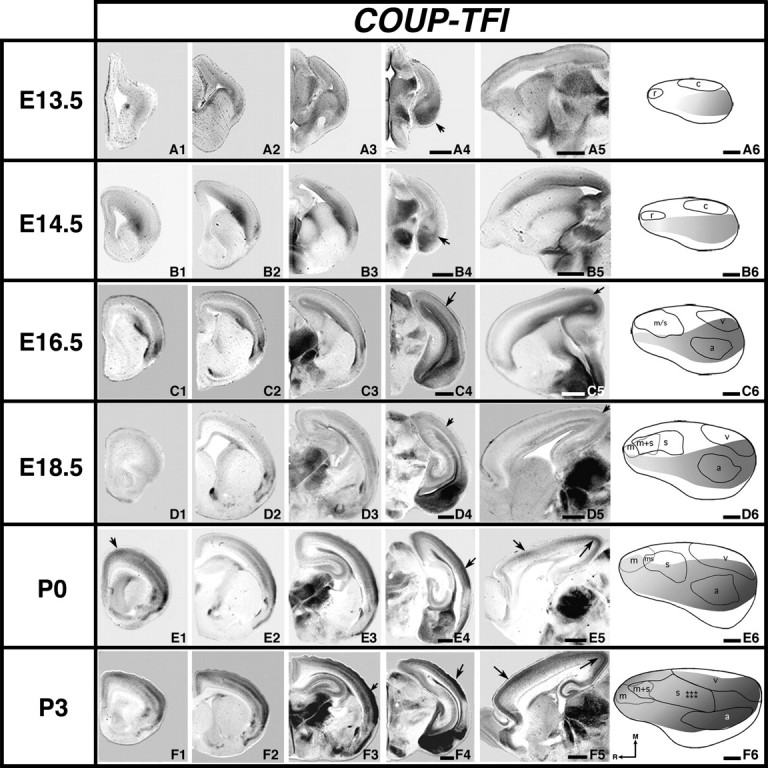
Analysis of neocortical gene expression of COUP-TFI; 100 μm rostral to caudal coronal series (A to F1–4) or sagittal (A5–F5) sections of E13.5 (A1–5), E14.5 (B1–5), E16.5 (C1–5), E18.5 (D1–5), P0 (E1–5), or P3 (F1–5) brain hemispheres after in situ hybridization with a probe for COUP-TFI, oriented with dorsal up (all sections) and medial (A to F1–4) or rostral (A5–F5) to the left. Panels A6–F6 show lateral view reconstructions within one hemisphere of gene expression gradients or gene maps (gray shaded areas) coregistered with areal reconstructions at each age. Other conventions as in previous. COUP-TFI is observed at E13.5 (A4 arrow: caudo/lateral expression) to P3 in a rostral to caudal lateral gradient. Expression is present at later ages in a caudal region (arrows in B4, C4–5, D4–5, E4, F3–4), a rostral region (E1, E5, and F5 rostral arrows), and caudomedial region (E5, F5 caudal arrows). Scale bars = 500 μm.
Figure 5.

Analysis of neocortical gene expression of Id2; 100 μm coronal (A to F1–4) or sagittal (A5–F5) sections and gene maps (A6–F6) of E13.5–P3 brain hemispheres after in situ hybridization with a probe for Id2, with conventions as in previous. Id2 expression is observed from E13.5 to P3. E13.5 expression is most pronounced laterally (A2, arrow). Strong expression is observed laterally, rostrally, and medially at E14.5–E16.5 (B3, B5, C2, C5, arrows). E18.5–P3 shows increased laminar complexity of expression. D4–5, E1, E3 lateral, E5, F5 arrows: regions of strong expression. Low superficial expression corresponds to the putative barrel field (E3, F3 medial arrows) in contrast with a rostral region of strong superficial expression (F1 medial arrow) that is not maintained laterally (F1 lateral arrow). F3–4 lateral arrows: distinct lateral domain of expression correlated with auditory cortex. Scale bars = 500 μm.
Figure 6.

Analysis of neocortical gene expression of Lhx2; 100 μm coronal (A to F1–4) or sagittal (A5–F5) sections and gene maps (A6–F6) of E13.5–P3 brain hemispheres after in situ hybridization with a probe for Lhx2, with conventions as in previous. Lhx2 is expressed from E13.5 to P3. At early ages, expression is confined primarily to the most medial regions of the cortex (arrows in A3, A5, B4 and A6–B6). At E16.5 (C3–C4, arrows), a lateral domain of expression emerges. Medial wall expression decreases at later ages (D3, arrow), while lateral expression in superficial layers spreads and increases in intensity. C5, D4, D5, E5, and F5 arrows: gradients of expression. E1, E3, E4 and F4 arrows: robust expression along the rostral/caudal extent of the neocortex, including the putative auditory cortex (E6). F3 arrow: strong expression in the developing barrel field. Scale bars = 500 μm.
Figure 7.

Analysis of neocortical gene expression of RZRß; 100 μm coronal (A–F1–4) or sagittal (A5–F5) sections and gene maps (A6–F6) of E13.5–P3 brain hemispheres after in situ hybridization with a probe for RZRß, with conventions as in previous. RZRß expression is first detected within the developing neocortex at E16.5 (C2, C5, arrows). Rostromedial expression is reduced at later ages but caudolateral expression strengthens and expands (D6–F6). D2, D5, E5, and F5 arrows indicate the expression gradient. E3 arrows: nonuniform expression along the medial/lateral extent, F2 arrow: robust expression in the developing barrel field. Scale bars = 500 μm.
Figure 8.
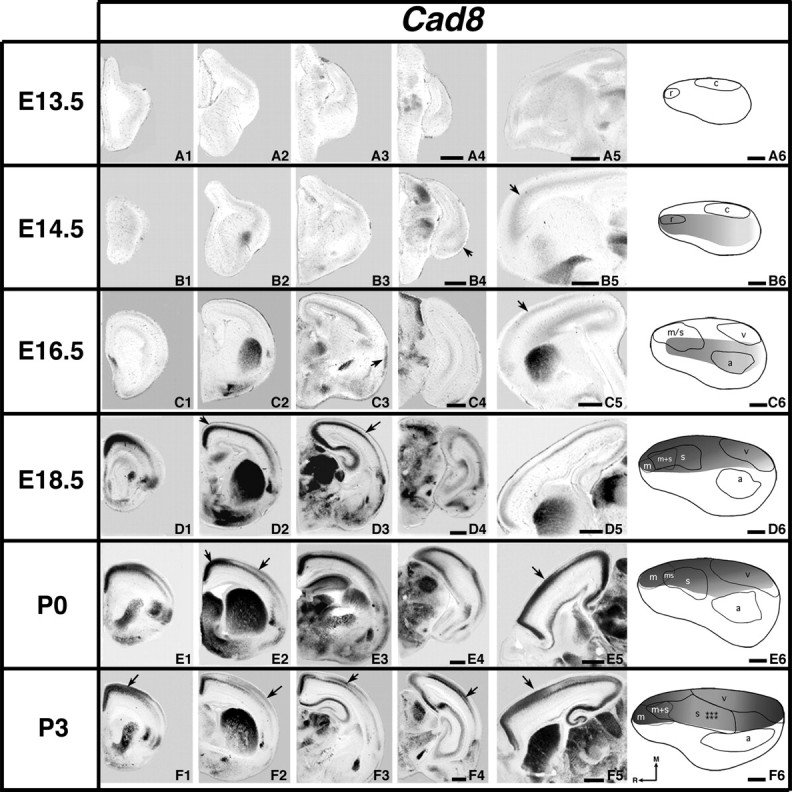
Analysis of neocortical gene expression of Cad8; 100 μm coronal (A–F1–4) or sagittal (A5–F5) sections and gene maps (A6–F6) of E13.5–P3 brain hemispheres after in situ hybridization with a probe for Cad8, with conventions as in previous. Cad8 expression is first detected at E14.5 (B4–B5, arrows). Expression remains low at E16.5 (C5, arrow). A uniform gradient with levels highest medially is observed at E18.5; at later ages, distinct domains of expression are also observed. D2, D3, F1, F3–F4, and lateral E2 arrows: gradients of gene expression. E2 medial and E5 arrow: domains of strong medial expression, F2 arrow: weak expression in developing barrel field. Scale bars = 500 μm.
Figure 9.
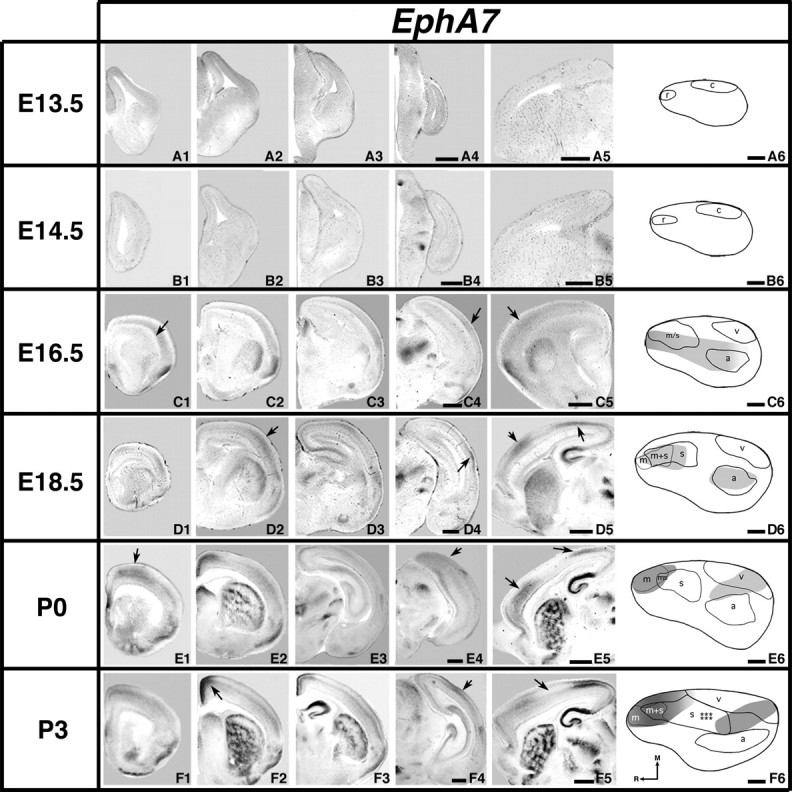
Analysis of neocortical gene expression of EphA7; 100 μm coronal (A–F1–4) or sagittal (A5–F5) sections and gene maps (A6–F6) of E13.5–P3 brain hemispheres after in situ hybridization with a probe for EphA7, with conventions as in previous. EphA7 is first detected in the neocortex at E16.5 (C1, C4–C5, arrows). At E18.5 and older, expression is present rostrally and caudally, but excluded from the putative somatosensory barrel field. D4, E4, and F4 arrows: caudal expression domains. D5 and E5 arrows: rostral/caudal expression separated by island of weak expression. D2, E1, and F2 arrows: rostromedial/medial expression domains. F5 arrows/F6 stars: EphA7-negative domain at the location of the developing barrel fields. Scale bars = 500 μm.
Figure 10.

Analysis of neocortical gene expression of EphrinA5; 100 μm coronal (A–F1–4) or sagittal (A5–F5) and gene maps (A6–F6) of E13.5–P3 brain hemispheres after in situ hybridization with a probe for EphrinA5, with conventions as in previous. EphrinA5 expression in the neocortex is first detected at E18.5, with low levels of transcripts found laterally and in the putative somatosensory barrel field (D3 and D5, arrows). At later ages, levels of expression increase in intensity while the distribution of transcripts remains similar. E1–4 arrows: gradients of expression; E5 and F5 arrows: putative somatosensory barrel field. F1–3 arrows: regions of strong expression moving caudally and laterally. F4 arrow: expression in putative visual cortex. Scale bars = 500 μm.
Results
In this report and its companion (II), we have detailed the development of neocortical connections from the first observation of tangential labeling in the embryonic mouse to the postpubescent adult mouse and relate these data to changes in gene expression over time. Although a previous report described tangential or parallel INCs present as early as E16.5 in the mouse (Huffman et al. 2004), a thorough lifespan analysis of INCs has not been previously published.
Early Development of Ipsilateral INCs in Mouse
Our first goal in this study was to complete a comprehensive analysis of the formation of INCs. The earliest INCs resulting from a dye crystal placement (DiI) are observed at E12.5 (Supplementary Fig. 1) where only radially oriented stacks of retrogradely labeled cells are present from the pial to ventricular surface of the cortical sheet. One day later in embryogenesis (E13.5) tangential connections stemming from caudal DPLs span a significant rostral-to-caudal cortical distance (Fig. 1A–G). Early connections within the developing cingulate cortex are present as well (Fig. 1B,B′, arrow). Although some labeled axons observed at E13.5 are newly established thalamocortical axons, many retrogradely labeled cell bodies demonstrate the first parallel or long-range connections formed between cell populations within the cortex. Comparatively, more rostral DPLs at E13.5 result in more circumscribed labeling zones (data not shown, but reconstructed in Fig. 3A).
Figure 1.

Analysis of INC formation during mid-embryogenesis; 100-μm coronal sections of E13.5 (A–G) or E14.5 (H–N) brain hemispheres following DiI crystal placement in the putative visual cortex, presented in a rostral to caudal series, oriented with dorsal up and lateral to the right. Boxed areas are shown at higher magnification in (B′–D′) and (K′–N′). Arrows indicate red DiI-labeled tangential processes and retrogradely labeled soma. At E13.5 (A–G), cells are found as far medially as the cingulate cortex, and the extent of retrogradely labeled cells extends a significant distance rostrally from the DPL (dye placement location). Retrogradely labeled cells are found at locations rostral (K–L) or caudal (N) to the DPL at E14.5, with the greatest number of cells present immediately rostral to the DPL. “*” Denotes DPL. Scale bars = 350μm.
At E14.5, the pattern of connections is similar to that seen at E13.5, with an increased presence of new INCs. A caudomedial DPL (Fig. 1M, starred) results in retrogradely labeled cells spanning more than half of the total rostrocaudal length of the cortex (Fig. 1I–N,K′–N′ arrows illuminate cell bodies). As with E13.5, rostral DPLs result in a more truncated labeling zone; this may suggest that connections of caudal cortical areas mature sooner than connections of frontal cortex (data not shown, but reconstructed in Fig. 3B). This is consistent with the observation that thalamocortical connections are set by E14.5, after being established in a caudal to rostral pattern (Molnar and Blakemore 1999; Auladell et al. 2000) and with the general view of neocortical lobe and sensory domain development (Kaas 1987, see Discussion).
A dramatic change in connections, brain, and neocortical morphology takes place between E14.5 and E16.5, and thus, E16.5 begins a developmental period we have termed the areal patterning period (APP, compare brain structure and labeling in Figs 1 and 2). By E16.5, the thalamocortical connections are established, major structures in the developing brain, such as the basal ganglia, thalamus, and thalamic sensory nuclei, the hippocampus, and the superior colliculus are easily identifiable (Fig. 2). At E16.5, the sensory and motor INCs begin to resemble an early adult-like pattern, with boundaries that may coincide with primary areal borders (see Discussion). A dye placement in the putative motor/somatosensory region (Fig. 2B1, starred) results in retrogradely labeled cells extending rostrally to the pole (Fig. 2A1, arrow), medially to the midline (Fig. 2B1, arrow), and caudally through putative rostral somatosensory cortex (Fig. 2C1, arrow). A caudal DPL in putative visual cortex at E16.5 (Fig. 2E1, starred) results in retrogradely labeled cells extending rostrally over the caudal half of the cortex (Fig. 2D1, dorsal arrow), to the level of the LGN. A DPL in the lateral cortex in another brain shows sensory INCs within putative auditory cortex that extend rostrally, medially, and caudally (Fig. 2B2–E2, arrows). At this stage, the putative boundaries between these developing motor and sensory areas are quite separated (see Fig. 3C). Beginning at E16.5 and older, retrogradely labeled cells are observed in appropriate thalamic nuclei (ventral posterior nucleus for somatosensory DPLs, the LGN for visual DPLs, and the medial geniculate nucleus for auditory DPLs) to verify the position of dye placement. These cells and nuclei are identified in the figures.
At E18.5, we begin to see clear evidence of the sensory–motor amalgam, where there is an overlap of projections from motor and somatosensory cortex (compare Fig. 2G1–H1 red labeling with G2–I2 green labeling). A putative somatosensory cortex DPL (Fig. 2H2, starred) results in labeled cells in rostral (within the sensory–motor amalgam, Fig. 2G2, arrow) and caudal positions through the somatic region (Fig. 2I2, arrow). Retrogradely labeled cells from a putative motor DPL (Fig. 2G1, starred) are observed caudally in putative rostral somatosensory cortex (Fig. 2H1, arrow). Retrogradely labeled cells from a putative visual cortex DPL (Fig. 2K2, starred) overlap cells from the auditory DPL medially but remain segregated, extend rostrally (J2, arrow), and caudally to the far caudomedial cortex (L2, arrow).
The sensory–motor amalgam is still present at P0 (Fig. 2, compare M1–O1 green and M2–O2 red, DPLs starred) and the most caudal cells labeled by the DPL in the putative somatosensory area (Fig. 2N2, star, and O2, arrow) remain segregated from cells labeled by the DPL in the putative visual area (Fig. 2P2, dorsal arrow). The same is evident for auditory and visual labeled cells, which remain segregated and represent distinct domains (Fig. 2R1, lateral arrow, and R2, arrow). By P3, INCs demonstrate a pattern very similar to the adult (see companion report, II). A DPL in putative motor cortex (Fig. 2S1, starred) results in retrograde labeling caudal to the DPL in the rostral somatosensory region (Fig. 2T1, arrow), and retrograde labeling from the somatosensory DPL (Fig. 2S2–T2, arrows) is observed rostrally through frontal/motor cortex demonstrating the continued presence of the sensory–motor amalgam (also see Fig. 3F). Additionally, labeled cells in the putative somatosensory area are observed caudally, lateral to the location of visual cortex, forming a close but nonoverlapping boundary (Fig. 2V2,W2 arrows to red somatosensory cells and medial V2 arrow at boundary). Label from the putative auditory cortex extends rostrally, overlapping the somatosensory labeling laterally (Fig. 2, compare V1 red and V2 red) and visual labeling caudolaterally (Fig. 2, compare X1 red and X2 green). However, the labeled cell populations remain segregated, delineating unique sensory domains. The labeled cells from the putative visual DPL extend rostro- and caudomedially (Fig. 2, V2 green, medial arrow at boundary, X2, arrow). Based on cell-labeling patterns at this age, the putative sensory and motor areas remain segregated as their boundaries emerge (see Fig. 3).
INC Development and Areal Boundaries
Patterns of INCs can be used to determine the boundaries of sensory and motor regions in the cortex (Huffman et al. 2004). This method is particularly useful in determining boundaries in the embryonic and newborn neocortex as other methods, such as electrophysiology, are not amenable in very young mice. The retrogradely labeled cell groups stemming from sensory and motor DPLs have very broad boundaries early on, but by P3, the boundaries between motor and sensory regions have narrowed, indicating that although neocortical tangential INCs continue to develop and change throughout the life of the mouse, the adult pattern appears as early as P3 (Fig. 3A–F). These INC reconstructions allow us to define early areal boundaries (Fig. 3A′–F′) and aid in the coregistration of these boundaries with gene expression in this and the companion report (II).
Early Development of Neocortical Gene Expression and Arealization in Mouse
This dual-report study represents the first comprehensive correlation of neocortical areal boundaries with neocortical gene expression patterns in embryonic to adult mice. During this time, many genes are expressed in the neocortex; however, the 7 genes examined here have previously been implicated in neocortical development in general, and arealization in particular, by the author and others, due mostly to their graded or regional expression and data from genetically altered mice (see Introduction). The expression patterns of COUP-TFI, Id2, Lhx2, RZRß, Cad8, EphA7, and EphrinA5 were examined at the following murine ages: E13.5, E14.5, E16.5, E18.5, P0, and P3 (older ages are presented in the companion report, II). For each gene, at each age, a series of coronal sections, a single sagittal section, and a reconstruction of putative cortical areas coregistered with the expression gradients (gene map) are shown. The boundaries of cortical areas are determined using INCs (Fig. 3). At E13.5 only 3 of 7 genes examined are expressed in the developing neocortex and by E14.5, this number increases to 4. E16.5 marks the beginning of what we term the APP, when there is a significant change in gene expression with 6 of the 7 genes examined expressed in the developing cortex. Beginning at E18.5, and continuing through P3, all 7 genes examined are expressed in the neocortex. In order to facilitate the comparison of expression patterns of “different” genes at the “same” age, we have included additional figures as Supplementary Material (Supplementary Figs 2–7).
COUP-TFI
At 13.5 and E14.5, COUP-TFI is expressed in a lateral to caudolateral gradient, with the strongest expression in the caudolateral region of the cortical plate (Fig. 4A1–A6 and B1–B6, arrows in A4, B4). At these early ages, COUP-TFI expression appears to avoid the putative somatomotor and visual areas (Fig. 4A6, B6, “gene map” gradient abuts lateral boundaries of r, rostral area, and c, caudal). At E16.5 and E18.5, COUP-TFI is still expressed in a rostrolateral to high caudal gradient (Fig. 4C1–C6 and D1–D6, arrows in C4–C5 and D4–D5) that coregisters with putative auditory cortex, overlaps with the putative visual area, and abuts the lateral somatomotor areal boundary (Fig. 4C6–D6). COUP-TFI expression at P0 expands and the gradient remains unchanged (Fig. 4E1–E6, arrows). Unlike previous ages, the gene map for COUP-TFI at P0 coregisters with much of the motor area and overlaps the lateral half of putative somatosensory cortex (Fig. 4E6). By P3, COUP-TFI expression displays expanded and more complex multilaminar patterns; however, the gradient is maintained (Fig. 4F1–F6, arrows).
Id2
Id2 is weakly expressed in the lateral cortex at E13.5, with a rostral-to-caudal gradient present outside the early boundaries of putative somatomotor (r, rostral) and visual areas (c, caudal, Fig. 5A1–A6, arrow in A2). Id2 is expressed more strongly at E14.5 in a gradient that is high both rostromedially and caudolaterally (Fig. 5B1–B6, arrows). At E16.5, Id2 is strongly expressed along the midline with a high rostral to low caudal gradient (Fig. 5C1–C6, arrow in C5) and a medial to lateral gradient is observed (Fig. 5C2, arrow). The gene map for Id2 expression shows a correlation with lateral boundaries of motor, somatosensory, and auditory regions (Fig. 5C6). Id2 expression at E18.5 has more laminar variations, highlighting the emergence of distinct lamina (Fig. 5D1–D6) and the gradient shifts to low rostral to high caudal (Fig. 5D5, arrow). The midline expression remains highest caudally at E18.5 (Fig. 5D4, D5, arrows). Id2 coregisters with multiple areas at E18.5 and P0 (Fig. 5D6, E6). At P0, there is a high medial to low lateral gradient rostrally (Fig. 5E1, arrow); this pattern reverses in the caudal cortex (Fig. 5E3, arrows). At P3, rostral expression of Id2 is limited to superficial layers (Fig. 5F1, medial arrow). The medial lateral gradient can be observed rostrally (Fig. 5F1, arrows), and there is also strong medial expression caudally (Fig. 5F5, arrow). A distinct absence of expression is seen in the superficial layers at the location the developing barrels at P3 (Fig. 5F3, medial arrow), and a lateral region of expression coregisters with putative auditory cortex (Fig. 5F3–F4, arrows, F6).
Lhx2
At E13.5 and E14.5, Lhx2 is weakly expressed caudomedially and along the dorsal midline, with very strong expression within the medial wall from which the cingulate cortex and hippocampal formation will later emerge (Fig. 6A1–A6,B1–B6, arrows). At these young ages, there is a faint medial–lateral gradient that avoids the rostral region (r, rostral area) where motor cortex will later emerge. The expression boundary coregisters with putative visual cortex (c, caudal area) and shares its lateral boundary (Fig. 6A6,B6). At E16.5, Lhx2 is expressed in a gradient within the medial wall and caudal medial cortex (Fig. 6C5, arrow) and is observed caudolaterally (Fig. 6C3–C4, arrows). The gene map demonstrates how Lhx2 expression coregisters with putative auditory and visual cortical areas (Fig. 6C6). Although expression remains strong in the hippocampal formation, medial wall Lhx2 expression is decreased at E18.5 (Fig. 6D3, arrow). Also at this age, a gradient of expression coregisters with putative auditory cortex and overlaps with putative somatosensory and visual cortices (Fig. 6D1–D6). Although expressed rostrally at P0 (Fig. 6E1, arrow), a distinct caudolateral region of Lhx2 expression is present (Fig. 6E3,E4, arrows) that corresponds to putative auditory cortex (Fig. 6E6). Differing from earlier ages, Lhx2 expression coregisters with both putative motor and somatosensory cortices at P0 (Fig. 6E6). At P3, Lhx2 is expressed rostrally with high levels of expression within the developing barrel field (Fig. 6F3, arrow). A region of strong caudal Lhx2 expression remains (Fig. 6F4, arrow). Laterally, a low rostral to high caudal gradient is seen (Fig. 6F5, arrow). Although the gradient spans the majority of the neocortex at P3, some regions of high expression appear to register with sensory areas (Fig. 6F3, arrow [somatosensory], and F4, arrow [visual], F6).
RZRß
RZRß transcripts were not consistently detected in the neocortex at E13.5 or E14.5 (Fig. 7A1–A6,B1–B6). However, at E16.5, RZRß is expressed in a high rostral to low caudolateral gradient (Fig. 7C1–C6,C5, arrow). In the most rostral cortex, a medial to lateral gradient can also be observed (Fig. 7C2, arrow). RZRß expression at this age coregisters with putative somatomotor and auditory areas, approximately sharing both medial and lateral boundaries (Fig. 7C6). RZRß expression gradient at E18.5 coregisters with putative auditory cortex, overlaps putative motor, somatosensory areas, and abuts the lateral boundary of the putative visual area (Fig. 7D2,D5, arrows, D6). The gradient remains at P0 with some differential expression correlating with somatosensory and auditory cortical areas (Fig. 7E1–E5, arrows). When collapsed across layers, RZRß expression at P0 overlaps all 3 putative sensory areas but mostly avoids putative motor cortex, as shown on the gene map (Fig. 7E6). This pattern persists at P3 (Fig. 7F6), where transcripts are clearly observed in the barrel field as the barrels are beginning to emerge (Fig. 7F2,F5, arrows).
Cad8
At E13.5, neocortical Cad8 expression was not consistently observed in our study (Fig. 8A1–A6). However, a weak rostral–caudal Cad8 gradient is present at E14.5 (Fig. 8B1–B5, arrows); the rostral portion of this gradient coregisters with the putative somatomotor area (r, rostral) and abuts the lateral boundary of the putative visual region (c, caudal, Fig. 8B6). At E16.5, cortical Cad8 expression remains low but is present within the middle–lateral portion of the cortex (Fig. 8C1–C5, arrow), coregistering with putative auditory cortex and abutting putative visual cortex, while overlapping the somatomotor region (Fig. 8C6). A dramatic change in Cad8 expression is observed at E18.5 where transcripts are found along the medial cortex, in a rostral to caudal gradient (Fig. 8D1–D5, arrow in D2). There is also a slight medial–lateral gradient (Fig. 8D3, arrow). Expression coregisters with putative motor, somatosensory, and visual areas and abuts the medial boundary of auditory cortex (Fig. 8D6). At P0, Cad8 is strongly expressed along the midline in a medial to lateral gradient (Fig. 8E2,E5, arrows) that coregisters and shares areal borders with the putative motor, somatosensory, and visual areas but abuts the medial boundary of the putative auditory area (Fig. 8E6). Cad8 expression at P3 is similar in position and coregistration to that observed previously, although there is increased laminar distinction and a high rostral to low middle to high caudal gradient (Fig. 8F1–F6; F1,F3–F5, arrows). Moving laterally, expression is negative (weak) at the emerging location of the somatosensory barrel field (Fig. 8F2, arrow).
EphA7
EphA7 transcripts were not detected consistently until E16.5, where expression is weak (Fig. 9C1–C5, arrows). EphA7 expression coregisters with putative auditory cortex and overlaps with the putative somatomotor region, while abutting the putative visual cortex area laterally (Fig. 9C6). EphA7 expression at E18.5, although not strong, is present in 2 distinct regions (Fig. 9D2,D4, arrows) that have a “island” of weak to no expression between them where the somatosensory barrel field will emerge (Fig. 9D5, arrows). At this age, coregistration is seen with the putative motor, somatosensory, and auditory areas (Fig. 9D6). At P0, EphA7 expression coregisters with the putative motor cortex and overlaps the visual cortical region, avoiding the developing barrel field within the somatosensory cortex (Fig. 9E1–E6, arrows). Expression at P3 is similar to that at P0 (Fig. 9F1–F6, arrows), exhibiting coregistration with putative motor and visual cortex; however, expression is more differentiated across lamina, as with the previous genes.
EphrinA5
We were not able to reliably detect EphrinA5 transcripts in the mouse neocortex until E18.5 (Fig. 10D1–D6) where a patch of expression is observed in the location of the putative barrel field (Fig. 10D3,D5, arrows). This expression boasts a slight caudal to rostral gradient and abuts the rostral boundaries of putative visual and auditory areas (Fig. 10D6). At P0, EphrinA5 is expressed in 2 distinct regions in the cortex (Fig. 10E1–E4, arrows, E6) including the emerging barrel field (Fig. 10E5, arrow). EphrinA5 coregisters with both putative somatosensory and auditory cortical areas, and extends caudally into putative visual cortex (Fig. 10E6). EphrinA5 expression at P3 extends caudally to the level of the rostral hippocampus (Fig. 10F1–F3, arrows, and F5, arrow), and as at P0, low expression is observed within the putative visual cortex (Fig. 10F4, arrow). Expression remains strong in the putative location of the barrel fields (Fig. 10F5, arrow, F6, stars). As shown on the gene map, a shared boundary exists laterally with somatosensory cortex (Fig. 10F6).
Relating Development of INCs to Gene Expression
By combining our flattened reconstructions of INCs, areal boundaries and gene expression in Figures 4–10, we describe the correlative relationships of genes and areas, as well as how areal boundaries and gene expression patterns change over time. In Figure 11, we demonstrate correlations of INCs with gene expression in actual tissue sections, rather than in 2d reconstructions, to further support our hypothesis that INC development, gene expression, and arealization are related. We focused this analysis at P0, to allow comparisons with data obtained from studies of mutant mice. The location of putative motor cortex is positively correlated with Cad8 expression and negatively correlated with RZRß expression, demonstrating a clear boundary (Fig. 11A1–A3, arrows at boundary). Likewise, putative somatosensory cortex (Fig. 11B1 between arrows) is positively correlated with EphrinA5 expression and negatively correlated with EphA7 expression (Fig. 11B1–B3, arrows at boundaries). Putative auditory cortex at P0 coregisters with Lhx2 expression, and this region is negative for Cad8 (Fig 11C1–C3, arrows at boundary). Finally, a medial region of putative visual cortex (Fig. 11D1 between arrows) is positively correlated with layer 2/3 expression of Id2 medially, and overlaps the “weaker” region of COUP-TFI expression (Fig. 11D1–D3, arrows at boundaries).
Figure 11.

A coregistration of INCs and gene expression at P0; 100-μm coronal DiI sections shown alongside adjacent in situ hybridization sections, with dorsal up, lateral to the right. A1–A3: DPL and INCs in rostral–medial cortex demonstrate the location of putative motor cortex (A1), the boundaries of which coregister with opposing expression boundaries of Cad8 (A2) and RZRß (A3). B1–B3: DPL and INCs in rostral cortex demonstrate the location of the rostral portion of putative somatosensory cortex (B1), the boundary of which coregisters with the EphrinA5 (B2) and the opposing EphA7 (B3) expression boundaries. C1–C3: DPL and INCs in lateral cortex demonstrate the location of putative auditory cortex (C1), the boundary of which coregisters with complementary boundaries of Lhx2 (C2) and Cad8 (C3) expression. D1–D3: DPL and INCs in medial cortex demonstrate the location of putative rostral–medial visual cortex (D1), which coregisters with complementary boundaries of Id2 (D2) and COUP-TFI (D3) expression. Arrows in A1–3, B1–3, C1–3, and D1–3 indicate the rostral–lateral boundary of putative motor cortex, the medial and lateral boundaries of putative rostral somatosensory cortex, the medial boundary of putative auditory cortex, and the medial and lateral boundaries of the rostral portion of putative visual cortex, respectively. Scale bar =1 mm.
A summary of INC data, along with flattened, lateral view reconstructions of gene expression data, by age, are illustrated together to highlight possible cooperative functions among multiple genes (Fig. 12). Gene expression patterns are particularly dynamic and complex from E16.5 to P3, during the APP. Most likely, multiple genes in combination with one another, rather than simple one gene-one area relationships, provide relevant information and perhaps code for the position of areas in the cortex as well as regulate the timing of their development (Fig. 12). In many cases, gene expression patterns overlap (such as COUP-TFI, Id2, Lhx2, and Cad8 at E14.5), in others, they contradict each other, forming a boundary (such as EphrinA5 and EphA7 in rostral cortex at E18.5–P3). This analysis has allowed us to visualize not only how these multiple patterns overlap and abut one another, but also how they relate together to the developing area boundaries (Fig. 12A″–F″). In summary, our results: 1) demonstrate that tangential INCs develop sooner than previously thought (Huffman et al. 2004); 2) suggest that gradients and regional expression of genes during the APP are critically involved in the development of INCs and subsequently in arealization; and 3) suggest that the genetic code that facilitates this development is not a simple one-gene/one-area code, but rather a complex network of opposing and cooperative molecular forces.
Figure 12.
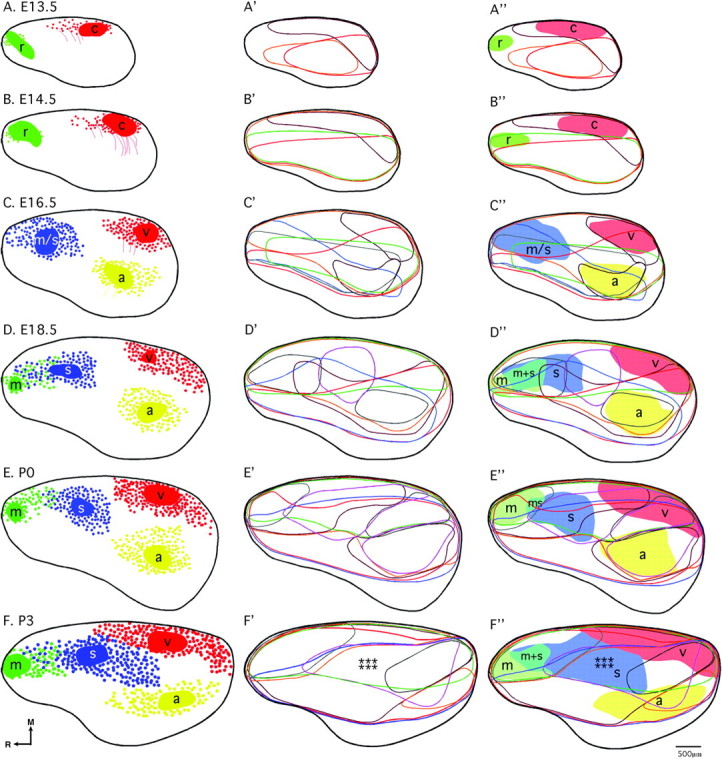
INC and gene expression relationships revealed by a novel, flattened reconstruction approach. Analysis of the relationships between INCs and neocortical gene expression was conducted through design of flattened reconstructions of INCs (A–F), and gene expression patterns (A′–F′) and coregistrations of the 2 data sets (A''–F''), where putative areal boundaries are shaded. In all 3 columns, similar ages are presented from left to right as follows: A–A'', E13.5; B–B'', E14.5; C–C'', E16.5; D–D'', E18.5; E–E'', P0; F–F'', P3. A–F (colored patches= DPL plus dye spread; red filled circles = retrogradely labeled cells in putative caudal/visual cortex; thin colored lines = processes; green filled circles= retrogradely labeled cells in putative rostral/motor cortex; blue filled circles: retrogradely labeled cells in putative motor/somatosensory or somatosensory cortex; yellow filled circles = retrogradely labeled cells in putative auditory cortex; thick black line = hemisphere outline). In A'–F' and A''–F'', the flattened, reconstructed expression of each gene is represented by a colored line as follows: COUP-TFI, red; Id2, orange; Lhx2, burgundy; RZRß, blue; Cad8, green; EphA7, gray; EphrinA5, purple. The pastel shaded regions in A''–F'' denote putative area boundaries of sensory and motor areas, determined from the patterns of INCs, as labeled (r, putative rostral area; c, putative caudal area; m, putative motor cortex; m + s, putative sensory-motor amalgam; m/s or s, putative motor/somatosensory or somatosensory cortex; a, putative auditory cortex; v, putative visual cortex). Stars denote location of putative barrel field. Oriented medial (M) up and rostral (R) to the left. Scale bar = 500μm.
Discussion
In our dual-report study, we present a developmental analysis of INCs among multiple sensory and motor regions along with detailed assays of expression patterns of 7 genes thought to be involved in arealization. We use INCs to inform us about areal boundaries as they develop and change and relate global patterns of gene expression to these data. In this first report, we discuss the development of INCs through P3, and how gene expression patterns at corresponding murine ages relate to INC development and arealization.
Early Development of Ipsilateral INCs in Mouse
This study represents the first lifespan analysis of INCs in any species. E13.5 marks the emergence of tangential connections in mouse neocortex with a small enhancement of this pattern observed at E14.5 (Fig. 12A,B). A dramatic change is observed at E16.5, with a significant growth of new connections stemming from rostral, caudal, and lateral dye placements (Fig. 12C), where 3 major putative neocortical areas: motor/somatosensory, visual and auditory will emerge. By E18.5, the brain has increased in size allowing separate motor and somatosensory dye placements, revealing early evidence of the sensory–motor amalgam (Fig. 12D), which has been described in rodents (Hummelsheim and Wiesendanger 1985). Although early boundaries of the motor and sensory areas are emerging, there are regions of cortical tissue where no labeled cells, or “gaps,” between putative areal boundaries are observed (Fig. 12D, white areas). It is possible that by E18.5, the primary areas (motor, somatosensory, visual, and auditory) are present, and INCs observed are intraprimary at this stage. The gaps may be the regions where secondary and tertiary areas will later develop. By P0, these gaps are reduced (Fig. 12E) and by P3, nearly eliminated (Fig. 12F). The positions of INCs and sensory/motor domains at P3 are similar to what is observed in the adult at P50 (Fig. 12F, see companion report, II). Here, we translate the patterns of INCs into emerging sensory and motor areas, using the extent of tracing as putative areal boundaries (Figs 3A′–F′ and 12A″–F″) and demonstrate the first observation of the barrel field (Figs 3F′ and 12F″ stars) at P3 near the end of the APP.
An Intrinsically Regulated Model of Neocortical Arealization
Consistent with Rakic's Protomap hypothesis proposed over 20 years ago, recent results have shown that the developing neocortex is “patterned” early in development, prior to the onset of sensory activity, with differential expression of genes during regionalization or arealization (Rakic 1988; Donoghue and Rakic 1999; Miyashita-Lin et al. 1999; Nakagawa et al. 1999; Bishop et al. 2000; Liu et al. 2000; Zhou et al. 2001; Fukuchi-Shimogori and Grove 2003; Garel et al. 2003; Nakagawa and O'Leary 2003; Yun et al. 2003; Funatsu et al. 2004; Hamasaki et al. 2004; Huffman et al. 2004; Shimogori et al. 2004; Abu-Khalil et al. 2004; Sansom et al. 2005; Mallamaci and Stoykova 2006; Cholfin and Rubenstein 2008; for review see Rubenstein et al. 1999; Ragsdale and Grove 2001; Ruiz i Altaba et al. 2001; and Cecchi 2002; O'Leary et al. 2007; O'Leary and Sahara 2008; Rakic et al. 2009). For example, neocortical gene expression patterns are unperturbed in mutant mice lacking thalamocortical inputs and thus sensory input from the periphery (Miyashita-Lin et al. 1999; Nakagawa et al. 1999). It has been postulated that patterning centers in the midline of the developing telencephalon have a primary role in regulating neocortical regionalization (Rubenstein et al. 1999; Fukuchi-Shimogori and Grove 2001; Crossley et al. 2001; Fukuchi-Shimogori and Grove 2003; Huffman et al. 2004; Sansom et al. 2005). A dorsal patterning center expresses high levels of Bmp and Wnt genes, and mutations in both genes disrupt neocortical development (Furuta et al. 1997; Grove et al. 1998; Lee et al. 2000; Shimogori et al. 2004). Additionally, mutant mice with reduced signaling of FGF8, expressed in the rostro-dorsal midline of the telencephalon, indicate a requirement for this gene in the development of intraneocortical connectivity and neocortical areas (Fukuchi-Shimogori and Grove 2001, 2003; Garel et al. 2003; Huffman et al. 2004; Shimogori and Grove 2005).
In this study, we examined the expression patterns of 7 genes: COUP-TFI, Id2, Lhx2, RZRß, Cad8, EphA7, and EphrinA5. These genes are hypothesized to regulate arealization due to their regional expression in early neocortical tissue, and in some cases, such as with COUP-TFI, due to observed alterations in the neocortex of the mutant mouse. For example, the conditional COUP-TFI mutant mouse exhibits a defect in neocortical patterning in that the primary sensory areas are reduced in size and compressed in the caudal cortex (Armentano et al., 2007). Also, the EphA7−/− and EphrinA5−/− mice show a reduction in the size of somatosensory cortex, and this effect is further exacerbated in the double mutant (Miller et al. 2006). There is also a neocortical phenotype in the Lhx2 conditional mutant, where only 3 of 6 cortical layers form during development (Chou et al. 2009).
The APP: INCs, gene expression, and arealization
In this report, we present the idea that features of neocortical areas are determined through intrinsic mechanisms, such as early gene expression, as well as extrinsic, activity-dependent mechanisms during a fairly restricted period of time in mouse development. We suggest that the APP begins around E16.5 in the mouse. This developmental starting point was chosen initially on the superfluity of INCs observed at E16.5 and supported by an analysis of gene expression data. We do not suggest that this is the initial starting point at which all features of neocortical areas arise; however, it appears to represent a developmental time when common features of areal boundaries emerge and patterns of gene expression increase dramatically in complexity. Although tangential INCs are present at E13.5, and 3/7 genes are expressed at that time, the INCs are few, and the overall gene expression is diffuse and weak, whereas by E16.5, distinct cortical areas can begin to be discerned from the INC data, and many of the genes at E16.5 are expressed in discrete locations that coregister with these putative boundaries (Fig. 12A″–C″). From E16.5 to P3, we see a clear stepped progression from the initial pattern of INCs, where putative areal boundaries are separated by gaps at E16.5, to a near adult-like pattern where sensory domains abut one another, as demonstrated by INCs of 4 sensory and motor areas at P3 (Fig. 12C–F). This is likely to result initially from the early development (E16.5) of primary sensory and motor areas, then to the development of primary and secondary areas, where boundary expansion occurs at E18.5/P0, then finally to the development of primary, secondary, and tertiary sensory areas at P3, where the apparent areal boundaries abut one other. The areas not labeled at P3 (Fig. 12F) remain unlabeled throughout adulthood (see companion report, II) and thus are likely to represent cortical areas of multisensory integration and higher level processing as the postmortem dyes used in this study are not multisynaptic.
Visual Cortex
Gene expression is dynamic during neocortical sensory and motor areal development, and certain relevant correlations between the 2 data sets emerge. Early on (E13.5–16.5), putative visual cortex is restricted to the Lhx2-positive zone of the cortex, avoiding the expression zones of other genes at its lateral boundary. However, a few days later (E18.5–P0), gene expression patterns within and around the putative visual area lose specificity, and expression does not consistently coregister with the visual area border (Fig. 12A″–F″). As the mammalian cortex develops from caudal to rostral, with the occipital lobe areas maturing first and the frontal lobe last (Kaas 1987), perhaps our results reflect this developmental order, as connections within the putative visual area appear first at E13.5, and the gene expression data show a lack of regional specificity/border coregistration in the caudal cortex by E18.5 (Fig. 12A″–F″ and Table 1).
Table 1.
Summary of coregistration of gene expression and cortical areas
| Motor Cx (m) | Somato Cx (s) | Visual Cx (v) | Auditory Cx (a) | |
| E13.5 (3/7 GE) | r: None | NA | c: | NA |
| COUP-TFI−* | ||||
| Id2− | ||||
| Lhx2+* | ||||
| E14.5 (4/7 GE) | r: | NA | c: | NA |
| COUPTFI−* | COUPTFI−* | |||
| Id2+ | Id2+ | |||
| Lhx2− | Lhx2+* | |||
| Cad8+* | Cad8−* | |||
| E16.5 (6/7 GE) | COUPTFI−* | COUPTFI−* | COUPTFI+ | COUPTFI+* |
| Id2+* | Id2+* | Id2+ | Id2+* | |
| Lhx2− | Lhx2− | Lhx2+* | Lhx2+* | |
| RZRß+ | RZRß+ | RZRß− | RZRß+ | |
| Cad8+ | Cad8+ | Cad8−* | Cad8+* | |
| EphA7+ | EphA7+ | EphA7−* | EphA7+* | |
| E18.5 (7/7 GE) | COUPTFI−* | COUPTFI−* | COUPTFI+ | COUPTFI+ |
| Id2+* | Id2+ | Id2+ | Id2+* | |
| Lhx2−* | Lhx2+ | Lhx2+ | Lhx2+* | |
| RZRß+ | RZRß+ | RZRß− | RZRß+ | |
| Cad8+* | Cad8+* | Cad8+* | Cad8−* | |
| EphA7+* | EphA7+* | EphA7− | EphA7+* | |
| EphrinA5− | EphrinA5+ | EphrinA5−* | EphrinA5−* | |
| P0 (7/7 GE) | COUPTFI+ | COUPTFI+ | COUPTFI+ | COUPTFI+ |
| Id2+ | Id2+ | Id2+ | Id2+* | |
| Lhx2+ | Lhx2+ | Lhx2+ | Lhx2+* | |
| RZRß+ | RZRß+ | RZRß+ | RZRß+ | |
| Cad8+* | Cad8+* | Cad8+ | Cad8−* | |
| EphA7+* | EphA7−* | EphA7+ | EphA7−* | |
| EphrinA5−* | EphrinA5+* | EphrinA5+ | EphrinA5+* | |
| P3 (7/7 GE) | COUPTFI+ | COUPTFI+ | COUPTFI+ | COUPTFI+* |
| Id2+* | Id2+ | Id2+ | Id2+ | |
| Lhx2+ | Lhx2+ | Lhx2+ | Lhx2+ | |
| RZRß+ | RZRß+ | RZRß+ | RZRß+* | |
| Cad8+* | Cad8+* | Cad8+ | Cad8−* | |
| EphA7+* | EphA7+ | EphA7+ | EphA7−* | |
| EphrinA5−* | EphrinA5+* | EphrinA5+ | EphrinA5+ |
Note: Cx, cortex; GE, genes expressed; r, early rostral area; NA, cortical area not defined at this age; c, early caudal area; m, putative motor area; s, putative somatosensory area; v, putative visual area; a, putative auditory area. A summary of the coregistration of information for gene expression of COUP-TFI, Id2, Lhx2, Cad8, EphA7, EphrinA5, and RZRß and arealization as gauged by INCs. Far left column 1: age (E13.5–P3) and number of genes under study expressed at that age (n/7). Columns 2–5: coregistration data for putative motor, somatosensory, visual, and auditory cortex, respectively. Within each box: all 7 genes are noted with “+” or “−” to indicate if the area in question is found to be overlapping (+) or nonoverlapping (−) with gene expression and “*” denotes whether a gene expression boundary is adjacent to or abuts a cortical area boundary. Gene expression/areal boundary coregistration differs for the 4 regions: caudal visual boundary coregistration occurs mostly at earlier ages (E.13.5–18.5), caudolateral auditory boundary coregistration occurs later (E16.5–P0), and motor/somatosensory area boundary coregistration occurs (E18.5–P3), indicating a role of gene expression in the caudal to rostral development of the cortex.
Auditory Cortex
As with visual cortex, early on this putative area is almost perfectly correlated with a region of strong Lhx2 expression (E16.5, Fig. 12C″). Additionally, this putative auditory area shares its lateral boundary with the COUP-TFI−, Id2−, Cad8−, EphA7-, and RZRß-positive zones (Fig. 12C″). The specificity of the early gene expression of this caudal region corresponds to what we observed for visual cortex. However, as expected based on its lateral position, auditory cortex continues to share boundaries with gene expression a few days beyond visual cortex (E18.5–P0), but by P3, the pattern appears less specific (Fig. 12D″–F″ and Table 1).
Rostral Neocortex: Motor and Somatosensory
Unlike visual and auditory areas, early ages (E13.5–E16.5) do not demonstrate a great deal of coregistration between INCs and gene expression; however, by E18.5, much of the putative motor and somatosensory areas are restricted to the rostral EphA7-positive zone, with the caudal portion of the somatosensory area overlapping the EphrinA5 region. The lateral boundaries of putative motor and sensory areas coregister or abut expression zones of several genes, including EphA7, Cad8, Id2, RZRß, and COUP-TFI, which may be involved in the establishment/maintenance of the boundary at this age up to P3 (Fig. 12D″–F″ and Table 1). The RZRß- and EphrinA5-positive zones encompass the emerging barrel field at P3 (Fig. 12F″, stars, and Figs 7 and 10F6). Contrary to what is observed for the caudal cortex, the expression of genes at the boundaries of motor and somatosensory cortex demonstrate more complex patterns later in development, further supporting the role of gene expression in the progression of caudal to rostral neocortical development (Table 1).
In summary, this study provides a description of the development of ipsilateral INCs of multiple sensory and motor regions from E12.5 to P3 in the mouse. The analysis of these connections, which represent a cardinal feature of neocortical area development, has led to our initial description of the APP beginning near E16.5 and ending around P3, when other hallmark cortical features such as 6-layered cortex and the somatosensory barrel field emerge in development. In addition, our study surveyed gene expression of 7 genes at ages ranging from E13.5 to P3, with later ages of both data sets analyzed in the companion paper (II). Our novel analysis of gene expression includes the creation of graded gene maps, where developing areal boundaries are correlated with genetic patterns and 2D multigene overlays, both of which have greatly added to our understanding of 1) which genes or combinations of genes may be intrinsically coding for area identity, 2) when in development this coding for different sensory and motor regions may be taking place, and 3) where specific boundaries of putative areas correlate with boundaries of gene expression. This report, along with the companion report, provides a lifespan analysis of ipsilateral INCs and neocortical gene expression in the mouse.
Funding
National Institutes of Mental Health (5R03MH080502-02 to K.J.H.)
Supplementary Material
Supplementary Figures 1–7 and other supplementary materials can be found at: http://www.cercor.oxfordjournals.org/
Acknowledgments
Conflict of Interest: None declared.
References
- Abu-Khalil A, Fu L, Grove EA, Zecevic N, Geschwind DH. Wnt genes define distinct boundaries in the developing human brain: implications for human forebrain patterning. J Comp Neurol. 2004;474:276–288. doi: 10.1002/cne.20112. [DOI] [PubMed] [Google Scholar]
- Armentano M, Chou SJ, Tomassy GS, Leingärtner A, O'Leary DD, Studer M. COUP-TFI regulates the balance of cortical patterning between frontal/motor and sensory areas. Nat Neurosci. 2007;10:1277–1286. doi: 10.1038/nn1958. [DOI] [PubMed] [Google Scholar]
- Auladell C, Pérez-Sust P, Supèr H, Soriano E. The early development of thalamocortical and corticothalamic projections in the mouse. Anat Embryol. 2000;201:169–179. doi: 10.1007/pl00008238. [DOI] [PubMed] [Google Scholar]
- Bai W, Ishida M, Okabe M, Arimatsu Y. Role of the protomap and target-derived signals in the development of intrahemispheric connections. Cereb Cortex. 2006;16:124–135. doi: 10.1093/cercor/bhi092. [DOI] [PubMed] [Google Scholar]
- Bishop K, Goudreau G, O'Leary DD. Regulation of area identity in the mammalian neocortex by Emx2 and Pax6. Science. 2000;288:344–349. doi: 10.1126/science.288.5464.344. [DOI] [PubMed] [Google Scholar]
- Cecchi C. Emx2: a gene responsible for cortical development, regionalization and area specification. Gene. 2002;291:1–9. doi: 10.1016/s0378-1119(02)00623-6. [DOI] [PubMed] [Google Scholar]
- Cholfin JA, Rubenstein JL. Frontal cortex subdivision patterning is coordinately regulated by Fgf8, Fgf17, and Emx2. J Comp Neurol. 2008;509:144–155. doi: 10.1002/cne.21709. [DOI] [PMC free article] [PubMed] [Google Scholar]
- Chou SJ, Perez-Garcia CG, Kroll TT, O'Leary DD. Lhx2 specifies regional fate in Emx1 lineage of telencephalic progenitors generating cerebral cortex. Nat Neurosci. 2009;12:1381–1389. doi: 10.1038/nn.2427. [DOI] [PMC free article] [PubMed] [Google Scholar]
- Crossley PH, Martinez S, Ohkubo Y, Rubenstein JL. Coordinate expression of Fgf8, Otx2, Bmp4, and Shh in the rostral prosencephalon during development of the telencephalic and optic vesicles. Neuroscience. 2001;108:183–206. doi: 10.1016/s0306-4522(01)00411-0. [DOI] [PubMed] [Google Scholar]
- Donoghue MJ, Rakic P. Molecular gradients and compartments in the embryonic primate cerebral cortex. Cereb Cortex. 1999;9:586–600. doi: 10.1093/cercor/9.6.586. [DOI] [PubMed] [Google Scholar]
- Faedo A, Tomassy GS, Ruan Y, Teichmann H, Krauss S, Pleasure SJ, Tsai SY, Tsai MJ, Studer M, Rubenstein JL. COUP-TFI coordinates cortical patterning, neurogenesis, and laminar fate and modulates MAPK/ERK, AKT, and beta-catenin signaling. Cereb Cortex. 2008;18:2117–2131. doi: 10.1093/cercor/bhm238. [DOI] [PMC free article] [PubMed] [Google Scholar]
- Fukuchi-Shimogori T, Grove EA. Neocortex patterning by the secreted signaling molecule FGF8. Science. 2001;294:1071–1074. doi: 10.1126/science.1064252. [DOI] [PubMed] [Google Scholar]
- Fukuchi-Shimogori T, Grove EA. Emx2 patterns the neocortex by regulating FGF positional signaling. Nat Neurosci. 2003;6:825–831. doi: 10.1038/nn1093. [DOI] [PubMed] [Google Scholar]
- Funatsu N, Inoue T, Nakamura S. Gene expression analysis of the late embryonic mouse cerebral cortex using DNA microarray: identification of several region- and layer-specific genes. Cereb Cortex. 2004;14:1031–1044. doi: 10.1093/cercor/bhh063. [DOI] [PubMed] [Google Scholar]
- Furuta Y, Piston DW, Hogan BL. Bone morphogenic proteins (BMPs) as regulators of dorsal forebrain development. Development. 1997;124:2203–2212. doi: 10.1242/dev.124.11.2203. [DOI] [PubMed] [Google Scholar]
- Garel S, Marín F, Grosschedl R, Charnay P. Ebf1 controls early cell differentiation in the embryonic striatum. Development. 1999;126:5285–5294. doi: 10.1242/dev.126.23.5285. [DOI] [PubMed] [Google Scholar]
- Garel S, Huffman KJ, Martin G, Rubenstein JL. Molecular regionalization of the neocortex is disrupted in Fgf8 hypomorphic mutants. Development. 2003;130:1903–1914. doi: 10.1242/dev.00416. [DOI] [PubMed] [Google Scholar]
- Godement P, Vanselow J, Thanos S, Bonhoeffer F. A study in developing visual systems with a new method of staining neurones and their processes in fixed tissue. Development. 1987;101:697–713. doi: 10.1242/dev.101.4.697. [DOI] [PubMed] [Google Scholar]
- Grove EA, Fukuchi-Shimogori T. Generating the cerebral cortical area map. Annu Rev Neurosci. 2003;26:355–380. doi: 10.1146/annurev.neuro.26.041002.131137. [DOI] [PubMed] [Google Scholar]
- Grove EA, Tole S, Limon J, Yip L, Ragsdale CW. The hem of the embryonic cerebral cortex is defined by the expression of multiple Wnt genes and is comprimised in Gli3-deficient mice. Development. 1998;125:2315–2325. doi: 10.1242/dev.125.12.2315. [DOI] [PubMed] [Google Scholar]
- Hamasaki T, Leingartner A, Ringstedt T, O'Leary DD. EMX2 regulates sizes and positioning of the primary sensory and motor areas in neocortex by direct specification of cortical progenitors. Neuron. 2004;43:359–372. doi: 10.1016/j.neuron.2004.07.016. [DOI] [PubMed] [Google Scholar]
- Hawrylycz M, Bernard A, Lau C, Sunkin SM, Chakravarty MM, Lein ES, Jones AR, Ng L. Areal and laminar differentiation in the mouse neocortex using large scale gene expression data. Methods. 2010;50:113–121. doi: 10.1016/j.ymeth.2009.09.005. [DOI] [PubMed] [Google Scholar]
- Huffman KJ, Garel S, Rubenstein JL. Fgf8 regulates the development of intra-neocortical projections. J Neurosci. 2004;24:8917–8923. doi: 10.1523/JNEUROSCI.2086-04.2004. [DOI] [PMC free article] [PubMed] [Google Scholar]
- Huffman KJ, Molnar Z, Van Dellen A, Kahn D, Blakemore C, Krubitzer L. Formation of cortical fields on a reduced cortical sheet. J Neurosci. 1999;19:9939–9952. doi: 10.1523/JNEUROSCI.19-22-09939.1999. [DOI] [PMC free article] [PubMed] [Google Scholar]
- Hummelsheim H, Wiesendanger M. Is the hindlimb representation of the rat's cortex a 'sensorimotor amalgam'? Brain Res. 1985;346:75–81. doi: 10.1016/0006-8993(85)91096-0. [DOI] [PubMed] [Google Scholar]
- Joshi PS, Molyneaux BJ, Feng L, Xie X, Macklis JD, Gan L. Bhlhb5 regulates the postmitotic acquisition of area identities in layers II–V of the developing neocortex. Neuron. 2008;60:258–272. doi: 10.1016/j.neuron.2008.08.006. [DOI] [PMC free article] [PubMed] [Google Scholar]
- Kaas JH. The segregation of function in the nervous system: why do sensory systems have so many subdivisions? Contrib Sens Physiol. 1982;7:201–240. [Google Scholar]
- Kaas JH. The organization of neocortex in mammals: implications for theories of brain function. Annu Rev Psychol. 1987;38:129–151. doi: 10.1146/annurev.ps.38.020187.001021. [DOI] [PubMed] [Google Scholar]
- Krubitzer L, Huffman KJ. Arealization of the neocortex in mammals: genetic and epigenetic contributions to the phenotype. Brain Behav. Evol. 2000;55:322–335. doi: 10.1159/000006667. [DOI] [PubMed] [Google Scholar]
- Kudo LC, Karsten SL, Chen J, Levitt P, Geschwind DH. Genetic analysis of anterior posterior expression gradients in the developing mammalian forebrain. Cereb Cortex. 2007;17:2108–2122. doi: 10.1093/cercor/bhl118. [DOI] [PubMed] [Google Scholar]
- Lee SM, Tole S, Grove E, McMahon AP. A local Wnt-3a signal is required for development of the mammalian hippocampus. Development. 2000;127:457–467. doi: 10.1242/dev.127.3.457. [DOI] [PubMed] [Google Scholar]
- Liu Q, Dwyer ND, O'Leary DD. Differential expression of COUP-TFI, CHL1, and two novel genes in developing neocortex identified by differential display PCR. J Neurosci. 2000;20:7682–7690. doi: 10.1523/JNEUROSCI.20-20-07682.2000. [DOI] [PMC free article] [PubMed] [Google Scholar]
- Mallamaci A, Stoykova A. Gene networks controlling early cerebral cortex arealization. Eur J Neurosci. 2006;23:847–856. doi: 10.1111/j.1460-9568.2006.04634.x. [DOI] [PubMed] [Google Scholar]
- Miller K, Kolk SM, Donoghue MJ. EphA7-ephrin-A5 signaling in mouse somatosensory cortex: developmental restriction of molecular domains and postnatal maintenance of functional compartments. J Comp Neurol. 2006;496:627–642. doi: 10.1002/cne.20926. [DOI] [PubMed] [Google Scholar]
- Miyashita-Lin EM, Hevner R, Wassarman K, Martinez S, Rubenstein JL. Early neocortical regionalization in the absence of thalamic innervation. Science. 1999;285:906–909. doi: 10.1126/science.285.5429.906. [DOI] [PubMed] [Google Scholar]
- Molnar Z, Blakemore C. How do thalamic axons find their way to the cortex? Trends Neurosci. 1995;18:389–397. doi: 10.1016/0166-2236(95)93935-q. [DOI] [PubMed] [Google Scholar]
- Molnar Z, Blakemore C. Development of signals influencing the growth and termination of thalamocortical axons in organotypic culture. Exp Neurol. 1999;156:363–393. doi: 10.1006/exnr.1999.7032. [DOI] [PubMed] [Google Scholar]
- Nakagawa Y, Johnson JE, O'Leary DD. Graded and areal expression patterns of regulatory genes and cadherins in embryonic neocortex independent of thalamocortical input. J Neurosci. 1999;19:10877–10885. doi: 10.1523/JNEUROSCI.19-24-10877.1999. [DOI] [PMC free article] [PubMed] [Google Scholar]
- Nakagawa Y, O'Leary DD. Dynamic patterned expression of orphan nuclear receptor genes RORalpha and RORbeta in developing mouse forebrain. Dev Neurosci. 2003;25:234–244. doi: 10.1159/000072271. [DOI] [PubMed] [Google Scholar]
- O'Leary DD. Do cortical areas emerge from a protocortex? Trends Neurosci. 1989;12:401–406. doi: 10.1016/0166-2236(89)90080-5. [DOI] [PubMed] [Google Scholar]
- O'Leary DD, Chou SJ, Sahara S. Area patterning of the mammalian cortex. Neuron. 2007;56:252–269. doi: 10.1016/j.neuron.2007.10.010. [DOI] [PubMed] [Google Scholar]
- O'Leary DD, Ruff NL, Dyck RH. Development, critical period plasticity, and adult reorganizations of mammalian somatosensory systems. Curr Opin Neurobiol. 1994;4:535–544. doi: 10.1016/0959-4388(94)90054-x. [DOI] [PubMed] [Google Scholar]
- O'Leary DD, Sahara S. Genetic regulation of arealization of the neocortex. Curr Opin Neurobiol. 2008;18:90–100. doi: 10.1016/j.conb.2008.05.011. [DOI] [PMC free article] [PubMed] [Google Scholar]
- Pallas SL. Intrinsic and extrinsic factors that shape neocortical specification. Trends Neurosci. 2001;24:417–423. doi: 10.1016/s0166-2236(00)01853-1. [DOI] [PubMed] [Google Scholar]
- Piñon MC, Tuoc TC, Ashery-Padan R, Molnar Z, Stoykova A. Altered molecular regionalization and normal thalamocortical connections in cortex-specific Pax6 knock-out mice. J Neurosci. 2008;28:8724–8734. doi: 10.1523/JNEUROSCI.2565-08.2008. [DOI] [PMC free article] [PubMed] [Google Scholar]
- Ragsdale CW, Grove EA. Patterning the mammalian cerebral cortex. Curr Opin Neurobiol. 2001;11:50–58. doi: 10.1016/s0959-4388(00)00173-2. [DOI] [PubMed] [Google Scholar]
- Rakic P. Specification of cerebral cortical areas. Science. 1988;241:170–176. doi: 10.1126/science.3291116. [DOI] [PubMed] [Google Scholar]
- Rakic P, Ayoub AE, Breunig JJ, Dominguez MH. Decision by division: making cortical maps. Trends Neurosci. 2009;32:291–301. doi: 10.1016/j.tins.2009.01.007. [DOI] [PMC free article] [PubMed] [Google Scholar]
- Rice FL, Van der Loos H. Development of the barrels and barrel field in the somatosensory cortex of the mouse. J Comp Neurol. 1977;171:545–560. doi: 10.1002/cne.901710408. [DOI] [PubMed] [Google Scholar]
- Rubenstein JL, Anderson S, Shi L, Miyashita-Lin E, Bulfone A, Hevne R. Genetic control of cortical regionalization and connectivity. Cereb Cortex. 1999;9:524–532. doi: 10.1093/cercor/9.6.524. [DOI] [PubMed] [Google Scholar]
- Rubenstein JL, Rakic P. Genetic control of cortical development. Cereb Cortex. 1999;9:521–523. doi: 10.1093/cercor/9.6.521. [DOI] [PubMed] [Google Scholar]
- Ruiz i Altaba A, Gitton Y, Dahmane N. Embryonic regionalization of the neocortex. Mech Dev. 2001;107:3–11. doi: 10.1016/s0925-4773(01)00422-1. [DOI] [PubMed] [Google Scholar]
- Sansom SN, Hebert JM, Thammongkol U, Smith J, Nisbet G, Surani MA, McConnell SK, Livesey FJ. Genomic characterisation of a Fgf-regulated gradient-based neocortical protomap. Development. 2005;132:3947–3961. doi: 10.1242/dev.01968. [DOI] [PMC free article] [PubMed] [Google Scholar]
- Shimamura K, Hirano S, McMahon AP, Takeichi M. Wnt-1-dependent regulation of local E-cadherin and alpha N catenin expression in the embryonic mouse brain. Development. 1994;120:2225–2234. doi: 10.1242/dev.120.8.2225. [DOI] [PubMed] [Google Scholar]
- Shimogori T, Banuchi V, Ng HY, Strauss JB, Grove EA. Embryonic signaling centers expressing BMP, WNT and FGF proteins interact to pattern the cerebral cortex. Development. 2004;131:5639–5647. doi: 10.1242/dev.01428. [DOI] [PubMed] [Google Scholar]
- Shimogori T, Grove EA. Fibroblast growth factor 8 regulates neocortical guidance of area-specific thalamic innervation. J Neurosci. 2005;25:6550–6560. doi: 10.1523/JNEUROSCI.0453-05.2005. [DOI] [PMC free article] [PubMed] [Google Scholar]
- Sur M, Rubenstein JL. Patterning and plasticity of the cerebral cortex. Science. 2005;310:805–810. doi: 10.1126/science.1112070. [DOI] [PubMed] [Google Scholar]
- Vanderhaeghen P, Lu Q, Prakash N, Frisén J, Walsh CA, Frostig RD, Flanagan JG. A mapping label required for normal scale of body representation in the cortex. Nat Neurosci. 2000;3:358–365. doi: 10.1038/73929. [DOI] [PubMed] [Google Scholar]
- Yun ME, Johnson RR, Antic A, Donoghue MJ. EphA family gene expression in the developing mouse neocortex: regional patterns reveal intrinsic programs and extrinsic influence. J Comp Neurol. 2003;456:203–216. doi: 10.1002/cne.10498. [DOI] [PubMed] [Google Scholar]
- Zhou C, Tsai SY, Tsai MJ. COUP-TFI, an intrinsic factor for early regionalization of the neocortex. Genes Dev. 2001;15:2054–2059. doi: 10.1101/gad.913601. [DOI] [PMC free article] [PubMed] [Google Scholar]
Associated Data
This section collects any data citations, data availability statements, or supplementary materials included in this article.