

Abstract
The mammalian neocortex contains an intricate processing network of multiple sensory and motor areas that allows the animal to engage in complex behaviors. These anatomically and functionally unique areas and their distinct connections arise during early development, through a process termed arealization. Both intrinsic, activity-independent and extrinsic, activity-dependent mechanisms drive arealization, much of which occurs during the areal patterning period (APP) from late embryogenesis to early postnatal life. How areal boundaries and their connections develop and change from infancy to adulthood is not known. Additionally, the adult patterns of sensory and motor ipsilateral intraneocortical connections (INCs) have not been thoroughly characterized in the mouse. In this report and its companion (I), we present the first lifespan analysis of ipsilateral INCs among multiple sensory and motor regions in mouse. We describe the neocortical expression patterns of several developmentally regulated genes that are of central importance to studies investigating the molecular regulation of arealization, from postnatal day (P) 6 to P50. In this study, we correlate the boundaries of gene expression patterns with developing areal boundaries across a lifespan, in order to better understand the nature of gene–areal relationships from early postnatal life to adulthood.
Keywords: barrel cortex, connections, gene expression, postnatal neocortical development
Introduction
The mammalian neocortex is comprised of anatomically, physiologically, and functionally distinct areas. The precise interconnectivity of these areas allows multisensory and motor integration and facilitates the complexity of animal behavior. Fundamental features of this system are first established during embryonic development and are believed to be refined after birth. Mechanisms involved in the development of neocortical connections and the formation of discrete neocortical areas, a process termed arealization, are not fully understood and have been the topic of great debate, as described in the previous report (I). There is mounting evidence that molecular mechanisms within the developing neocortex play a major role in arealization but much less is understood regarding how these mechanisms may help maintain areal structure and function throughout postnatal life (for review, see Rubenstein et al. 1999; Ragsdale and Grove 2001; Ruiz i Altaba et al. 2001; Cecchi 2002; O'Leary et al. 2007; O'Leary and Sahara 2008; Rakic et al. 2009). Most neocortical expression patterns of genes relating to arealization have been described in the prenatal and perinatal mouse (see companion report I), and thus, a thorough survey of neocortical gene expression in the early postnatal to adult mouse is much needed to further our understanding of how gene expression changes over time. Additionally, prior to this report and its companion, no single study has provided a lifespan assay of the relationship between neocortical gene expression and areal development.
Previously, we have shown that ipsilateral intraneocortical connections (INCs), markers for areal development, are present in an adult-like pattern by postnatal day (P) 3 in the mouse (see companion report I); however, some cortical features, such as barrels, are still developing (Rice and Van der Loos 1977). Although general maps of the adult rodent neocortex have been generated (Wree et al. 1983) and detailed information is known about some of its subdivisions (Woolsey et al. 1975; Wagor et al. 1980; Metin et al. 1988; Stiebler et al. 1997; Shen et al. 1999; Tropea et al. 1999; Land and Erickson 2005; Crochet and Petersen 2006), the postnatal development and adult patterns of INCs of sensory and motor cortices have not been completely described. Additionally, in order to understand the potential role of gene expression in the postnatal “maintenance” of areal structure, function, and boundaries, we must characterize the changes in gene expression that occur in these cortical regions from infancy to adulthood. In the companion report, we have correlated development of INCs with patterns of gene expression in the embryonic and early postnatal mouse and have defined an areal patterning period (APP) that ends in early postnatal life (around P3). However, the subsequent developmental period is not static; it is a time of vast neocortical growth, cellular refinement, and behavioral development. One example of postnatal refinement and development is the critical period, which is thought to result from the interplay between the expression of genes in the sensory areas and the continued refinement of both inhibitory and excitatory input (Sur and Rubenstein 2005, Lyckman et al. 2008). Thus, the period from early postnatal life to adulthood is amenable to developmental analysis. Previous data suggest a genetic role in areal development (see companion report and Miyashita-Lin et al. 1999; Rubenstein and Rakic 1999; Rubenstein et al. 1999; Fukuchi-Shimogori and Grove 2001; Huffman et al. 2004; Shimogori et al. 2004; Armentano et al. 2007; O'Leary et al. 2007; Faedo et al. 2008), and data presented here suggest that continued expression of arealization genes may also be involved in maintaining boundaries or area features established in early development.
In this report, we characterize the development of ipsilateral INCs in developing sensory and motor neocortex in a specific time-course analysis in the wild-type mouse from P6 to P50 and use the patterns of connections to distinguish areal boundaries in the postnatal period, through adulthood. In parallel, using in situ hybridization, we have analyzed the timing and location of expression of genes implicated in the process of neocortical arealization to create “gene maps” within the postnatal neocortex (see companion paper I: COUP-TF1, Id2, Lhx2, RZRß, Cadherin-8, EphA7, and EphrinA5). We have chosen to study these genes as they have been previously implicated in arealization (Redies and Takeichi 1996; Redies 2000; Zhou et al. 2001; Bolz et al. 2004; Huffman et al. 2004; Cang et al. 2005; Miller et al. 2006; Armentano et al. 2007; Suter et al. 2007; Faedo et al. 2008; Mangale et al. 2008; Demyanenko et al. 2010). We coregistered genetic boundaries with cortical areal boundaries identified through the analysis of connections. These results support the notion that the expression of genes relevant to early development may play a role in the maintenance of cortical areal boundaries throughout postnatal life. Further elucidation of the relationships between gene expression and the refinement of cortical connections is crucial for the understanding of postnatal brain development, and we believe that this lifespan analysis represents a significant step toward this goal.
Materials and Methods
Mouse Colony
All breeding and experimental studies were conducted in strict accordance with protocol guidelines approved by the Institutional Animal Care and Use Committee at the University of California, Riverside. All mice were maintained in a CD1 background and originally purchased from Jackson Laboratories. For staging of pups, the day of birth was considered P0. For this dual-report study, we have selected mice at various ages representative of the embryonic period, the perinatal and newborn period, pubescence (around P30, Han et al. 2002), and what most consider postpubescent adulthood at or around P50 (P42–P56: Sandberg et al. 2000; Rietze et al. 2001; Guan et al. 2006; Lein et al. 2007). An analysis of older adult mice is beyond the scope of these reports but provides a line of future research.
Tissue Preparation
All animals ranging from P6 to P50 were euthanized with a lethal dose of pentobarbital (100 mg/kg) and transcardially perfused with 4% paraformaldehyde (PFA) in 0.1 M phosphate buffer (pH 7.4). In all cases, the brain was removed from the skull, hemisected, and initially postfixed in 4% PFA 1–6 h depending on age. For each case, one hemisphere was used for postmortem tracing, and the opposite hemisphere was used for in situ hybridization. This method has been previously published (Huffman et al. 2004). After postfixation, cortices solely devoted to in situ RNA hybridization were step immersed into methanol for dehydration and stored at −20 °C.
Anatomical Tracing Techniques
To determine the developmental progression of INCs in the wild-type postnatal mouse, single crystals of DiI and DiA were placed in different locations at the following ages: P6, P10, P15, P20, P30, P40, and P50. For all ages, dye crystals were placed in a total of 4 locations: rostral–frontal (motor cortex), rostral–parietal (somatosensory cortex), caudal–medial (visual cortex), or temporal–lateral (auditory cortex). Methods for dye crystal placement have been described in detail previously (Huffman et al. 2004) and in the companion paper (I). After dye placement, the brains were immersed in 4% PFA for a period of 5–12 weeks depending on age, to allow for transport of tracer. Methods for sectioning, DAPI (4′, 6-Diamidine-2-phenylindole dihydrochloride crystallized, Roche, USA) staining, and slide preparation have been described in detail in the companion paper (I). As in the previous report, 4 successful replicates were required for each age and dye placement location.
Gene Expression Assays
Gene expression assays in wild-type mouse brains were conducted using standard protocols and methods for nonradioactive free-floating in situ RNA hybridization (Shimamura et al. 1994; Garel et al. 1999; Huffman et al. 2004). The following probes were used to identify the patterns of neocortical gene expression in the developmental period from P6 to P50: COUP-TF1, Id2, RZRß, EphA7, EphrinA5 (gifts from John Rubenstein, UCSF), Lhx2 (a gift from Juan Botas, Baylor College of Medicine), Cadherin-8 (Cad8, a gift from Masatoshi Takeichi, Riken Center for Developmental Biology, Japan). The detailed methods for tissue preparation, sectioning, and slide preparation have been described in detail in the companion paper (I). As in the previous report, at least 3 successful replicates for each gene at each age were obtained.
Analysis of Dye Tracings and Gene Expression Assays
The imaging methods for postnatal tissue were identical to the methods described in detail in the companion paper (I). For each dye placement location (DPL) and resulting patterns of retrogradely labeled cells at each age and each gene expression pattern at each age, individual representative cases were chosen for presentation in the figures.
Reconstruction of Ipsilateral Intraneocortical Connections and Gene Expression
In order to facilitate coregistration of postnatal areal boundaries determined from INCs and gene expression patterns, we have combined an INC flattening procedure (used previously by the corresponding author) with a novel gene expression flattening procedure. The INC flattening method of data reconstruction illustrates the INC data in a lateral view of the cortex; this has been shown previously to be an effective method of analysis (Huffman et al. 2004, Fig. 3). Additionally, a similar technique has been presented previously, from microarray data (Hawrylycz et al. 2010). We have now amended this method to allow reconstruction of the complex gene expression data shown in Figures 4–10 of this report and present the expression pattern on a “lateral” view of the neocortex. The coregistration of the flattened reconstructions from the 2 data sets allows a clear demonstration of their correlation. The specific details of these methods are described in Supplementary Materials.
Figure 3.

Reconstruction of areal boundaries through analysis of INCs. All panels represent a lateral view of one hemisphere. Panels (A–G): DPLs and organization of retrogradely labeled cells (black or gray patches = DPL plus dye spread; gray filled circles = retrogradely labeled cells in visual cortex; gray plus signs = retrogradely labeled cells in motor cortex; black filled circles: retrogradely labeled cells in somatosensory cortex; black plus signs = retrogradely labeled cells in auditory cortex; thick black line = hemisphere outline). Panels (A'–G'): lateral view reconstructions of areal boundaries as determined by INC analyses (gray and black lines = cortical areas as labeled; m, motor cortex; m + s, sensory–motor amalgam; s, somatosensory cortex; a, auditory cortex; v, visual cortex). Stars denote location of barrel field. Oriented medial (M) up and rostral (R) to the left. Scale bar = 1 mm.
Figure 4.

Analysis of neocortical gene expression of COUP-TFI; 100-μm rostral to caudal coronal series (A to G1–4) and sagittal (A to G5–6) sections of P6 (A1–6), P10 (B1–6), P15 (C1–6), P20 (D1–6), P30 (E1–6), P40 (F1–6), or P50 (G1–6) brain hemispheres after in situ hybridization with a probe for COUP-TFI, oriented with dorsal up (all sections) and medial (A to G1–4) or rostral (A to G5–6) to the left. Panels (A7–G7) show lateral view reconstructions of gene expression gradients or gene maps within one hemisphere (gray shaded areas) coregistered with areal reconstructions at each age. Other conventions as in previous. At P6, COUP-TFI expression is seen throughout the cortex with the strongest levels caudo/laterally (arrow in A4), and differences in laminar distribution of transcripts are observed at different rostral/caudal locations. Expression in superficial layers becomes more homogenous at later ages, and intensity of expression decreases. Arrows in A4, B4, C4, D4, and E4 highlight the expression gradient, the arrow in A6 highlights rostromedial expression and arrows in A2, B2, B5, C2, C5, D2, D5, and E3 indicate the barrel field. Scale bar = 1 mm.
Figure 5.

Analysis of neocortical gene expression of Id2; 100-μm coronal (A to G1–4) or sagittal (A to G5–6) sections and gene maps (A7–G7) of P6–P50 brain hemispheres after in situ hybridization with a probe for Id2, with conventions as in previous. Expression of Id2 is seen throughout the neocortex at P6, with most layers displaying distinct differences along the rostral/caudal and medial/lateral axes. At later ages, the pattern of expression remains similar. While intensity of expression decreases with time, medial cortex exhibits comparatively more robust expression levels. Arrows in A4, B3–4, B6, C2–4, D2–4, and E3 highlight medial/caudomedial expression; A3, B5, C6, D5, and E2 arrows indicate the barrel field; A2 arrow highlights the expression gradient. Scale bar = 1 mm.
Figure 6.

Analysis of neocortical gene expression of Lhx2; 100-μm coronal (A to G1–4) or sagittal (A to G5–6) sections and gene maps (A7–G7) of P6–P50 brain hemispheres after in situ hybridization with a probe for Lhx2, with conventions as in previous. At P6, Lhx2 transcripts are found primarily in superficial layers along the entire rostral/caudal extent of the cortex, with lower levels seen in the barrels and caudally. Intensity of expression decreases by the second week but patterns remain largely unchanged. Arrow in A2 highlights rostrolateral expression; arrow in A4 indicates the auditory area; arrows in A3, A5–6, and B6 indicate the barrel field; arrow in B3 highlights a region of medial expression; arrows in B4, C6, and D6 highlight caudal expression. Scale bar = 1 mm.
Figure 7.

Analysis of neocortical gene expression of RZRß; 100-μm coronal (A to G1–4) or sagittal (A to G5–6) sections and gene maps (A7–G7) of P6–P50 brain hemispheres after in situ hybridization with a probe for RZRß, with conventions as in previous. RZRβ expression at P6 is observed in layers IV and V with stronger expression in primary areas. This pattern remains at later ages but the intensity of expression shows a moderate decrease. A4, B3 lateral, B4, C3–4, and E4 arrows indicate primary sensory areas; A3, A5, B2, B3 medial, C2, C5, D2–3, D5, E2–3, F2, and G2 arrows indicate the barrel field. Scale bar = 1 mm.
Figure 8.

Analysis of neocortical gene expression of Cad8; 100-μm coronal (A to G1–4) or sagittal (A to G5–6) sections and gene maps (A7–G7) of P6–P50 brain hemispheres after in situ hybridization with a probe for Cad8, with conventions as in previous. At P6, Cad8 expression is strongest at both poles of the neocortex, with intervening regions displaying heterogeneous distribution of transcripts among layers. At later ages, exclusion of expression from the barrels becomes pronounced, and expression decreases in intensity with most noticeable losses laterally. A2, A6 rostral, B5 rostral, C5 rostral, D3, and E3 arrows indicate the barrel field; A6 caudal arrow indicates expression in the visual area; A1, B2, C1–2, D1–2, and E2 arrows indicate expression in the motor and somatosensory areas; B5 caudal, C5 caudal, D5–6, and E5 arrows highlight expression in caudal/lateral areas. Scale bar = 1 mm.
Figure 9.

Analysis of neocortical gene expression of EphA7; 100-μm coronal (A to G1–4) or sagittal (A to G5–6) sections and gene maps (A7–G7) of P6–P50 brain hemispheres after in situ hybridization with a probe for EphA7, with conventions as in previous. EphA7 expression at P6 is confined to mostly superficial layers and is strongest medially and caudolaterally. At subsequent ages, the intensity of expression decreases nonuniformly, with medial locations exhibiting a slower decline. A2, A4 medial, B3 medial, C3 medial, and D2 arrows highlight medial expression; B3 ventral, C3 ventral, and D3 arrows indicate the hippocampus; A4 lateral arrow highlights lateral expression. Scale bar = 1 mm.
Figure 10.

Analysis of neocortical gene expression of EphrinA5; 100-μm coronal (A to G1–4) or sagittal (A to G5–6) sections and gene maps (A7–G7) of P6–P50 brain hemispheres after in situ hybridization with a probe for EphrinA5, with conventions as in previous. At P6, EphrinA5 is expressed throughout the cortex, excluding the rostral pole, with strongest levels in somatosensory cortex and caudolaterally. This pattern remains unchanged at later ages but intensity of expression decreases. A2, B2, B6, C2, C6, and D2 arrows highlight medial regions of expression; A4, B3, C4, and D4 arrows highlight lateral regions of expression; A3, D3, D5, and E2–3 arrows indicate the barrel field. Scale bar = 1 mm.
Results
The establishment of the network that connects neocortical areas within a single hemisphere is fundamental to normal brain function. Exactly how the neocortical sensory and motor areas and their connections form and are maintained throughout development is not completely understood. In this report and its companion (I), we have detailed the development of ipsilateral INCs from the first observation of tangential labeling in the embryonic mouse to the postpubescent adult mouse. This is the first lifespan analysis of INC development across 4 sensory and motor areas, as well as the first characterization of the adult pattern in mouse.
Postnatal Development of Ipsilateral INCs in Mouse
As described in the companion paper, the earliest radial INCs resulting from a DiI crystal placement were observed at E12.5, the earliest tangential INCs were observed at E13.5 and a stage we termed the APP begins at E16.5 (see companion report I). By P3, the INCs begin to more closely resemble the adult pattern. This is the time when particular features of sensory areas (such as the barrel field in somatosensory cortex) are forming.
By P6, lamination is evident, with layers I, IV, and V/VI identifiable in the dye sections (Fig. 1, D2 large arrow denotes barrels in layer 4). In the P6 mouse, we were able to make precise dye crystal placements in 4 cortical areas: motor, somatosensory, auditory, and visual cortex (Fig. 1A1–F1,A2–F2). As in earlier ages shown in the companion report, the sensory–motor amalgam is present, where a region of overlap of cells within motor and somatosensory cortex occurs (compare Fig. 1A1–B1,A2–C2). Retrogradely labeled cells from a motor DPL (Fig. 1A1, starred) are observed caudally in the location of rostral somatosensory cortex (Fig. 1B1). Labeled cells from an auditory DPL extend caudally to a location lateral to visual cortex and are observed to be present in the medial geniculate nucleus (MGN) of the thalamus (Fig. 1E1, red label, F1 arrow denotes MGN). At this point, the somatosensory region (as defined by labeling) is present medial to and segregated from the auditory region (Fig. 1, compare C1–E1 red with C2–E2 red). Likewise, the somatosensory region is present lateral to the visual region although the 2 areas remain segregated (Fig. 1D2–E2, red and green). The regions outlined from retrogradely labeled cells appear to form clear boundaries with one another where a light mixing of “orange” cells at the border can be observed (Fig. 1D2, small arrowhead). Cells within visual cortex remain segregated from auditory cells medially (Fig. 1, compare D1–E1 red with D2–E2 green, Fig. 3A). Labeled cells from this visual DPL can be seen in the lateral geniculate nucleus (LGN) (Fig. 1E2, green cells within thalamus). For all subsequent ages, thalamic labeling used for verification of DPL is presented in Supplementary Figure 1.
Figure 1.

Analysis of INC formation at P6, P10, P15, and P20; 100-μm coronal sections presented in rostral to caudal series (A1–X1, A2–X2) of brain hemispheres following DiI or DiA crystal placement, oriented with dorsal up and lateral to the right. For all ages, Brain 1 had DPLs in motor (A1, G1, M1, S1) and auditory cortex (D1, K1, Q1, W1); Brain 2 had DPLs in somatosensory (C2, H2, N2, T2) and visual cortex (E2, K2, R2, X2). From P6 through P20, features of sensory areas (such as lamina and barrel fields) become apparent, but primary areas, as labeled by INCs, remain segregated. Asterisks in sections indicate dye placement locations DPLs. The F1 arrow indicates MGN labeling. Small arrow in D2 and large arrows in J2 and V2 indicate the visual/somatosensory boundary. Large arrows in D2, H2, O2, and U2 and stars indicate the barrel field. m, motor; s, somatosensory; a, auditory; and v, visual areas. Scale bar = 500 μm.
At P10, the sensory–motor amalgam is present (Fig. 1G1–I1,G2–H2, DPLs starred in G1 and H2, arrowhead in H2 denotes barrel field). Retrogradely labeled cells from the auditory DPL are present lateral to the somatosensory region (compare Fig. 1J1–K1 red with I2–J2 red) and the visual region (Fig. 1, compare J1–L1 red with J2–L2 green). The retrogradely labeled cells resulting from the somatosensory DPL are located lateral to the location of labeled cells in the visual cortex where a boundary is observed (Fig. 1I2–J2 red and green, J2 arrow denotes boundary). Within somatosensory cortex, the laminar organization of retrogradely labeled cells now appears less homogenous, particularly in layer IV and the supragranular layers. Within these layers, dense clusters of label are now observed (Fig. 1I2–J2), which may reflect the ongoing differentiation of barrels and septa in layer IV. The radial distribution of cells labeled by dye placement in visual cortex at P10 has also become more restricted as compared with P6, with the majority of labeled cells observed primarily in layer IV (Fig. 1J2, compare with D2).
At P15, the INC pattern is very similar to that of P10, with minor differences most likely from a slight shifting of DPLs (see Fig. 3C). A DPL in motor cortex results in retrograde labeling caudally through the rostral somatosensory region, while retrograde labeling from the DPL in somatosensory cortex is observed rostrally through motor cortex demonstrating the sensory–motor amalgam (Fig. 1M1–O1,M2–O2), noting the presence of the barrels (arrowhead in O2). Additionally, cells from a somatosensory dye placement extend caudally, lateral to the location of visual cortex (Fig. 1P2). Label from the auditory DPL extends rostrally, in a position lateral to both somatosensory and visual labeling (compare Fig. 1P1 and P2, greens, and P1–R1, green with P2–R2 red). The observation of discrete areal boundaries, with very minimal mixing of cell labeling (see Fig. 3A–G) continues throughout adulthood.
In P20 cortex, the sensory–motor amalgam remains as observed previously (Fig. 1, compare S1–U1 green with S2–U2 red) noting the presence of the barrels (arrowhead in U2). The majority of cells projecting to the motor cortex DPL at P20 were observed in layers IV–VI, with the most caudolateral regions showing the strongest labeling in layer IV (Fig. 1T1–U1). Additionally, retrogradely labeled somatosensory cells are present caudally, lateral to visual cortex (Fig. 1V2 arrowhead at the S–V boundary). Label from the auditory DPL was observed lateral to somatosensory cortex and visual cortex (Fig. 1, compare red label in V1 and V2 and compare V1–X1 red with V2–X2 green). As in earlier ages, the distribution of visual cells that have taken up dye show a clustered appearance in layers II/III and IV, with a more homogenous arrangement in layers V and VI (Fig. 1V2, green).
In the peripubescent and postpubescent adult (P30–P50) mouse cortex (Han et al. 2002), the sensory motor–amalgam is observed (Fig. 2A1–C1,A2–C2,G1–I1,G2–I2,M1–O1,M2–N2). Cells labeled from somatosensory DPLs at these ages extend caudally and are located in a position lateral to visual cortex, forming the somatosensory–visual boundary (Fig. 2C2–D2,J2–K2,O2–P2, arrows in D2,K2,P2 mark the boundaries). At P40, cells within the somatosensory area are found within layers II–VI with an apparent increased amount in layer IV, with the exception of the barrels of somatosensory cortex that continue to be largely dye negative (Fig. 2C2,J2,O2 arrows). The P30–P50 connections from the DPL in auditory cortex appear similar to that of P20, with retrogradely labels cells extending rostrally and caudally, in positions lateral to both somatosensory and visual cortex (Fig. 2, compare D1–F1 with D2–F2; compare J1–L1 with J2–L2; compare P1–R1 with O2–R2). As with DPLs in auditory cortex, at P30–P50, similar patterns of INCs are seen when dye is placed in the visual cortex (Fig. 2C2–F2,J2–L2,O2–R2).
Figure 2.

Analysis of INC formation at P30, P40, and P50; 100-μm coronal sections presented in rostral to caudal series (A1–R1, A2–R2) of brain hemispheres following DiI or DiA crystal placement. Conventions and abbreviations as in previous. For all ages, Brain 1 had DPLs in motor (A1, G1, N1) and auditory cortex (E1, K1, R1). Brain 2 had DPLs in somatosensory (B2, I2, N2) and visual cortex (F2, L2, R2). Despite the closing of sensory critical periods, the sensory and motor INCs remain substantially unchanged from P30 to P50. Arrows in D2, K2, and P2 indicate the visual/somatosensory boundary. Arrows in C2, J2, and O2 indicate the barrel field. Scale bar = 500 μm.
Postnatal INCs and Areal Boundaries
Reconstructed patterns of INCs (Fig. 3A–G) can be used to determine the boundaries of sensory and motor regions in the cortex (Fig. 3A′–G′). The retrogradely labeled cell groups stemming from sensory and motor DPLs have clear boundaries by P6, indicating that although the neocortex grows in size from the early postnatal mouse at P6 to the adult at P50, the adult pattern is present at P6, appearing as early as P3 (Fig. 3A, see companion report I). Although the pattern appears adult like at P6, the regions of “white” nonlabeled cortical area increase with age. As our DPLs were consistently in primary sensory and motor areas (confirmed through thalamic tracing, see Supplementary Fig. 1), the reconstructions of areal boundaries illustrate the presence of nonassociative regions (Fig. 3A′–G′). These INC and areal reconstructions aid in the coregistration of gene expression and areal boundaries in this and the companion report.
Postnatal Development of Neocortical Gene Expression and Arealization in Mouse
We have characterized the postnatal neocortical expression of 7 genes previously implicated in neocortical development in general, and arealization in particular, by the author and others (see Introduction). The expression patterns of COUP-TFI, Id2, Lhx2, RZRß, Cad8, EphA7, and EphrinA5 were examined at the following murine ages: P6, P10, P15, P20, P30, P40, and P50 (younger ages are presented in the companion report I). In this report, to further our understanding of the relationships between gene expression and the formation and maintenance of INCs in development, we continue our gene expression analysis at P6 when the APP is complete (see companion report I). In order to facilitate the comparison of expression patterns of “different” genes at the “same age,” we have included additional figures (see Supplementary Figs 2–8).
COUP-TFI
COUP-TFI is expressed in a rostrolateral to caudal–lateral gradient at P6 (Fig. 4A1–A6,A4 arrow), although expression is present rostromedially (Fig. 4A6 arrow). Compared with the younger ages in the companion report, P6 is the earliest age where the somatosensory barrel field can be visualized by COUP-TFI expression (Fig. 4A2 arrow). The COUP-TFI gene map at this age overlaps the caudal somatosensory/motor amalgam and visual areas with an area of strong expression coregistering with auditory cortex (Fig. 4A7). Through the third postnatal week, COUP-TFI expression remains strongest in caudolateral locations (Fig. 4B4–D4 arrows); additionally, expression still delineates the barrel field (Fig. 4B2,B5,C2,C5,D2,D5 arrows). At P30, the pattern of COUP-TFI expression is nearly identical to that seen at P20, with expression highest in caudal locations (Fig. 4E4 arrow) and in barrel septa (Fig. 7E3 arrow). Intensity of expression has declined, however, and at P40 and P50, expression levels remain comparatively low (Fig. 4F1–6 and G1–6). From P10 to P50, COUP-TFI expression, as shown on the gene map, expands rostrally and medially to cover almost all regions of the neocortex (Fig. 4B7–G7).
Id2
Id2 has a complex pattern of expression at P6. Expression is very strong medially, from rostral to caudal, although the pattern varies across layers (Fig. 5A2,A4 arrows). Rostrally, there is a high medial to low lateral gradient (Fig. 5A2 arrow). The barrel field (barrels and septa) is negative (Fig. 5A3 arrow). Like COUP-TF1, the Id2 gene map covers much of the somatosensory and motor cortex, visual, and auditory areas at P6 (Fig. 5A7). By the second postnatal week, strongest levels of expression are seen caudomedially, in a position that coregisters with visual cortex (Fig. 5C7–G7,B4–G4,B6–G6). A rostral expansion occurs by P20 while at later ages the map contracts laterally and thus no longer completely coregisters with the auditory area (Fig. 5B7–G7). Overall, Id2 expression decreases from P10 to P50, but the pattern remains similar with negative barrels (Fig. 5B5,C6,D5,E2 arrows) and transcripts present most robustly medially and caudomedially (Fig. 5B3–4,C2–4,D2–4,E3 arrows; F1–6,G1–6).
Lhx2
Although Lhx2 is strongly expressed in the rostrolateral cortex at P6 (Fig. 6A2 arrow), there is a distinct region of expression present corresponding to the auditory cortex (Fig. 6A4 arrow) and a low rostral to high caudal gradient exists laterally and medially (Fig. 6A7). At P6, the barrel field is Lhx2 negative and remains so at later ages (Fig. 6A3,A5–6 arrows, B6 arrow). The auditory area coregistration can be seen on the Lhx2 gene map, and this map shifts by P10, correlating with visual cortex; this relationship remains at later ages (Fig. 6A7–D7).
Overall, expression is downregulated by P20, with caudal and medial regions showing a slower loss of expression (Fig. 6B3–B4 arrows; C6 arrow; D6 arrow). From P30 to P50, levels of expression decline further and reliable transcript was not detected in the neocortex at these ages (Fig. 6E1–6,F1–6,G1–6).
RZRß
At P6, RZRß is strongly expressed in a gradient throughout much of layer 4 and some layer 5 neocortex (Fig. 7A1–A6). Two distinct regions of expression are observed caudally (Fig. 7A4 arrows), with strong expression in the barrels (Fig. 7A3,A5 arrows). RZRß's gene map at P6 coregisters primarily with somatosensory and auditory areas with weaker expression in visual cortex (Fig. 7A7). At P10, transcript levels were observed to peak, with strongest expression in the primary somatosensory, auditory, and visual areas (Fig. 7B2,B3 lateral arrow, and B4 arrow, respectively). At this age, RZRß expression could be considered a marker for the 3 primary sensory areas (Fig. 7B7). From P20 to P50, the expression pattern remains similar, with the rostral medial boundary of RZRß expression coregistering with the medial boundary of motor and somatosensory areas (Fig. 7D7–G7). However, the intensity of expression declines steadily (Fig. 7C1–6,D1–6,E1–6,F1–6,G1–6, arrows highlight regions of expression).
Cad8
At P6, Cad8 is strongly expressed in the rostral (motor) region and in the caudal visual cortex (Fig. 8A1 arrow, A6 caudal arrow); however, barrel expression is not seen (Fig. 8A2 arrow, A6 rostral arrow). The Cad8 gene map at this age significantly overlaps with motor and visual cortex (Fig. 8A7); this pattern generally persists, including a distinct midline gradient, through P50 (Fig. 8B7–G7). As with RZRß, Cad8 expression remains distinct at P10 through P30. Cad8 is highly expressed rostromedially and could be considered as a marker for motor cortex (Fig. 8B2 arrow; C1–2 arrows; D1–2 arrows; E2 arrow) and caudal regions (Fig. 8, caudal B5 and C5 caudal arrow, D5–6 arrows; E5 arrow) consistent with visual cortex. Cad8 expression is absent from the barrels (Fig. 8B5,C5 rostral arrows; D3 arrow; E3 arrow). Expression decreases at P40 and remains low through P50 (Fig. 8F1–6,G1–6).
EphA7
At P6, EphA7 expression is reduced compared with previous ages (see companion report I) but still present in medial cortex and a caudal region (Fig. 9A2,A4 arrows) that complements the caudal RZRß expression (Fig. 7A4 between arrows). Additionally, the lateral boundary of EphA7 expression coregisters with the medial boundary of somatosensory cortex and amalgam from P6 to P15 (Fig. 9A7–C7) and coregisters with motor cortex at P20 (Fig. 9D7). Expression is consistently present along the midline and in the hippocampus from P6 to P20 (Fig. 9A3, B3–C3 arrows, D2–D3 arrows). From P30 to P50, levels of expression decline further (Fig. 9E1–6,F1–6,G1–6).
EphrinA5
EphrinA5 is strongly expressed at P6 in distinct regions in rostral and lateral cortex and limited regions of the barrel field (Fig. 10A2–A4 arrows). As shown in the gene map of EphrinA5, expression abuts the lateral boundary of visual cortex from P6 (Fig. 10A7). This pattern of transcript distribution remains through P10 (Fig. 10B2–3, B6 arrows, B7) but shifts to include visual cortex at P15–P20 (Fig. 10C2,C4,C6 arrows; D2–5 arrows), abutting the medial boundary of auditory cortex (Fig. 10C7,D7). Expression decreases at later ages, with expression at P30–P40 observed in a region located midway along the mediolateral extent of the cortex that coregisters with somatosensory cortex on the gene map and is not reliably detected at P50 (Fig. 10E1–7 arrows, F1–7, G1–7).
Gene Expression in the Barrels
An interesting finding in this study is the differential patterning of gene expression in the postnatal barrel field. Distinct patterns are observed with 4 genes: COUP-TFI, Id2, RZRß, and Cad8 and are presented at 4 ages: P6, P10, P20, and P40 (Fig. 11). We observed very low or absent expression of the remaining 3 genes examined in this report, and these data are included in Supplementary Material (Supplementary Fig. 9). COUP-TFI, although expressed robustly within layer IV, does not delimit the full organization of the barrel components at P6 (Fig. 11A1). Within 4 days, however, the distribution of COUP-TFI transcripts clearly display the barrel walls and hollows (Fig. 11B1 arrow). Barrel expression of COUP-TF1 continues at later ages, and transcripts were detected through P40 (Fig. 11C1,D1 arrow). At P6 and P10, Id2 is “absent” from both the barrels and septa and was only observed at low levels superficial to the barrel field (Fig. 11A2 arrow and B2). However, from P20 to P40, we observed weak expression in the septa (Fig. 11C2 arrows, D2). RZRß is expressed at robust levels and qualitatively, levels appear similar in all 3 components at P6: barrel hollows, walls, and septa (Fig. 11A3 arrow). By P10, the barrel expression decreases relative to septal expression (Fig. 11B3 arrows). This pattern persists through P40 with further reduction of expression in the barrels (Fig. 11A3,B3,C3, and D3 arrow). At P6, very low levels of Cad8 are found within barrels relative to septa (Fig. 11A4 arrow). This pattern persists at P10, but the barrels are much less distinct at P20 (Fig. 11B4–D4). By P40, it is difficult to observe the structure of the barrels using Cad8 expression (Fig. 11D4). To our knowledge this is the first demonstration of gene expression changes within the barrel field throughout the postnatal lifespan. It is possible that the expression patterns of these genes play an important role in the maintenance of both physiological and anatomical properties of the mouse neocortical barrel field.
Figure 11.

Analysis of neocortical gene expression in the barrel field of somatosensory cortex; 100-μm sagittal sections (A to D1–4) sections of brain hemispheres after in situ RNA hybridization with probes for COUP-TFI (A1–D1), Id2 (A2–D2), RZRβ (A3–D3), and Cad8 (A4–D4), oriented with dorsal up and rostral to the left. The ages examined were as follows: P6 (A1–4), P10 (B1–4), P20 (C1–4), and P40 (D1–4). COUP-TFI and RZRβ exhibit robust expression in the barrels and surrounding regions of layer IV and V. Id2 and Cad8 display limited expression in the barrels but expression in nearby areas aids in barrel identification. A2 arrow indicates a lack of Id2 expression in layer IV; B1 arrow indicates barrel hollow; B3 right, C2 and D1 arrows indicate barrel septa; all other arrows indicate one complete barrel. Scale bar = 100 μm.
Relating INCs to Gene Expression
By combining our flattened reconstructions of INCs, areal boundaries and gene expression in Figures 4–10, we describe the correlative relationships of gene gradients and areas and how they change over time. At P6, the INCs of motor, somatosensory, auditory, and visual cortex assume an adult-like pattern, with the presence of a sensory–motor amalgam (Fig. 12A). Despite the obvious growth of cortical size, this pattern persists from “childhood” (P6) though puberty (P30) to adulthood at P50 (Fig. 12A–G).
Figure 12.
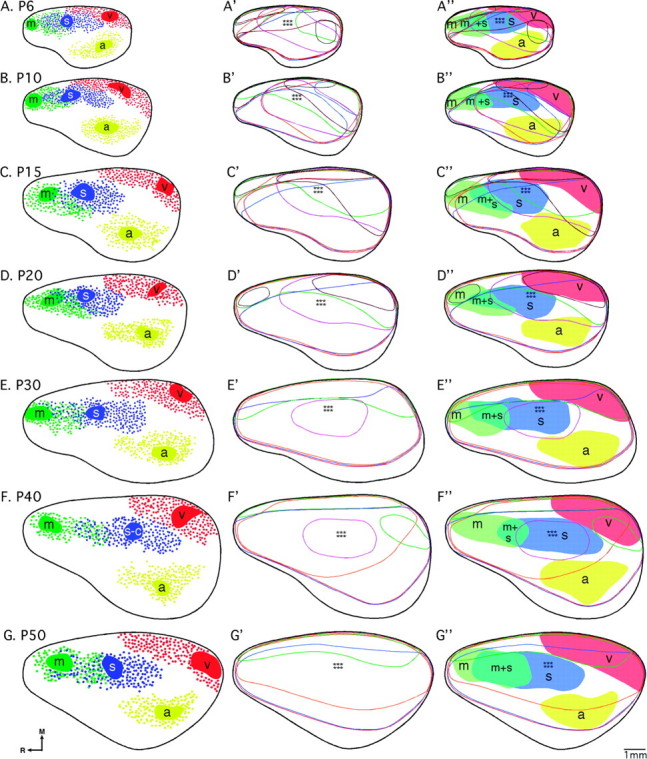
INC and gene expression relationships revealed by a novel, flattened reconstruction approach. Analysis of the relationships between INCs and neocortical gene expression was conducted through design of flattened reconstructions of INCs (A–G), and gene expression patterns (A'–G') and coregistrations of the 2 data sets (A''–G''), where areal boundaries are shaded. In all 3 columns, similar ages are presented from left to right as follows: A–A'', P6; B–B'', P10; C–C'', P15; D–D'', P20; E–E'', P30; F–F'', P40; and G–G'', P50. (A–G) Colored patches = DPL plus dye spread; red filled circles = retrogradely labeled cells in visual cortex; green filled circles = retrogradely labeled cells in motor cortex; blue filled circles: retrogradely labeled cells in somatosensory cortex; yellow filled circles = retrogradely labeled cells in auditory cortex; thick black line = hemisphere outline. In (A'–G') and (A''–G''), the flattened, reconstructed expression of each gene is represented by a colored line as follows: COUP-TFI, red; Id2, orange; Lhx2, burgundy; RZRβ, blue; Cad8, green; EphA7, gray; EphrinA5, purple. The pastel shaded regions in (A''–G'') denote areal boundaries of sensory and motor areas, determined from the patterns of INCs, as labeled (m, motor cortex; m + s, sensory–motor amalgam; s, somatosensory cortex; a, auditory cortex; v, visual cortex). Stars denote location of barrel field. Oriented medial (M) up and rostral (R) to the left. Scale bar = 1 mm.
Column 2 of Figure 12 illustrates the flattened, lateral view reconstructions of coronal and sagittal gene expression data by age. Gene expression patterns become less complex from P6 to P50, with only 4 of the 7 genes studied notably expressed in neocortical tissue at P50 (Fig. 12A′–G′). Column 3 of Figure 12 shows approximate cortical areal boundaries determined from INC patterning in column 1 (Fig. 12A″–G″ shaded regions) coregistered with gene expression data from column 2 (Fig. 12A″–G″ colored lines). The results of these analyses indicate that multiple genes in combination with one another, rather than simple one gene–one area relationships, provide relevant information and perhaps code for or maintain the position of areas in the cortex. It also suggests that genetically mediated development of regional specificity and areal boundaries is fully complete by P50. Additional comments regarding these relationships can be found in the Discussion.
Discussion
In this lifespan study, we have conducted an analysis of INCs and gene expression in the mouse that spans a chronological time period from embryogenesis to early infancy (companion report I) and from late infancy to adulthood (current report), allowing us to show snapshots of arealization as it occurs. The postnatal and early adult period of life is a time in which crucial refinements and modifications are made to neocortical circuitry in mammals. Subsequent to the completion of neocortical laminarization at the end of the first postnatal week in the mouse (Bayer and Altman 1991), vibrissae whisking (P14), eye opening (P12), and the onset of active hearing (P8/9) begin to supply the somatosensory, visual, and auditory cortices with information from the periphery. Elaboration of the thalamocortical circuitry continues and reaches a mature state in the first month of life (Rice 1985; Agmon et al. 1993, 1995; White et al. 1997; Miller et al. 2001; Portera-Cailliau et al. 2005; Louderback et al. 2006; Inan and Crair 2007) near the onset of puberty (Han et al. 2002). Studies in several mammalian species have shown that primary sensory areas exhibit a postnatal critical period during which activity-dependent modification of connections occurs at the cellular and synaptic level (as reviewed in Berardi et al. 2000; Hensch 2005). Additionally, many studies in cats have demonstrated that cortico–cortical connections among sensory areas undergo significant pruning as a normal part of development (Meyer and Ferres-Torres 1984; Callaway and Katz 1990; Elberger 1993; Galuske and Singer 1996). Fewer studies exist in the mouse exploring this phenomenon, and given this species' importance in understanding genetic mutations related to human psychiatric and neurodevelopmental disorders (as reviewed in Yang and Frankel 2004; Lynn and Davies 2007; Moy and Nadler 2008; Pletnikov 2009), it is important that a similar body of knowledge be generated for mice.
Postnatal Development of Ipsilateral INCs in the Mouse
Although the critical period for barrel patterning has closed, vibrissae whisking behavior has not yet begun at P6 in the mouse (Inan and Crair 2007; Lee et al. 2009), eyelids remain closed and the animal has yet to develop normal hearing (Ehret 1976; Smith and Trachtenberg 2007; Zhao et al. 2009). Spontaneous activity, thought to be necessary for final stages of differentiation, exists in infancy in the somatosensory, auditory, and visual systems (Meister et al. 1991; Khazipov et al. 2004; Mrsic-Flogel et al. 2005; Tritsch et al. 2007; Cang et al. 2008) and may be involved in the development of INCs. At P6, significant overlap of motor and somatosensory connections demonstrates the presence of the sensory–motor amalgam; this pattern is maintained throughout adulthood (Fig. 12A–G). Likewise, the patterns of auditory and visual INCs are similar to that observed at P3 (see companion paper I) and generally reflect the adult state, although changes in association cortex occur as the mouse matures (see below).
Prior to eye opening and whisking behavior at P10, somatosensory, auditory, and motor cortex INCs are similar to those observed at P6 despite the growth of the neocortex (Fig. 12B). By P15, mice pups are now using all 3 sensory systems to interact with the environment (Welker 1964; Landers and Zeigler 2006). Moreover, the critical period within rodent auditory cortex has passed (P11–P13, de Villers-Sidani et al. 2007). An increase of motor cortex INCs at P15 may coincide with the development of motor representations in this region (Fig. 12C). From P15 onward, projections to auditory cortex appear relatively unaltered, possibly reflecting the end of the critical period (Fig. 12C–G). Although the barrels are observed as early as P6, somatosensory connections within the field are more pronounced at P15; this is likely due to the onset of whisking behavior and thus correlated and noncorrelated sensory input. Connections of visual cortex at P15 are similar to earlier ages (Fig. 12A–C) despite the transition to eye opening at P12.
The progression of postnatal INC development from P15 to P50 is subtle. Despite the timing of the murine visual system critical period (P19–P32; Gordon and Stryker 1996), visual cortex INCs do not change significantly (Fig. 12C–G, red). Likewise, the onset of both whisking behavior and hearing produces no major changes in the pattern of somatosensory (Fig. 12C–G, blue) or auditory (Fig. 12C–G, yellow) INCs from P15 to P50. Although the motor cortex critical period is thought to occur later than that of more caudal neocortical regions (P30–P45, estimated from Martin 2005), motor cortex INCs also do not change significantly during this same time frame (Fig. 12C–G, green). Hence, our results indicate that neither the increase in size of the neocortex from P6 to P50 nor the progression through the majority of the sensory critical periods produces observable changes in the patterns of INCs in primary sensory and motor cortex, consistent with our notation of the closing of the APP around P3 (see companion report I). Prior to this study, there was virtually no data describing INC patterning in the postnatal mouse. The major observable change throughout the time period from P6 to P50 is the amount of white cell-absent area that appears with age and which likely reflects the increasing amount of association cortex, tertiary, higher level cortex, or multimodal areas that develop throughout the postnatal period (Fig. 12A–G).
Intrinsic Influences on Postnatal Neocortical Development and Areal Maintenance
There is great support for the notion that neocortical patterning is regulated by gene expression (see companion report I). However, the function of postnatal neocortical gene expression, existing beyond the developmental APP into adulthood is not known. In this paper, we correlate areal boundaries established through the analysis of INCs, with changes in neocortical expression of 7 genes. We chose these particular genes because of their implication in cortical area development. Specifically, the regional expression patterns of these genes in the neocortex, as well as data from studies of mutants that show changes in early neocortical areal patterning, suggest their role in arealization (Redies and Takeichi 1996; Miyashita-Lin et al. 1999; Rubenstein and Rakic 1999; Redies 2000; Liu et al. 2000; Vanderhaeghen et al. 2000; Zhou et al. 2001; Bolz et al. 2004; Huffman et al. 2004; Cang et al. 2005; Miller et al. 2006; Armentano et al. 2007; Kudo et al. 2007; Suter et al. 2007; Faedo et al. 2008; Mangale et al. 2008; Chou et al. 2009; Demyanenko et al. 2010; Hawrylycz et al. 2010). Because these 7 genes are expressed in the neocortex at some point during the postnatal period (7/7 from P6–P20, 5/7 from P30–P40, and 4/7 at P50), it is possible that they may play a role in the maintenance of area boundaries and/or features throughout life.
The gene expression data presented in this study agree with and complement that of the Allen Brain Atlas and the GenePaint resources. Both collections play a crucial role in the field through documentation of gene expression in the brain and other tissues using high-throughput in situ RNA hybridization at prenatal and postnatal ages (Lein et al. 2007). However, these data sets only include a few significant developmental time points, skipping analysis at ages crucial to neocortical development. Therefore, we adopted a more comprehensive approach by comparatively doubling the number of time points in our study. Our study, although documenting the development of neocortical gene expression, maintains a central focus on the correlation of gene expression with development of areal boundaries determined from analysis of INCs at 13 distinct murine ages, leading to implications for arealization and areal maintenance.
Visual Cortex
As demonstrated in the companion paper, putative visual cortex correlates with boundaries of gene expression during embryogenesis in the mouse, and by birth, these boundaries are less aligned, perhaps indicating that the genes under study are involved in visual areal development prior to the specifications of more rostral regions (see Table 1 in the companion report). This overall pattern persists throughout postnatal development, although RZRß and EphrinA5 expression at P6 and P10 positively and negatively correlates with boundaries of visual cortex, respectively (Fig. 12A″–B″ and Table 1). Additionally, at P10–P20, Lhx2 and Cad8 expressions appear to coregister with primary and putative nonprimary areas within visual cortex (Fig. 12B″–D″ and Table 1). After P20, only Cad8 remains a marker for visual cortex, suggesting its potential role in postcritical period boundary maintenance (Fig. 12E″–G″).
Table 1.
Summary of coregistration of gene expression and cortical areas
| Motor Cx (m) | Somato Cx (s) | Visual Cx (v) | Auditory Cx (a) | |
| P6 (7/7 GE) | COUPTFI+ | COUPTFI+ | COUPTFI+ | COUPTFI+* |
| Id2+ | Id2+ | Id2+ | Id2+* | |
| Lhx2+ | Lhx2−* | Lhx2+ | Lhx2+* | |
| RZRß+ | RZRß+ | RZRß+ | RZRß+* | |
| Cad8+* | Cad8+ | Cad8+ | Cad8+ | |
| EphA7+* | EphA7+ | EphA7+ | EphA7+ | |
| EphrinA5−* | EphrinA5+* | EphrinA5+ | EphrinA5+ | |
| P10 (7/7 GE) | COUPTFI+ | COUPTFI+* | COUPTFI+ | COUPTFI+* |
| Id2+ | Id2+* | Id2+ | Id2+* | |
| Lhx2− | Lhx2+ | Lhx2+ | Lhx2−* | |
| RZRß+ | RZRß+* | RZRß+* | RZRß+* | |
| Cad8+* | Cad8+ | Cad8+ | Cad8+ | |
| EphA7+* | EphA7−* | EphA7+ | EphA7− | |
| EphrinA5−* | EphrinA5+* | EphrinA5+ | EphrinA5+ | |
| P15 (7/7 GE) | COUPTFI+ | COUPTFI+* | COUPTFI+ | COUPTFI+* |
| Id2+ | Id2+ | Id2+ | Id2+* | |
| Lhx2– | Lhx2−* | Lhx2+* | Lhx2−* | |
| RZRß+ | RZRß+ | RZRß+ | RZRß+* | |
| Cad8+* | Cad8+ | Cad8+ | Cad8−* | |
| EphA7+* | EphA7−* | EphA7+ | EphA7− | |
| EphrinA5–* | EphrinA5+* | EphrinA5+ | EphrinA5−* | |
| P20 (7/7 GE) | COUPTFI+ | COUPTFI+ | COUPTFI+ | COUPTFI+ |
| Id2+ | Id2+ | Id2+ | Id2+ | |
| Lhx2– | Lhx2−* | Lhx2+* | Lhx2− | |
| RZRß+ | RZRß+* | RZRß+ | RZRß+ | |
| Cad8+* | Cad8−* | Cad8+* | Cad8−* | |
| EphA7+* | EphA7−* | EphA7− | EphA7− | |
| EphrinA5−* | EphrinA5+* | EphrinA5+ | EphrinA5−* | |
| P30 (5/7 GE) | COUPTFI+ | COUPTFI+ | COUPTFI+ | COUPTFI+* |
| Id2+ | Id2+ | Id2+ | Id2+* | |
| RZRß+ | RZRß+* | RZRß+ | RZRß+* | |
| Cad8+* | Cad8−* | Cad8+* | Cad8− | |
| EphrinA5−* | EphrinA5+* | EphrinA5−* | EphrinA5−* | |
| P40 (5/7 GE) | COUPTFI+ | COUPTFI+ | COUPTFI+ | COUPTFI+ |
| Id2+ | Id2+ | Id2+ | Id2+ | |
| RZRß+ | RZRß+ | RZRß+ | RZRß+ | |
| Cad8+ | Cad8−* | Cad8+* | Cad8− | |
| EphrinA5−* | EphrinA5+* | EphrinA5−* | EphrinA5−* | |
| P50 (4/7 GE) | COUPTFI+ | COUPTFI+ | COUPTFI+ | COUPTFI+ |
| Id2+ | Id2+ | Id2+ | Id2+ | |
| RZRß+ | RZRß+ | RZRß+ | RZRß+ | |
| Cad8+ | Cad8−* | Cad8+* | Cad8− |
Note: GE, genes expressed; Cx, cortex; m, motor; s, somatosensory; v, visual; a, auditory. This table is a summary of the coregistration reconstructed gene expression patterns of COUP-TFI, Id2, Lhx2, Cad8, EphA7, EphrinA5, and RZRβ with postnatal areal boundaries for motor, somatosensory, visual and auditory cortex, as gauged by INCs. The 5 columns, from left, indicates 1) age and the number of genes expressed (n/7), 2) coregistration information for the motor cortex, 3) coregistration information for the somatosensory cortex, 4) coregistration information for the visual cortex, and 5) coregistration information for the auditory cortex. Within each box, all 7 genes are listed and a “+” or “−” is used to indicate if the region overlaps (+) or does not overlap (−) with gene expression. Additionally, an asterisk is marked when boundary of a gene expression domain is found adjacent or abutting the boundary of a cortical area.
Auditory Cortex
As with visual cortex, auditory cortex appears to demonstrate most genetic coregistration during embryogenesis (see Table 1 in the companion report). However, the expression of EphrinA5 and Cad8, 2 genes whose expression coregisters with somatosensory and visual cortex, respectively, consistently abuts and perhaps plays a role in the maintenance of the auditory cortex medial boundary from P15 to P20 (Cad8; Fig. 12C″–D″) and P15–P40 (EphrinA5; Fig. 12C″–F″ and Table 1). The lateral boundary of auditory cortex is consistently correlated with lateral boundaries of COUP-TFI, Id2, and RZRß throughout postnatal development (Fig. 12A″–G″).
Somatosensory Cortex and the Barrel Field
Compared with the visual and auditory regions in caudal cortex, aspects of the somatosensory and motor regions in middle and rostral cortex are still developing into postnatal life and demonstrate more complex gene–area relationships. At P6–P10, somatosensory cortex coregisters with EphrinA5, mostly avoids EphA7- and Lhx2-positive zones and overlaps with expression of COUP-TFI, Id2, Cad8, and RZRß (Fig. 12A″–B″ and Table 1). By P15–P20, it coregisters with EphrinA5, COUP-TFI, and Id2 and overlaps with RZRß and Cad8 while avoiding EphA7- and Lhx2-positive zones (Fig. 12C″–D″). At P30–P40, the somatosensory cortex coregisters closely with EphrinA5 as well as RZRß, COUP-TFI, and Id2, still avoiding the area of Cad8 expression (Fig. 12E″–F″). Finally, by P50, as EphrinA5 is no longer expressed in the cortex, the somatosensory area coregisters with the RZRß, COUP-TFI, and Id2 expression zones and avoids the area of Cad8 expression (Fig. 12G″).
Within the somatosensory cortex of rodents, a large region is devoted to a representation of the vibrissae or whiskers that are crucial for the relay of sensory information during periods of nocturnal activity. Each whisker is represented by a morphological and functional structure within layer IV called a barrel. Barrels are not uniform structures; many studies in rodents have determined that each barrel consists of a center region, termed a hollow, into which layer IV dendrites extend and synapse with thalamocortical axons from the ventral posterior (VP) nucleus and “walls” around the hollows where soma reside. Intervening regions between barrels, referred to as septa, contain axons from the posterior medial thalamus (Woolsey and Van der Loos 1970; Kim and Ebner 1999; Inan and Crair 2007). Although barrels are first apparent sometime between P3 and P5 in mice (Woolsey and Van der Loos 1970; Agmon et al. 1993), several aspects of differentiation and maturation subsequently occur. For example, the disappearance of soma from barrel hollows has been reported to occur from P6 to P8, axons from the posterior medial nucleus reach an adult-like pattern between P7 and P9, and pruning of VP axons continues through P12 (Rice et al. 1985; White et al. 1997; Inan and Crair 2007; Kichula and Huntley 2008). Our results indicate that genes involved in neocortical arealization might be redeployed to control these later activities in barrel differentiation as well. Additionally, the distinctive expression of COUP-TFI, Id2, RZRß, and Cad8 genes highlight that the barrel and nonbarrel regions of layer IV exhibit distinct patterns of gene expression (Fig. 11). These findings are novel in that barrel field structure has not been previously assessed by a gene expression analysis that spans the earliest time of their formation, to adulthood. Although the structure and related physiologic function of the barrels are set early on, within the first week of life, our data suggest that gene expression may play a role in maintenance of the barrels from the first week of life through adulthood in the mouse.
Motor Cortex
The motor cortex, located in the frontal lobe, is thought to complete its development later than more caudal regions and has a critical period that closes just prior to adulthood (P30–P45, estimated from Martin 2005). In our studies, the embryonic period shows less genetic coregistration with developing motor cortical boundaries, as would be expected from this notion (see Table 1 in companion paper I). In fact, by P6–P10, all 7 genes are expressed in the motor cortex (Fig. 12A″–B″). By P15–P20, 5/7 genes are expressed and EphrinA5 abuts the caudal border with EphA7 coregistering with multiple motor boundaries (Table 1). From P30 to P50 during the proposed motor critical period, 4 of 7 genes (COUP-TFI, Id2, RZRß, and Cad8) are expressed within the region in a similar pattern (Fig. 12E″–G″).
Although this dual-report lifespan study is correlative in nature, it provides some insight into how expression patterns may relate to arealization. As described in the companion report (I), genetically altered mouse models have led to the understanding that genes, such as those described here, are involved in the establishment of certain neocortical area boundaries and features (Miyashita-Lin et al. 1999; Rubenstein and Rakic 1999; Liu et al. 2000; Vanderhaeghen et al. 2000; Zhou et al. 2001; Huffman et al. 2004; Kudo et al. 2007; Armentano et al. 2007; Chou et al. 2009; Hawrylycz et al. 2010; see companion paper I). This report extends that notion to postnatal development and areal maintenance, through the observation of continued gene expression past sensory and motor critical periods. Although our data cannot directly assess the role of genes in areal maintenance, a description of continued expression of some “arealization” genes does guide future research involving conditional mutants that survive into postnatal life and adulthood. Our laboratory is continuing this line of research by studying postnatal INC and areal development in conditional mutant mouse models.
Concluding Remarks
Complexly organized sensory and motor neocortical areas arise early in development during the areal patterning period, or APP. This process, referred to as arealization, stems from the precise development of cortical circuitry as well as regional expression of patterning genes. In the postnatal period through adulthood, when arealization is considered complete, the neocortex continues to grow and change. Although patterns of sensory and motor INCs do not change dramatically throughout postnatal life, our data suggest that cortical growth correlates with an increase of association cortex and that these changes, as well as the preservation of cortical boundaries observed in our data across ages, are correlated with changes in regional gene expression. Our data also support the notion that caudal regions of cortex develop earlier than rostral regions and that changes in neocortical gene expression may be playing a role in the developmental sequence. Although the mechanisms underlying our observations warrant further study, this novel lifespan analysis characterizes and correlates ipsilateral intraneocortical connectivity with dynamic patterns of gene expression from embryogenesis to adulthood and provides valuable insight into their relationships.
Supplementary Material
Supplementary Figures 1–9 and other Supplementary Materials can be found at: http://www.cercor.oxfordjournals.org/
Funding
National Institutes of Mental Health (5R03MH080502-02 to K.J.H.).
Supplementary Material
Acknowledgments
Conflict of Interest: None declared.
References
- Agmon A, Yang LT, Jones EG, O'Dowd DK. Topological precision in the thalamic projection to neonatal mouse barrel cortex. J Neurosci. 1995;15:549–561. doi: 10.1523/JNEUROSCI.15-01-00549.1995. [DOI] [PMC free article] [PubMed] [Google Scholar]
- Agmon A, Yang LT, O'Dowd DK, Jones EG. Organized growth of thalamocortical axons from the deep tier of terminations into layer IV of developing mouse barrel cortex. J Neurosci. 1993;13:5365–5382. doi: 10.1523/JNEUROSCI.13-12-05365.1993. [DOI] [PMC free article] [PubMed] [Google Scholar]
- Armentano M, Chou SJ, Tomassy GS, Leingärtner A, O'Leary DD, Studer M. COUP-TFI regulates the balance of cortical patterning between frontal/motor and sensory areas. Nat Neurosci. 2007;10:1277–1286. doi: 10.1038/nn1958. [DOI] [PubMed] [Google Scholar]
- Bayer SA, Altman J. Neocortical development. New York: Raven; 1991. [Google Scholar]
- Berardi N, Pizzorusso T, Maffei L. Critical periods during sensory development. Curr Opin Neurobiol. 2000;10:138–145. doi: 10.1016/s0959-4388(99)00047-1. [DOI] [PubMed] [Google Scholar]
- Bolz J, Uziel D, Mühlfriedel S, Güllmar A, Peuckert C, Zarbalis K, Wurst W, Torii M, Levitt P. Multiple roles of ephrins during the formation of thalamocortical projections: maps and more. J Neurobiol. 2004;59:82–94. doi: 10.1002/neu.10346. [DOI] [PubMed] [Google Scholar]
- Callaway EM, Katz LC. Emergence and refinement of clustered horizontal connections in cat striate cortex. J Neurosci. 1990;10:1134–1153. doi: 10.1523/JNEUROSCI.10-04-01134.1990. [DOI] [PMC free article] [PubMed] [Google Scholar]
- Cang J, Kaneko M, Yamada J, Woods G, Stryker MP, Feldheim DA. Ephrin-As guide the formation of functional maps in the visual cortex. Neuron. 2005;48:577–589. doi: 10.1016/j.neuron.2005.10.026. [DOI] [PMC free article] [PubMed] [Google Scholar]
- Cang J, Niell CM, Liu X, Pfeiffenberger C, Feldheim DA, Stryker MP. Selective disruption of one Cartesian axis of cortical maps and receptive fields by deficiency in ephrin-As and structured activity. Neuron. 2008;57:511–523. doi: 10.1016/j.neuron.2007.12.025. [DOI] [PMC free article] [PubMed] [Google Scholar]
- Cecchi C. Emx2: a gene responsible for cortical development, regionalization and area specification. Gene. 2002;291:1–9. doi: 10.1016/s0378-1119(02)00623-6. [DOI] [PubMed] [Google Scholar]
- Chou SJ, Perez-Garcia CG, Kroll TT, O'Leary DD. Lhx2 specifies regional fate in Emx1 lineage of telencephalic progenitors generating cerebral cortex. Nat Neurosci. 2009;12:1381–1389. doi: 10.1038/nn.2427. [DOI] [PMC free article] [PubMed] [Google Scholar]
- Crochet S, Petersen CC. Correlating whisker behavior with membrane potential in barrel cortex of awake mice. Nat Neurosci. 2006;5:608–610. doi: 10.1038/nn1690. [DOI] [PubMed] [Google Scholar]
- Demyanenko GP, Siesser PF, Wright AG, Brennaman LH, Bartsch U, Schachner M, Maness PF. L1 and CHL1 cooperate in thalamocortical axon targeting. Cereb Cortex. 2010;21:401–412. doi: 10.1093/cercor/bhq115. [DOI] [PMC free article] [PubMed] [Google Scholar]
- de Villers-Sidani E, Chang EF, Bao S, Merzenich MM. Critical period window for spectral tuning defined in the primary auditory cortex (A1) in the rat. J Neurosci. 2007;27:180–189. doi: 10.1523/JNEUROSCI.3227-06.2007. [DOI] [PMC free article] [PubMed] [Google Scholar]
- Ehret G. Development of absolute auditory thresholds in the house mouse (Mus musculus) J Am Audiol Soc. 1976;1:179–184. [PubMed] [Google Scholar]
- Elberger AJ. Distribution of transitory corpus callosum axons projecting to developing cat visual cortex revealed by DiI. J Comp Neurol. 1993;333:326–342. doi: 10.1002/cne.903330303. [DOI] [PubMed] [Google Scholar]
- Faedo A, Tomassy GS, Ruan Y, Teichmann H, Krauss S, Pleasure SJ, Tsai SY, Tsai MJ, Studer M, Rubenstein JLR. COUP-TFI coordinates cortical patterning, neurogenesis, and laminar fate and modulates MAPK/ERK, AKT, and beta-catenin signaling. Cereb Cortex. 2008;18:2117–2131. doi: 10.1093/cercor/bhm238. [DOI] [PMC free article] [PubMed] [Google Scholar]
- Fukuchi-Shimogori T, Grove EA. Neocortex patterning by the secreted signaling molecule FGF8. Science. 2001;294:1071–1074. doi: 10.1126/science.1064252. [DOI] [PubMed] [Google Scholar]
- Galuske RA, Singer W. The origin and topography of long-range intrinsic projections in cat visual cortex: a developmental study. Cereb Cortex. 1996;6:417–430. doi: 10.1093/cercor/6.3.417. [DOI] [PubMed] [Google Scholar]
- Garel S, Marín F, Grosschedl R, Charnay P. Ebf1 controls early cell differentiation in the embryonic striatum. Development. 1999;126:5285–5294. doi: 10.1242/dev.126.23.5285. [DOI] [PubMed] [Google Scholar]
- Gordon JA, Stryker MP. Experience-dependent plasticity of binocular responses in the primary visual cortex of the mouse. J Neurosci. 1996;16:3274–3286. doi: 10.1523/JNEUROSCI.16-10-03274.1996. [DOI] [PMC free article] [PubMed] [Google Scholar]
- Guan K, Nayernia K, Maier LS, Wagner S, Dressel R, Lee JH, Nolte J, Wolf F, Li M, Engel W, et al. Pluripotency of spermatogonial stem cells from adult mouse testis. Nature. 2006;440:1199–1203. doi: 10.1038/nature04697. [DOI] [PubMed] [Google Scholar]
- Han SK, Abraham IM, Herbison AE. Effect of GABA on GnRH neurons switches from depolarization to hyperpolarization at puberty in the female mouse. Endocrinology. 2002;143:1459–1466. doi: 10.1210/endo.143.4.8724. [DOI] [PubMed] [Google Scholar]
- Hawrylycz M, Bernard A, Lau C, Sunkin SM, Chakravarty MM, Lein ES, Jones AR, Ng L. Areal and laminar differentiation in the mouse neocortex using large scale gene expression data. Methods. 2010;50:113–121. doi: 10.1016/j.ymeth.2009.09.005. [DOI] [PubMed] [Google Scholar]
- Hensch TK. Critical period mechanisms in developing visual cortex. Curr Top Dev Biol. 2005;69:215–237. doi: 10.1016/S0070-2153(05)69008-4. [DOI] [PubMed] [Google Scholar]
- Huffman KJ, Garel S, Rubenstein JL. Fgf8 regulates the development of intra-neocortical projections. J Neurosci. 2004;24:8917–8923. doi: 10.1523/JNEUROSCI.2086-04.2004. [DOI] [PMC free article] [PubMed] [Google Scholar]
- Inan M, Crair MC. Development of cortical maps: perspectives from the barrel cortex. Neuroscientist. 2007;13:49–61. doi: 10.1177/1073858406296257. [DOI] [PubMed] [Google Scholar]
- Khazipov R, Sirota A, Leinekugel X, Holmes GL, Ben-Ari Y, Buzsáki G. Early motor activity drives spindle bursts in the developing somatosensory cortex. Nature. 2004;432:758–761. doi: 10.1038/nature03132. [DOI] [PubMed] [Google Scholar]
- Kichula EA, Huntley GW. Developmental and comparative aspects of posterior medial thalamocortical innervation of the barrel cortex in mice and rats. J Comp Neurol. 2008;509:239–258. doi: 10.1002/cne.21690. [DOI] [PMC free article] [PubMed] [Google Scholar]
- Kim U, Ebner FF. Barrels and septa: separate circuits in rat barrels field cortex. J Comp Neurol. 1999;408:489–505. [PubMed] [Google Scholar]
- Kudo LC, Karsten SL, Chen J, Levitt P, Geschwind DH. Genetic analysis of anterior posterior expression gradients in the developing mammalian forebrain. Cereb Cortex. 2007;17:2108–2122. doi: 10.1093/cercor/bhl118. [DOI] [PubMed] [Google Scholar]
- Land PW, Erickson SL. Subbarrel domains in rat somatosensory (S1) cortex. J Comp Neurol. 2005;490:414–426. doi: 10.1002/cne.20677. [DOI] [PubMed] [Google Scholar]
- Landers M, Zeigler PH. Development of rodent whisking: trigeminal input and central pattern generation. Somatosens Mot Res. 2006;23:1–10. doi: 10.1080/08990220600700768. [DOI] [PubMed] [Google Scholar]
- Lee LJ, Chen WJ, Chuang YW, Wang YC. Neonatal whisker trimming causes long-lasting changes in structure and function of the somatosensory system. Exp Neurol. 2009;219:524–532. doi: 10.1016/j.expneurol.2009.07.012. [DOI] [PubMed] [Google Scholar]
- Lein ES, Hawrylycz MJ, Ao N, Ayres M, Bensinger A, Bernard A, Boe AF, Boguski MS, Brockway KS, Byrnes EJ, et al. Genome-wide atlas of gene expression in the adult mouse brain. Nature. 2007;445:168–176. doi: 10.1038/nature05453. [DOI] [PubMed] [Google Scholar]
- Liu Q, Dwyer ND, O'Leary DD. Differential expression of COUP-TFI, CHL1, and two novel genes in developing neocortex identified by differential display PCR. J Neurosci. 2000;20:7682–7690. doi: 10.1523/JNEUROSCI.20-20-07682.2000. [DOI] [PMC free article] [PubMed] [Google Scholar]
- Louderback KM, Glass CS, Shamalla-Hannah L, Erickson SL, Land PW. Subbarrel patterns of thalamocortical innervation in rat somatosensory cortical barrels: organization and postnatal development. J Comp Neurol. 2006;497:32–41. doi: 10.1002/cne.20969. [DOI] [PubMed] [Google Scholar]
- Lyckman AW, Horng S, Leamey CA, Tropea D, Watakabe A, Van Wart A, McCurry C, Yamamori T, Sur M. Gene expression patterns in visual cortex during the critical period: synaptic stabilization and reversal by visual deprivation. Proc Natl Acad Sci U S A. 2008;105:9409–9414. doi: 10.1073/pnas.0710172105. [DOI] [PMC free article] [PubMed] [Google Scholar]
- Lynn PM, Davies W. The 39, XO mouse as a model for the neurobiology of Turner syndrome and sex-biased neuropsychiatric disorders. Behav Brain Res. 2007;179:173–182. doi: 10.1016/j.bbr.2007.02.013. [DOI] [PubMed] [Google Scholar]
- Mangale VS, Hirokawa KE, Satyaki PR, Gokulchandran N, Chikbire S, Subramanian L, Shetty AS, Martynoga B, Paul J, Mai MV, et al. Lhx2 selector activity specifies cortical identity and suppresses hippocampal organizer fate. Science. 2008;319:304–309. doi: 10.1126/science.1151695. [DOI] [PMC free article] [PubMed] [Google Scholar]
- Martin JH. The corticospinal system: from development to motor control. Neuroscientist. 2005;11:161–173. doi: 10.1177/1073858404270843. [DOI] [PubMed] [Google Scholar]
- Meister M, Wong RO, Baylor DA, Shatz CJ. Synchronous bursts of action potentials in ganglion cells of the developing mammalian retina. Science. 1991;252:939–943. doi: 10.1126/science.2035024. [DOI] [PubMed] [Google Scholar]
- Metin C, Godement P, Imbert M. The primary visual cortex in the mouse: receptive field properties and functional organization. Exp Brain Res. 1988;69:594–612. doi: 10.1007/BF00247312. [DOI] [PubMed] [Google Scholar]
- Meyer G, Ferres-Torres R. Postnatal maturation of nonpyramidal neurons in the visual cortex of the cat. J Comp Neurol. 1984;228:226–244. doi: 10.1002/cne.902280209. [DOI] [PubMed] [Google Scholar]
- Miller B, Blake NM, Erinjeri JP, Reistad CE, Sexton T, Admire P, Woolsey TA. Postnatal growth of intrinsic connections in mouse barrel cortex. J Comp Neurol. 2001;436:17–31. [PubMed] [Google Scholar]
- Miller K, Kolk SM, Donoghue MJ. EphA7-ephrin-A5 signaling in mouse somatosensory cortex: developmental restriction of molecular domains and postnatal maintenance of functional compartments. J Comp Neurol. 2006;496:627–642. doi: 10.1002/cne.20926. [DOI] [PubMed] [Google Scholar]
- Miyashita-Lin EM, Hevner R, Wassarman K, Martinez S, Rubenstein JLR. Early neocortical regionalization in the absence of thalamic innervation. Science. 1999;285:906–909. doi: 10.1126/science.285.5429.906. [DOI] [PubMed] [Google Scholar]
- Moy SS, Nadler JJ. Advances in behavioral genetics: mouse models of autism. Mol Psychiatry. 2008;13:4–26. doi: 10.1038/sj.mp.4002082. [DOI] [PubMed] [Google Scholar]
- Mrsic-Flogel TD, Hofer SB, Creutzfeldt C, Cloëz-Tayarani I, Changeux JP, Bonhoeffer T, Hübener M. Altered map of visual space in the superior colliculus of mice lacking early retinal waves. J Neurosci. 2005;25:6921–6928. doi: 10.1523/JNEUROSCI.1555-05.2005. [DOI] [PMC free article] [PubMed] [Google Scholar]
- O'Leary DD, Chou SJ, Sahara S. Area patterning of the mammalian cortex. Neuron. 2007;56:252–269. doi: 10.1016/j.neuron.2007.10.010. [DOI] [PubMed] [Google Scholar]
- O'Leary DD, Sahara S. Genetic regulation of arealization of the neocortex. Curr Opin Neurobiol. 2008;18:90–100. doi: 10.1016/j.conb.2008.05.011. [DOI] [PMC free article] [PubMed] [Google Scholar]
- Pletnikov MV. Inducible and conditional transgenic mouse models of schizophrenia. Prog Brain Res. 2009;179:35–47. doi: 10.1016/S0079-6123(09)17905-0. [DOI] [PubMed] [Google Scholar]
- Portera-Cailliau C, Weimer RM, De Paola V, Caroni P, Svoboda K. Diverse modes of axon elaboration in the developing neocortex. PLoS Biol. 2005;3:e272. doi: 10.1371/journal.pbio.0030272. [DOI] [PMC free article] [PubMed] [Google Scholar]
- Ragsdale CW, Grove EA. Patterning the mammalian cerebral cortex. Curr Opin Neurobiol. 2001;11:50–58. doi: 10.1016/s0959-4388(00)00173-2. [DOI] [PubMed] [Google Scholar]
- Rakic P, Ayoub AE, Breunig JJ, Dominguez MH. Decision by division: making cortical maps. Trends Neurosci. 2009;32:291–301. doi: 10.1016/j.tins.2009.01.007. [DOI] [PMC free article] [PubMed] [Google Scholar]
- Redies C. Cadherins in the central nervous system. Prog Neurobiol. 2000;61:611–648. doi: 10.1016/s0301-0082(99)00070-2. [DOI] [PubMed] [Google Scholar]
- Redies C, Takeichi M. Cadherins in the developing central nervous system: an adhesive code for segmental and functional subdivisions. 1996. Dev Biol. 1996;180:413–423. doi: 10.1006/dbio.1996.0315. [DOI] [PubMed] [Google Scholar]
- Rice FL. Gradual changes in the structure of the barrels during maturation of the primary somatosensory cortex in the rat. J Comp Neurol. 1985;236:496–503. doi: 10.1002/cne.902360406. [DOI] [PubMed] [Google Scholar]
- Rice FL, Gomez C, Barstow C, Burnet A, Sands P. A comparative analysis of the development of the primary somatosensory cortex: interspecies similarities during barrel and laminar development, analysis of the development of the primary somatosensory cortex: interspecies. J Comp Neurol. 1985;236:477–495. doi: 10.1002/cne.902360405. [DOI] [PubMed] [Google Scholar]
- Rice FL, Van der Loos H. Development of the barrels and barrel field in the somatosensory cortex of the mouse. J Comp Neurol. 1977;171:545–560. doi: 10.1002/cne.901710408. [DOI] [PubMed] [Google Scholar]
- Rietze RL, Valcanis H, Brooker GF, Thomas T, Voss AK, Bartlett PF. Purification of a pluripotent neural stem cell from the adult mouse brain. Nature. 2001;412:736–739. doi: 10.1038/35089085. [DOI] [PubMed] [Google Scholar]
- Rubenstein JL, Anderson S, Shi L, Miyashita-Lin E, Bulfone A, Hevner R. Genetic control of cortical regionalization and connectivity. Cereb Cortex. 1999;9:524–532. doi: 10.1093/cercor/9.6.524. [DOI] [PubMed] [Google Scholar]
- Rubenstein JL, Rakic P. Genetic control of cortical development. Cereb Cortex. 1999;9:521–523. doi: 10.1093/cercor/9.6.521. [DOI] [PubMed] [Google Scholar]
- Ruiz i Altaba A, Gitton Y, Dahmane N. Embryonic regionalization of the neocortex. Mech Dev. 2001;107:3–11. doi: 10.1016/s0925-4773(01)00422-1. [DOI] [PubMed] [Google Scholar]
- Sandberg R, Yasuda R, Pankratz DG, Carter TA, Del Rio JA, Wodicka L, Mayford M, Lockhart DJ, Barlow C. Regional and strain-specific gene expression mapping in the adult mouse brain. Proc Natl Acad Sci U S A. 2000;97:11038–11043. doi: 10.1073/pnas.97.20.11038. [DOI] [PMC free article] [PubMed] [Google Scholar]
- Shen JX, Xu ZM, Yao YD. Evidence for columnar organization in the auditory cortex of the mouse. Hear Res. 1999;137:174–177. doi: 10.1016/s0378-5955(99)00149-5. [DOI] [PubMed] [Google Scholar]
- Shimamura K, Hirano S, McMahon AP, Takeichi M. Wnt-1-dependent regulation of local E-cadherin and alpha N catenin expression in the embryonic mouse brain. Development. 1994;120:2225–2234. doi: 10.1242/dev.120.8.2225. [DOI] [PubMed] [Google Scholar]
- Shimogori T, Banuchi V, Ng HY, Strauss JB, Grove EA. Embryonic signaling centers expressing BMP, WNT and FGF proteins interact to pattern the cerebral cortex. Development. 2004;131:5639–5647. doi: 10.1242/dev.01428. [DOI] [PubMed] [Google Scholar]
- Smith SL, Trachtenberg JT. Experience-dependent binocular competition in the visual cortex begins at eye opening. Nat Neurosci. 2007;10:370–375. doi: 10.1038/nn1844. [DOI] [PubMed] [Google Scholar]
- Stiebler I, Neulist R, Fichtel I, Ehret G. The auditory cortex of the house mouse: left-right differences, tonotopic organization and quantitative analysis of frequency representation. J Comp Physiol. 1997;181:559–571. doi: 10.1007/s003590050140. [DOI] [PubMed] [Google Scholar]
- Sur M, Rubenstein JL. Patterning and plasticity of the cerebral cortex. Science. 2005;310:805–810. doi: 10.1126/science.1112070. [DOI] [PubMed] [Google Scholar]
- Suter B, Nowakowski RS, Bhide PG, Caviness VS. Navigating neocortical neurogenesis and neuronal specification: a positional information system encoded by neurogenetic gradients. J Neurosci. 2007;27:10777–10784. doi: 10.1523/JNEUROSCI.3091-07.2007. [DOI] [PMC free article] [PubMed] [Google Scholar]
- Tritsch NX, Yi E, Gale JE, Glowatzki E, Bergles DE. The origin of spontaneous activity in the developing auditory system. Nature. 2007;450:50–55. doi: 10.1038/nature06233. [DOI] [PubMed] [Google Scholar]
- Tropea D, Sermasi E, Domenici L. Synaptic plasticity of feedback connections in rat visual cortex. Brain Res Dev Brain Res. 1999;118:61–67. doi: 10.1016/s0165-3806(99)00130-3. [DOI] [PubMed] [Google Scholar]
- Vanderhaeghen P, Lu Q, Prakash N, Frisén J, Walsh CA, Frostig RD, Flanagan JG. A mapping label required for normal scale of body representation in the cortex. Nat Neurosci. 2000;3:358–365. doi: 10.1038/73929. [DOI] [PubMed] [Google Scholar]
- Wagor E, Mangini NJ, Pearlman AL. Retinotopic organization of striate and extrastriate visual cortex in the mouse. J Comp Neurol. 1980;193:187–202. doi: 10.1002/cne.901930113. [DOI] [PubMed] [Google Scholar]
- Welker W. Analysis of sniffing of the albino rat. Behaviour. 1964;12:223–244. [Google Scholar]
- White EL, Weinfeld L, Lev DL. A survey of morphogenesis during the early postnatal period in PMBSF barrels of mouse SmI cortex with emphasis on barrel D4. Somatosens Mot Res. 1997;14:34–55. doi: 10.1080/08990229771204. [DOI] [PubMed] [Google Scholar]
- Woolsey TA, Van der Loos H. The structural organization of layer IV in the somatosensory region (SI) of mouse cerebral cortex. The description of a cortical field composed of discrete cytoarchitectonic units. Brain Res. 1970;17:205–242. doi: 10.1016/0006-8993(70)90079-x. [DOI] [PubMed] [Google Scholar]
- Woolsey TA, Welker C, Schwartz RH. Comparative anatomical studies of the SmI face cortex with special reference to the occurrence of “barrels” in layer IV. J Comp Neurol. 1975;164:79–94. doi: 10.1002/cne.901640107. [DOI] [PubMed] [Google Scholar]
- Wree A, Zilles K, Schleicher A. A quantitative approach to cytoarchitectonics. VIII. The areal pattern of the cortex of the albino mouse. Anat Embryol (Berl) 1983;166:333–353. doi: 10.1007/BF00305922. [DOI] [PubMed] [Google Scholar]
- Yang Y, Frankel WN. Genetic approaches to studying mouse models of human seizure disorders. Adv Exp Med Biol. 2004;548:1–11. doi: 10.1007/978-1-4757-6376-8_1. [DOI] [PubMed] [Google Scholar]
- Zhao C, Kao JP, Kanold PO. Functional excitatory microcircuits in neonatal cortex connect thalamus and layer 4. J Neurosci. 2009;29:15479–15488. doi: 10.1523/JNEUROSCI.4471-09.2009. [DOI] [PMC free article] [PubMed] [Google Scholar]
- Zhou C, Tsai SY, Tsai MJ. COUP-TFI: an intrinsic factor for early regionalization of the neocortex. Genes Dev. 2001;15:2054–2059. doi: 10.1101/gad.913601. [DOI] [PMC free article] [PubMed] [Google Scholar]
Associated Data
This section collects any data citations, data availability statements, or supplementary materials included in this article.