

Abstract
Diffusion Tensor magnetic resonance imaging and computational neuroanatomy are used to quantify postnatal developmental patterns of C57BL/6J mouse brain. Changes in neuronal organization and myelination occurring as the brain matures into adulthood are examined, and a normative baseline is developed, against which transgenic mice may be compared in genotype–phenotype studies. In early postnatal days, gray matter–based cortical and hippocampal structures exhibit high water diffusion anisotropy, presumably reflecting the radial neuronal organization. Anisotropy drops rapidly within a week, indicating that the underlying brain tissue becomes more isotropic in orientation, possibly due to formation of a complex randomly intertwined web of dendrites. Gradual white matter anisotropy increase implies progressively more organized axonal pathways, likely reflecting the myelination of axons forming tightly packed fiber bundles. In contrast to the spatially complex pattern of tissue maturation, volumetric growth is somewhat uniform, with the cortex and the cerebellum exhibiting slightly more pronounced growth. Temporally, structural growth rates demonstrate an initial rapid volumetric increase in most structures, gradually tapering off to a steady state by about 20 days. Fiber maturation reaches steady state in about 10 days for the cortex, to 30–40 days for the corpus callosum, the hippocampus, and the internal and external capsules.
Keywords: computational neuroanatomy, development atlas, diffusion tensor imaging, fractional anisotropy, mouse brain
Introduction
Investigating phenotype–genotype relationships calls for comparisons between genetically engineered mice and their wild-type strains. This study presents work toward characterizing the development of brain structure of the C57BL/6J mouse strain via imaging and computational image analysis methods, aiming to generate normative data against which the structure of various neurogenetic mice can be compared during the entire postnatal development period until adulthood. Understanding the role played by various genes in normal brain development, and their association with mutation effects in genetically engineered mice has received attention in the literature (Nolan et al. 2000; Paigen and Eppig 2000). Such studies have traditionally been based on histological analysis (Allen and McKeown 1979), which suffers from 2 major limitations. First, it is very laborious and requires certain level of human involvement, which limits its use to relatively small sample studies. Second, the studies based on such an analysis are confounded by distortions and artifacts emanating from sectioning and labeling. Magnetic resonance imaging (MRI) provides an alternative by overcoming these problems. Not only does it lead to relatively low level of distortion, but also the need for minimal human intervention makes it particularly suitable for large sample studies of genetically altered mice. A common strategy is to combine imaging with computational anatomy methods to find regions in the brain, which need to be analyzed, in greater detail through histological and gene expression studies. An ancillary benefit of MRI is that it provides structural data that closely parallels those for human subjects, thus enhancing the translational potential of the developmental studies in mice. Because MRI cannot yet provide the level of detail that is achievable in histology, it is generally viewed as a tool that can complement histology and help form more focused hypotheses to be investigated via histological analysis.
The characterization of the complex nature of genotype–phenotype relationships is very difficult without automated image analysis (Zijdenbos et al. 2002) based on neuroanatomical atlases (Williams and Doyle 1996; Kabani et al. 1998; Nissanov and Bertrand 1998; Jacobs et al. 1999; Dhenain et al. 2001; MacKenzie-Graham et al. 2004; O'Donnell and Westin 2006). The majority of existing automated approaches for mouse brain analyses have relied on structural MRI protocols such as T1 and T2 weighted images (Munasinghe et al. 1995; Kovacevic et al. 2005; MacKenzie-Graham et al. 2004; Dorr et al. 2007; Spring et al. 2007). Although they provide good contrast for differentiating between gray and white matter (GM and WM) in adult brains, they are not sufficient for prenatal or early postnatal brain development studies, due to poor image detail given the extremely small size of brain structures. Moreover, these conventional MR modalities fail to capture fiber architecture and regional connectivity, which limits their utility for the quantification of maturation patterns, such as the analysis of the formation of axonal projections, changes in myelination and glial structure and variations in regional connectivity. In such studies, diffusion tensor imaging (DTI) is relatively more informative; it not only characterizes the structural integrity of brain tissue (Pierpaoli et al. 1996; Bihan et al. 2001; Zhang et al. 2002), but also captures information about the anisotropy of the underlying tissue. Although imaging does not yet have sufficient resolution for resolving what exactly tissue characteristics yield different anisotropy patterns, it offers indications about potential underlying biological processes, such as elaboration of dendritic trees, myelination of fiber pathways, and development of glial scaffolding. In study of pathology induced variations, it can potentially capture genetic mutation effects, demyelination, and axonal degeneration (Castriota-Scanderbeg et al. 2002; Song et al. 2003; Huismana et al. 2005). These aspects of DTI make it very attractive in a wide range of longitudinal studies (Cascio et al. 2007) including mouse brain development (Mori et al. 2001; Zhang et al. 2003). However, effective analysis of large datasets of DTI images necessitates the development of fully automated techniques (Shen and Davatzikos 2002; Xu et al. 2003) for image analysis.
The main objective of this paper is to develop a normative atlas of the developing mouse brain, as well as image analysis tools, which may then be used to facilitate studies involving a number of genetic modifications in the mouse. Existing anatomical atlases have largely been derived from cross-sectional datasets, involving several human/rodent datasets of the same age (Dhenain et al. 2001; Joshi et al. 2004; Kovacevic et al. 2005; Ma et al. 2005) or from longitudinal data, where datasets spanned several ages, either using histological data (Website 2002) or MRI-based datasets (Jacobs et al. 1999; McKinstry et al. 2002; Boardman et al. 2003; Joshi et al. 2004; Kovacevic et al. 2005; Ma et al. 2005). Especially, for rodent brain, DTI-based analysis is a relatively new research area. Among the studies on adult animals, DTI has been employed for the reconstruction of axonal orientations in rats (Xue et al. 1999), as well as for capturing detailed anatomical information of WM structures (Zhang et al. 2002). In one of the earliest DTI-based murine developmental studies, Mori et al. (2001) demonstrated that DTI provides information that is complementary to the traditional MRI. Later studies capitalized on this work to characterize healthy maturation patterns through advanced image analysis of DTI data (Zhang et al. 2003; Verma et al. 2005; Larvaron et al. 2007), and to carryout disease specific studies (Xue et al. 2001; Song et al. 2003; Kim et al. 2006; Tyszka et al. 2006).
In this paper, we extend our previous work (Verma et al. 2005) to build a comprehensive DTI-based atlas of mouse brain development. A limitation of the previous DTI-based study was the small sample size (with a single dataset per time point), which affected the generalizability due to potentially large variations across developing brains and within the same day. We have therefore, enlarged the dataset to 31 mouse images (16 males and 15 females) acquired at 9 developmental stages during the postnatal period of 2–40 days of growth, with multiple samples at each stage. We then employed computational neuroanatomic analysis (Shen and Davatzikos 2002; Xu et al. 2003) to elucidate subtle changes in maturation and growth patterns with development. This study therefore, not only develops an analytic framework for high throughput analysis of murine brain data necessary for determining complex genotype–phenotype relationships, but also builds toward a developmental atlas of the CBL57/6J mouse that will serve as a normative baseline for genetic studies.
Materials and Methods
A dataset of high-resolution DTI of 31 inbred C57BL/6J mice at different development stages was studied (the dataset can be found at https://www.rad.upenn.edu/sbia/projects/mouse.html). C57BL/6 is the most widely used of all inbred strains, and has been used as the genetic baseline for the study of a large number of congenic strains covering both polymorphic and mutant loci. Mouse brains were first normalized to a common template, thereby eliminating subject-dependent spatial variability and allowing for voxel-based morphometric analysis. Temporal development was then analyzed through image features computed from the DTI data to account for the maturation and the growth of brain structures. The former was obtained from measurements of fractional anisotropy (FA) (Basser and Pierpaoli 1996), a measure related to microscopic tissue coherence, whereas the latter was captured through the Jacobian determinant (Davatzikos et al. 1996; Chung et al. 2001; Gerig et al. 2006) of the normalizing transformation, which reflects volumetric changes. Average feature maps were finally constructed for each time point, which were then regressed linearly to model temporal evolution of corresponding features. In addition, statistical tests were carried out to identify regions exhibiting statistically significant differences between young and old mice.
For the paper to be self-contained, we start with a brief introduction to DTI, along with a summary of its ability in capturing maturation patterns. This is followed by details of the dataset, its acquisition, preprocessing and analysis.
Diffusion Tensor Imaging
DTI provides a powerful imaging tool for macroscopically studying the neuronal organization, by capturing microscopic water diffusion characteristics along different orientations. In the healthy adult brain, WM structures are very well organized, as they are composed of tightly packed axonal bundles, allowing diffusion only in the axial directions. GM structures, on the other hand, do not exhibit a preferred direction of diffusion, as they are comprised of randomly oriented dendrites, restricting diffusion equally in all directions. These diffusive properties, however, develop with age, and reflect the spatiotemporal evolution of underlying neuronal structures. DTI models these local diffusion characteristics through a 3 × 3 positive definite symmetric matrix T, known as a diffusion tensor. Several features of interest (FOI) may then be extracted from diffusion tensors at various developmental stages for temporal characterization of tissue structure. Henceforth, we refer to these features as maturation features.
Tissue Maturation Features
A diffusion tensor T may equivalently be represented through an orthonormal basis formed by its eigen decomposition , where vi, i = 1, 2, 3, represent eigenvectors (also referred to as principal directions) with λi denoting the corresponding eigenvalues. Eigenvalues turn out to be positive because of the positive definitiveness of the tensor indicating the positiveness of water diffusivity. Eigenvectors corresponding to dominant eigenvalues indicate preferred direction of diffusion, with corresponding eigenvalues representing the magnitude of diffusivity along these directions. If λ2 and λ3 are negligible compared with λ1, then diffusion is highly anisotropic along the first principal direction, whereas equal eigenvalues amount to isotropic diffusion. Several quantities can be computed from the eigenvalues and eigenvectors that are demonstrative of the fact that variations in diffusivity and anisotropy are a direct consequence of the organization and compactness of the underlying neuronal pathways, which makes these representations ideal for capturing some interesting features for modeling organizational profiles. One such quantity is FA that represents the amount of deviation from isotropic diffusion:
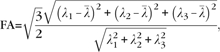 |
where  denotes mean diffusivity. FA assumes values in the range [0, 1], with values close to 0 representing isotropic diffusion, whereas values close to 1 denoting highly anisotropic diffusion. In some cases, trace of the diffusion tensor, which is the sum of the eigenvalues, is a more suitable feature when one is interested in the magnitude of water diffusivity at a voxel.
Data Set
Inbred mice of the C57BL/6J strain were used in the study. Brains of these mice were scanned ex vivo using DTI protocol at various developmental stages. Because brain development is typically more pronounced in early postnatal stages, which gradually tapers off to a steady state in about 5–6 weeks after birth, we sampled the postnatal period of 40 days densely in the early postnatal days and consequently acquired 31 DTI images on days 2, 3, 5, 7, 10, 15, 20, 30, and 40 as tabulated in Table 1, with multiple images per day. Gender bias was circumvented by considering similar numbers of female and male mice (15 and 16, respectively). Experiments were designed with the approval of animal research committees at the Johns Hopkins University and the University of Pennsylvania.
Table 1.
Grouping of mouse data into young (2–7 days old) and adult (10–40 days old), and their gender-wise distribution
| Day | Young |
Adult |
|||||||
| 2 | 3 | 5 | 7 | 10 | 15 | 20 | 30 | 40 | |
| Number of females | 2 | 1 | 3 | 4 | 2 | 2 | 0 | 0 | 1 |
| Number of males | 2 | 2 | 0 | 4 | 3 | 3 | 1 | 1 | 0 |
Sample Preparation and Image Acquisition
C57BL/J6 breeding pairs (obtained from The Jackson Laboratory) were housed together and maintained in a 12-h light and dark schedule with ad libitum access to food and water. The pairs were closely monitored and the date of birth for a litter was designated as day 0; mice were then obtained according to the predetermined schedule, as described earlier and given in Table 1. Whenever possible all pups for any given age were of the same litter.
On the designated day, pups were anesthetized with isoflurane, an inhalation anesthetic, and transcardially perfused. Briefly, blood was first flushed from the animal with a perfusion of phosphate-buffered saline (PBS) and heparin (to prevent clotting). This was followed by perfusion with 4% paraformaldehyde (pH 7.4) to fix the tissues. The head was then decapitated and allowed to postfix in 4% paraformaldehyde, for at least one day prior to the dissection of the brain. A dissecting scope was used to ensure that only brains free from damage due to the dissection were used for the DTI scan. Additionally, due to the size and thinness of the skull, brains of mice younger than day 7 were not dissected out to avoid damaging the tissue. Samples were then stored in 4% paraformaldehyde for >1 month.
Before scanning, all specimens were placed in PBS solution for more than 48 hours to wash off the fixation solution. They were then kept in formbin-filled custom-built MR compatible tubes during scanning to avoid dehydration. Scanning was carried out in a 9.4 T Bruker scanner equipped with triple-axis gradients, and Bruker commercial volume coils (10–25 mm inner diameter) as dual purpose radio-frequency transmitter and receiver. DTI acquisition is usually based on single shot-echo planar imaging (SS-EPI), which helps in attaining small imaging times. SS-EPI, however, suffers from large distortions at tissue/air boundary due to B0-inhomogeneity susceptibility. To avoid this problem, three-dimensional (3D) multiple spin echo sequence was employed in this study with echo train length of 6 to acquire diffusion weighted images. Within each time repetition (TR), each of 6 echoes was used to acquire the k-space data of an individual 3D volume image. Parameters for Diffusion Weighted Imaging (DWI) were field of view = (8–16 mm) × (8–10 mm) × (8–10 mm), 3D imaging matrix = 128 × 80 × 80 (zero-filled to 128 × 128 × 128), time echo = 34 ms, TR = 800 ms, 6 independent diffusion weighted directions with b value = 1758 s/mm2, 2 additional images with minimal diffusion weighting (b = 143 s/mm2). The gradient orientations for 6 strong diffusion weighted images and 1 minimum diffusion weighed image were [3, 3, 3], [17, 17, 3], [17, 3, 17], [3, 17, 17], [17, −17, 3], [−17, 3, 17], [3, 17, −17]. The minimum diffusion weighting image was associated with the gradient [3, 3, 3]. Native image resolutions ranged from 62.5 μm × 100 μm × 100 μm to 125 μm × 125 μm × 125 μm. Two signal averages were used. The images were further averaged from 6 echoes of each repetition time.
Each specimen was subjected to lengthy high-resolution DTI acquisition of about 20 h, which is almost impossible for an anesthetized live animal, necessitating premortem fixation outlined above. Although fixation chemicals inevitably change cytoarchitecture, studies have found that FA is equivalent in live and fixed mouse brains (Sun et al. 2003, 2005). This helped in eliminating the complication of autolysis on diffusion properties (D'Arceuil and Crespigny 2007).
DT Image Processing
In addition to temporal variability due to development, mice brains exhibit sufficient morphological variability even when they are of the same litter and genetic background. It is, therefore, necessary that all images are normalized to the same coordinate space, so that spatial coordinates within the brain can be directly compared in terms of imaging characteristics. This results in spatially coregistered datasets and enables both voxel-based and region of interest (ROI)–based analyses in the template space. In addition, the spatial normalization transformation provides a relative measure of structural growth rates and size differences across different brains; a spatial transformation representing expansion or contraction from one brain to another reflects size differences between the 2 brains. We spatially normalized all images to a common template through an elastic registration of FA maps using a deformable registration method called HAMMER (Shen and Davatzikos 2002), which employs hierarchical matching of anisotropic features (FA maps) in addition to morphological characteristics of the underlying anatomy. This was then incorporated into a framework for spatial normalization of DTI data that reorients tensors, to avoid generation of biologically incorrect pathways as a result of simple displacements (Xu et al. 2003). Day 10 was selected as the template as it lies in the middle of the developmental period being examined here. In order to account for large structural differences between day 10 and younger brains, we employed indirect warping through intermediate templates for brains younger than day 7, a strategy that has been shown to yield higher level of accuracy (Baloch et al. 2007). A complete registration schematic is given in Figure 1. The day 2 brain was warped to day 3, day 3 to day 5 and so on to day 10. These transformations were then concatenated to obtain the transformation from day 2 to day 10. This procedure was followed for all the brains less than the age of day 10. Because the growth between subsequent days is small, the registration errors are less on concatenating the fields.The resulting elastic transformations were used to warp various structures to the corresponding ones in the template as shown in Figure 2. A visual indication of the accuracy of the registration process is provided by the clarity of the average of all normalized FA maps. The quantitative analysis of the registration algorithm has been well studied for human brains (Shen and Davatzikos 2002). Because the accuracy of this study depends on the registration process, we carried out additional validation experiments with mouse brains. Several anatomical landmark points were identified on the template mouse brain of day 10, which are shown in Figure 3. Two raters then manually, but independently, selected correspondences twice on a brain of day 5 and another of day 40. An analysis of inter- and intrarater variability and comparison with the correspondences of these points identified by the algorithm is provided in Table 2, where overall mean error was found to be 0.214 mm ± 0.12 mm.
Figure 1.

Spatial normalization schematic. Brains younger than day 7 are registered indirectly to the template to achieve higher level of accuracy.
Figure 2.

Spatial normalization. All brains are normalized to a common template selected on day 10. Although coregistration establishes correspondences, it maintains the FA values intact. (Top) Coregistration of 2 examples from day 2 and day 40. (Bottom) Clarity of mean normalized brain indicates registration accuracy.
Figure 3.

Analysis of registration accuracy. Fourteen landmarks were selected in the template. Same landmarks were dropped independently in 2 images one each from day 5 and day 40. Landmarks are then mapped to the template space using (Shen and Davatzikos 2002; Xu et al. 2003), before comparing the disagreement between the mapped landmarks and the template landmarks.
Table 2.
Registration accuracy analysis
| Error statistic | Rater 1 |
Rater 2 |
Combined | ||
| Day 5 | Day 40 | Day 5 | Day 40 | ||
| Mean (mm) | 0.239 | 0.204 | 0.248 | 0.1736 | 0.214 |
| Standard deviation (mm) | 0.107 | 0.109 | 0.164 | 0.1027 | 0.12 |
| Maximum (mm) | 0.461 | 0.382 | 0.591 | 0.4025 | 0.591 |
| Minimum (mm) | 0.104 | 0.06 | 0.085 | 0.06 | 0.06 |
Note. Two raters were asked to independently place landmarks on the template and twice on one brain each from day 5 and day 40. Land marked images were warped using shape transformations employed in subsequent analysis. Four statistics were computed to represent registration error.
Volumetric Growth Features
We proceeded to further exploit the composite transformation to capture local rate of volumetric variations with age through the logarithm of its Jacobian determinant (LJD), which provides a measure of volumetric growth in this longitudinal dataset. As customary in computational neuroanatomy, logarithmic scale was used, as it eliminates the highly nonlinear and skewed behavior of Jacobian determinant, thereby providing a measure that is easier to interpret. Normalized tissue maturation and volumetric growth features were then employed for subsequent analyses.
Analysis of DTI Data
We used the feature maps defined above in 2 types of analyses: 1) voxel-based analysis and 2) ROI based analysis. In voxel-based analysis, entire feature maps were spatially normalized and used for the creation of average maps, difference maps and voxel-wise regression maps, to provide comprehensive information about the spatiotemporal variations. It should be noted that both analyses were carried out in the template space. An additional advantage of the registration algorithm employed for normalization follows from its ability to match structures with similar shapes and anisotropic spatial profiles to each other. As a result, one may readily mark the boundaries of structures (or ROIs) of interest (SOIs) in the template, and subsequently transfer them to the entire dataset to identify corresponding SOI, thereby allowing characterization of developmental profile of each structure. To this end, we manually marked 11 ROIs in the template for major neuronal structures, including the genu of corpus callosum (gcc), splenium of corpus callosum (scc), Hippocampus (hc), internal capsule (ic), external capsule (ec), left cortex (ctxl), right cortex (ctxr), cerebellum (cbl), anterior commissure (ac), triangular septal nucleus (tsn), and amygdala (am), as illustrated in Figure 4. Average FA and diffusivity for each ROI were computed, to determine the maturation patterns of these structures. Such an ROI based analysis provided more localized information about spatiotemporal changes. These analysis methods were grouped into experiments that model the spatial group-wise changes as well as experiments that elucidate the temporal changes.
Figure 4.

Regions of interest were dropped in the template corresponding to marked structures, which were then transferred to average feature maps for each day using the transformation for spatial normalization.
Results
In this section, we provide results from 2 sets of experiments:a spatiotemporal modeling of mouse brain to obtain a developmental profile, which will later be validated with group-wise analysis on tissue maturation and volumetric growth feature maps defined earlier. A more detailed spatiotemporal profile was constructed by computing average feature maps for each time point, which were then regressed linearly to model their temporal evolution. In addition, ROIs were introduced and the evolution of respective FOIs was analyzed through time curves. The temporal evolution model was finally validated through a group-wise analysis, by dividing the dataset into young and old mice as indicated in Table 1. Statistical tests were carried out to identify statistically significant regions of group differences between the 2 groups, before comparing the results with temporal profiles. A detailed description of the experiments is given below.
Spatiotemporal Modeling of a Developmental Profile
Mean maps for maturation (FA and trace) and volumetric growth (LJD) features were computed for each day to visually highlight their regional changes on a day-to-day basis. Mean FA maps given in Figure 5, for instance, indicate increased coherence of WM tracts with age.Changes in each day are not significant due to the low sample size. To evaluate the rate of change in FOIs with age, a voxel-wise linear regression of mean feature maps was carried out, where the independent variable age was considered on a logarithmic scale. The slope of voxel-wise regression curves was then used to construct regression maps as shown in Figure 6 (regression of FA maps), and Figure 7 (regression of LJD maps), where negative values represent a decrease whereas positive values illustrate an increase in the FOI. For instance, Figure 6 shows a considerable decrease of anisotropy in GM cortical and hippocampal structures. On the other hand, WM structures such as ic, ec, cc, and cbl register a pronounced increase in FA. Regression maps for LJD indicate an increase (positive slope) in the descriptor with age corresponding to all structures, highlighting their physical growth, for instance, a slight thickening coupled with elongation of cc.
Figure 5.

Average daily FA means of day 2 to day 15 (Top rows: Axial view; Bottom rows: Coronal view) indicate a gradual decline in FA values in GM structures such as cortex, and a steady increase in FA in GM structures. A drop of 31% was observed in cortex from day 2 to day 5. Corresponding variance maps indicated small values except at the boundaries of various structures due to slight registration errors.
Figure 6.

FA based regression map indicates gradual decline in FA values in cortex and hippocampus, showing progressive maturation in these structures with age as dendritic trees elaborate. WM structures, on the other hand, register steady increase in FA values, with the formation of tightly packed axonal pathways.
Figure 7.

Regression map based on log of Jacobian determinant indicates somewhat spatially heterogeneous growth rates. Cortex and cerebellum grow at a higher rate as indicated by regions in red.
Mean maps for various FOIs were masked by each ROI to compute average feature representations, which were then plotted against age as in Figure 8 with corresponding standard deviation plots for FA given in Figure 9. Results show that FA and LJD demonstrate a pronounced initial change, which gradually tapers off in later stages of postnatal period. Most structures indicate steadying of volumetric growth rate by day 20. Tissue maturity, on the other hand, varies across different parts of the brain. For instance, the cortex reaches steady state after around day 10, whereas ccg, ccs, hs, ic, ec, and ac take 30–40 days to acquire maturation steady state. In contrast to FA and LJD, trace does not follow a generalizable temporal trend, except in the cortex and cbl. In fact, for the latter, trace turns out to be more effective than other features because it captures the magnitude of diffusivity irrespective of the preferred direction of diffusion.
Figure 8.
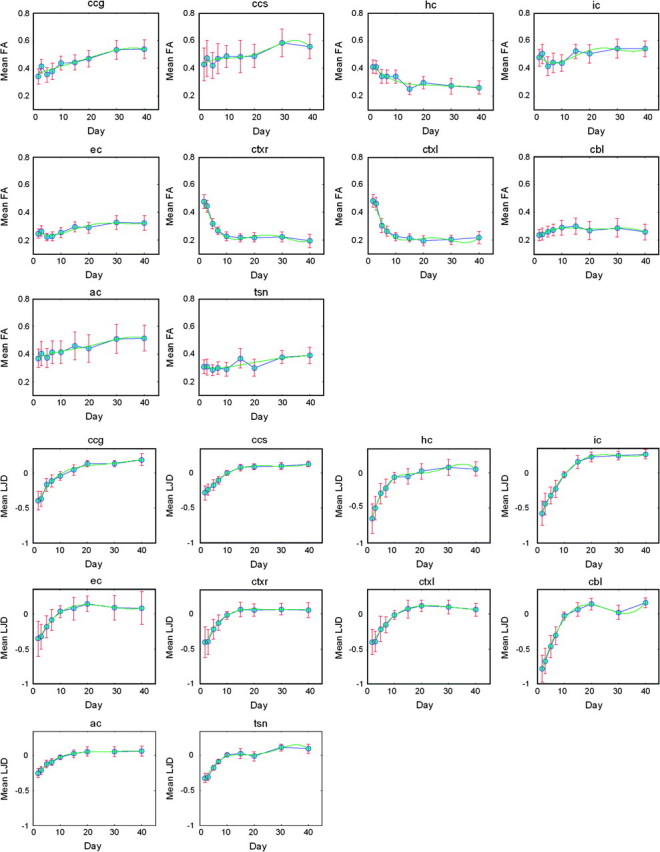
ROIs highlighted in Figure 4 allowed computation of daily means for FOIs in corresponding ROIs for capturing temporal profiles: (Top 3 Rows) Temporal profiles for FA based mean FOIs: All structures indicate a gradual increase in FA, except cortex and cerebellum. Decay in FA values in the cortical regions is found to be exponential; (Bottom 3 Rows) Temporal profiles for LJD (log10 scale) based mean FOIs: LJD indicates very large volumetric growth rates with an exponential profile that tapers off around day 20. Error bars indicate the standard deviation of the variation within a ROI.
Figure 9.

Mean standard deviation plots for FA as a function of time indicate the amount of variation in the corresponding ROI for a given day. Corresponding mean FA plots are given in Figure 8 (Top).
Group-wise Analysis
Voxel-wise 2 sided t-tests were carried out to find regions of significant differences between young and adult brains (Table 1) using maturation and growth features. P-value maps given in Figure 10 indicate regions of significant maturation differences (P ≤ 0.001) along cortex, cbl, cc, ic, ec, ac, hc, tsn, and am in terms of FA. Corresponding difference maps are shown in the second row of Figure 10, where negative values for cortex and hc indicate lesser coherency in adults. On the other hand, WM structures become more organized and anisotropic in later postnatal stages. Trace-based P-maps given in Figure 12 picks up some differences (P ≤ 0.001) in the cortex, ic, ec, and hc. Its main strength, however, lies in capturing organizational differences in the cerebellum, where it performs much better than FA. For growth differences, LJD based P-map (on logarithmic scale in Fig. 13) shows mostly uniform trend across the brain, with the exception of significant structural growth rate differences in cerebellum and cortex.
Figure 10.

Statistical tests on FA maps indicate regions of significant differences in maturation between young and old brains. (Top) Log of FA based P-maps; (Bottom) Difference map between the 2 groups highlighting changes in old brains versus young. GM cortical and hippocampal regions show a drop in FA values (indicated by blue) whereas WM structures such as ic, ec, genu, and splenium of cc, show an increase in FA values (indicated by red). Corresponding percent variations are given in Figure 14. The regional changes correspond to WM tracts which can be seen by comparing with Figure 8.
Figure 12.

Statistical tests on trace indicate regions of significant organizational differences between young and old brains. (Top) Log of trace-based P-maps. (Bottom) Difference map between the 2 groups highlighting changes in old brains versus young. Regions of significant (P = 10−6) growth rate differences were found in the cerebellum. Corresponding percent variations are given in Figure 14.
Figure 13.

Statistical tests on LJD maps indicate regions of significant volumetric differences between young and old brains. (Top) Difference map between the 2 groups. (Bottom) Log of LJD based P-maps highlighting changes in old brains versus young. Regions of significant (P ≤ 10−3) growth rate differences were found in the cerebellum. Corresponding percent variations are given in Figure 14.
Percent maturation and growth differences between young and adult brains in the ROIs shown in Figure 4 were evaluated as shown in Figure 14 and given in Table 3 using above described ROIs. Maturation differences were found to be the largest between the 2 groups for cortical regions, and smallest for ic. Structural growth, on the other hand, is mostly homogeneous throughout the brain with ic, ec, and ccs exhibiting largest growth differences. Notice that trace is less discriminatory than FA except in the cerebellum, because these 2 quantities represent different physical tissue properties. The latter captures the level of anisotropy in diffusion of water molecules, whereas the former indicates the cumulative diffusion. As a result, regions that get more anisotropic with age show large group differences between the 2 groups, even though the cumulative diffusion stays almost the same.
Figure 14.
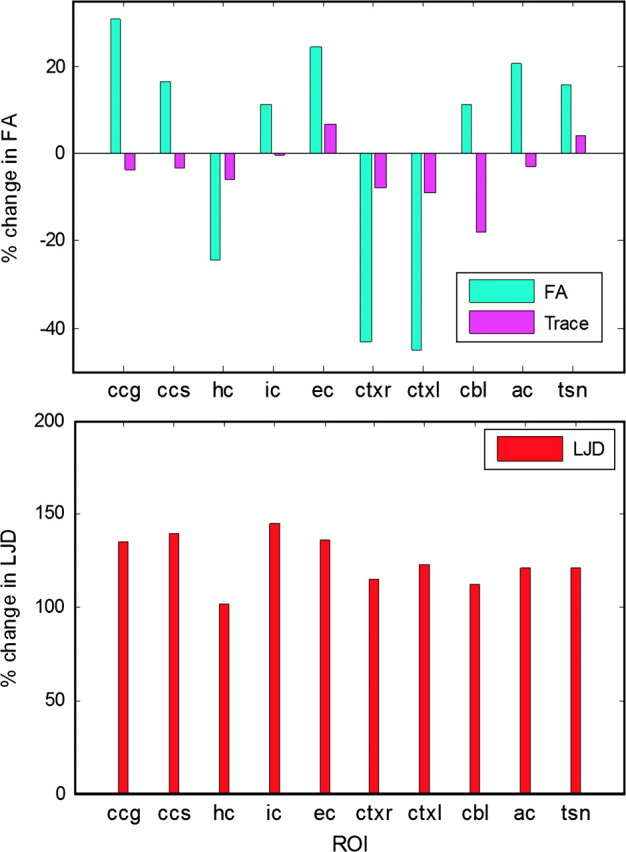
Percent group differences for various FA, trace and LJD computed from ROIs highlighted in Figure 4. Cortex exhibits a huge drop in FA. LJD changes are almost similar in all structures, indicating a uniform growth of the brain.
Table 3.
Percent change in various FOI from youth to adulthood
| Features | ROIs |
|||||||||
| ccg | ccs | hc | ic | ec | ctxr | ctxl | cbl | ac | tsn | |
| FA | 30.6 | 16.6 | −24.4 | 11.4 | 24.4 | −43.0 | −44.9 | 11.3 | 20.5 | 15.5 |
| Trace | −3.6 | −3.3 | −6.1 | −0.44 | 6.8 | −7.8 | −8.9 | −18.0 | −2.9 | 4.1 |
| LJD | 134.9 | 139.8 | 102.1 | 145.1 | 136.5 | 115.3 | 122.7 | 112.7 | 121.2 | 121.4 |
Note. Rows correspond to FA, trace and LJD based features, whereas columns indicate their percentage variations in various ROIs as highlighted in Figure 4.
Discussion
This paper utilizes a computational neuroanatomic image analysis framework to quantify structural maturation and growth patterns of the mouse brain in early postnatal period. Thirty one scans were acquired in this study where mice were carefully age matched. DTI was used, because it provides excellent tissue contrast at early postnatal ages, where conventional MR imaging fails. Moreover, DTI allowed examination of the maturation process of major WM pathways, as well as that of the cortex, via measurements of microscopic diffusion anisotropy. Spatial normalization of the DTI to a template plays an important role in the analysis, allowing elimination of subject-dependent spatial variability which is evident from the crispness of FA weighted average principal direction map (color coding is typically employed for illustration purposes only to represent vector maps with each component indicated by a corresponding component in the RGB color space) given in Figure 11. Consequently, the only variability remaining in the normalized images follows from the diffusion properties of individual brains, which are indicative of the maturation, and are subsequently captured through appropriate feature maps.
Figure 11.

Average FA weighted first principal direction maps illustrated through color maps, where each component of a principal direction is represented as a color component. Principal direction map depicts fiber orientations in a brain. Crispness of the average color maps highlights high level of registration accuracy. As a result, after normalization most of inter-subject variability is carried in FA maps.
Results support our hypothesis that DTI contains information for analyzing growth of various brain structures, which will allow for comparisons between healthy and pathological anatomies. This paper focuses only on building a normative atlas of the mouse brain without genetic abnormalities; any departure from it may readily be analyzed using standard pattern analysis approaches. We have created a spatiotemporal developmental profile of mice using features extracted from DT images characterizing the growth patterns, by employing deformation-based morphometry. This profile is a precursor to a comprehensive normative atlas of mouse brains that is part of our currently ongoing and future work. Although an analysis of FA (anisotropy) and trace (diffusivity) provides a characterization of variations in the maturation of the normal mouse brain, the analysis of LJD of the normalizing transformation quantifies the structural growth patterns of the normative mice strain.
Several interesting observations follow directly from the analysis. In early infancy, high FA values in the cortical regions suggest underdeveloped dendrites form a radial structure together with cell bodies, axons and glia (Valverde 1967; McKinstry et al. 2002). However, a sharp drop in FA values was observed during the early postnatal period, with almost 30% in first 5 days, which is commensurate with rapid formation of dendrites and rise in synaptic density that occur at these developmental stages (Bayer and Altman 1991). In total, FA values drop by an average of 58%, reaching their steady state by day 10 (Fig. 8).
Tissue maturation patterns are found to be extremely heterogeneous. Although the sample size is small to attain significance in the day-wise changes, the temporal trends are highly indicative of maturation patterns. The hippocampus, for instance, exhibits a decrease in FA by 42%, but this decrease is more pronounced in first 15 days of the postnatal period (Fig. 8). WM structures, on the other hand, show an increase in tissue anisotropy, which may be attributed to the development of tightly packed axonal pathways coupled with their gradual myelination (Bihan 2003).In the corpus callosum, FA is relatively higher in the splenium than that in the genu at the time of the birth, and steadily increases by 17 and 52%, respectively, to reach a steady state in around 30 days, indicating a gradually enhanced connectivity between the left and right hemispheres. In fact, the splenium is one of the most anisotropic and tightly packed parts of the brain from the onset, with FA values much higher than in any of the other parts of the brain. These relatively small FA changes in the splenium are in accordance with some recent findings by Larvaron et al. (2007), who reported FA variations only in the genu. Internal and external capsules exhibit a totally different behavior compared with other structures. In the first few days of infancy, FA values dip before rising again, attaining the steady state in around 30 days, with a net increase of 14% and 33% respectively, which may be indicative of a slow maturing tract. On the other hand, the anterior commissure shows an almost linear increase of 42% reaching maturity in 30–40 days. This is in contrast to (Larvaron et al. 2007), which failed to detect any differences in ac in terms of FA values. This discrepancy may be due to the use of affine transformation for spatial normalization in (Larvaron et al. 2007), which typically fails to register such small structures well and hence confounds the analysis. Our use of nonlinear transformation precisely aligns the anterior commisures of various brains, leading to more accurate analysis. Most WM structures attain maturity by day 30, indicating the possible formation of tightly packed bundles of myelinated axons that allow diffusion only along axial directions (McKinstry et al. 2002; Bihan 2003). These evaluations illustrated higher cohesiveness of WM fiber tracts in adult mice as compared with young mice.
The statistical significance of the spatiotemporal maturation patterns described above was confirmed by the t-tests between young and adult mice. Significant differences were readily observed in the corresponding regions, as indicated by low P-values (P < 0.05), with the exception of the cerebellum, where the addition of multiple folds complicates anatomical correspondence. In this situation, we found that trace provides a better feature due to its reliance on cumulative diffusivity, as demonstrated by the t-test on trace. For FA, average P-values for various structures range from 10−4.5 in the cortex to 10−1.9 in ec, whereas 10−2.5, 10−3.3, 10−2.2, 10−2, 10−3, and 10−2.7 was observed respectively in ccs, ccg, hc, ac, am, and ic, indicating highly significant values. Even within the cortex, initially middle to superficial layers demonstrate poorest dendritic development as indicated by high FA values early on, and spatially they exhibit the most temporal variation. In fact, in the early puerperal period, cortical dendrites continue to develop outwards, resulting in a rapid decrease in anisotropy in the outer cortical layers.
Cortical structural growth on the other hand follows a uniform pattern, with near exponential growth rate initially (indicated by a visual inspection of the graph in Fig. 8) but tapering off after 15–20 days. Subsequently the growth rate stays almost constant at the steady state. During this period, not only does the brain get more organized as illustrated by FA- and trace-based analysis, there is a growth in neurons with the enlargement of brain structures. Increase in anisotropy of WM structures (Fig. 14), for instance, may be a consequence of several interesting phenomena such as progressive myelination of neurons, and tightening of fiber bundles due to increase in the number of axonal fibers. A possible explanation for the reduction of FA values in the cortex, on the other hand, is the development and multiplication of dendrites. Because initial structural growth is exponential, this coupled with dendritic tree elaboration explains the dramatic decrease in FA in first 5 days. Overall cortex and cerebellum displayed highest growth rates. After full physical growth, structural growth rate should drop to zero, which has not been observed in first 40 days. In future, we will expand our dataset by adding only more controls and also extend the temporal span to 80 days to analyze these phenomena.We will also acquire data of both genders for each day in order to determine gender differences.
The results clearly demonstrate the importance of DTI morphometry for analyzing spatiotemporal maturation and growth patterns. High-resolution DTI images play a major role in precisely capturing diffusion properties of anatomical structures, which were later exploited to characterize developmental patterns of the murine brain. We plan to continue to work toward the generation of a comprehensive mouse developmental atlas which will eventually serve as a baseline for normative development against which genetically modified mice and those demonstrating pathological aberrations (Tyszka et al. 2006) may be compared with determine spatiotemporal growth and maturation differences. It will also be interesting to examine brain morphology in mice with altered development, as a result of embryo manipulations (including in vitro fertilization and embryo culture), maternal separation or environmental enrichment.As part of the atlas, we will analyze gender differences in maturation and growth, as well as variation of brain structure within the same strain and age, which is presumably due to environmental factors.
Data Set
The details of the data set and the diffusion tensor images can be found at http://www.rad.upenn.edu/sbia/projects/mouse.html. Details of the processing pipeline as well as the registration algorithm can also be found at http://www.rad.upenn.edu/sbia.
Acknowledgments
Conflict of Interest: None declared.
References
- Allen IV, McKeown SR. A histological, histochemical and biochemical study of the macroscopically normal white matter in multiple sclerosis. J Neurol Sci. 1979;41:81–91. doi: 10.1016/0022-510x(79)90142-4. [DOI] [PubMed] [Google Scholar]
- Baloch S, Verma R, Davatzikos C. An anatomical equivalence class based joint transformation-residual descriptor for morphological analysis. Inf Process Med Imaging. 2007;4584:594–606. doi: 10.1007/978-3-540-73273-0_49. [DOI] [PubMed] [Google Scholar]
- Basser PJ, Pierpaoli C. Microstructural and physiological features of tissues elucidated by quantitative-diffusion-tensor MRI. J Magn Reson B. 1996;111:209–219. doi: 10.1006/jmrb.1996.0086. [DOI] [PubMed] [Google Scholar]
- Bayer SA, Altman J. Neocortical development. New York: Raven Press; 1991. [Google Scholar]
- Bihan DL. Looking into the functional architecture of the brain with diffusion MRI. Nat Rev Neurosci. 2003;4:469–480. doi: 10.1038/nrn1119. [DOI] [PubMed] [Google Scholar]
- Bihan DL, Mangin J-F, Poupon C, Clark CA, Pappata S, Molko N, Chabriat H. Diffusion tensor imaging: concepts and applications. J Magn Reson Imaging. 2001;13:534–546. doi: 10.1002/jmri.1076. [DOI] [PubMed] [Google Scholar]
- Boardman JP, Bhatia K, Counsell S, Allsop J, Kapellou O, Rutherford MA, Edwards AD, Hajnal JV, Rueckert D. An evaluation of deformation-based morphometry applied to the developing human brain and detection of volumetric changes associated with preterm birth. Lecture Notes Comput Sci. 2003;2878:697–704. [Google Scholar]
- Cascio CJ, Gerig G, Piven J. Diffusion tensor imaging: application to the study of the developing brain. J Am Acad Child Adolesc Psychiatry. 2007;46:213–223. doi: 10.1097/01.chi.0000246064.93200.e8. [DOI] [PubMed] [Google Scholar]
- Castriota-Scanderbeg A, Sabatini U, Fasano F, Floris R, Fraracci L, Mario DM, Nocentini U, Caltagirone C. Diffusion of water in large demyelinating lesions: a follow-up study. Neuroradiology. 2002;44:764–767. doi: 10.1007/s00234-002-0806-y. [DOI] [PubMed] [Google Scholar]
- Chung MK, Worsley KJ, Paus T, Cherif C, Collins DL, Giedd JN, Rapoport JL, Evans AC. A unified statistical approach to deformation-based morphometry. Neuroimage. 2001;14:595–606. doi: 10.1006/nimg.2001.0862. [DOI] [PubMed] [Google Scholar]
- D'Arceuil H, Crespigny Ad. The effects of brain tissue decomposition on diffusion tensor imaging and tractography. Neuroimage. 2007;36:64–68. doi: 10.1016/j.neuroimage.2007.02.039. [DOI] [PMC free article] [PubMed] [Google Scholar]
- Davatzikos C, Vaillant M, Resnick S, Prince JL, Letovsky S, Bryan RN. A computerized approach for morphological analysis of the corpus callosum. J Comput Assist Tomogr. 1996;20:88–97. doi: 10.1097/00004728-199601000-00017. [DOI] [PubMed] [Google Scholar]
- Dhenain M, Ruffins SW, Jacobs RE. Three-dimensional digital mouse atlas using high-resolution MRI. Dev Biol. 2001;232:458–470. doi: 10.1006/dbio.2001.0189. [DOI] [PubMed] [Google Scholar]
- Dorr A, Sled JG, Kabani N. Three-dimensional cerebral vasculature of the CBA mouse brain: a magnetic resonance imaging and micro computed tomography study. Neuroimage. 2007;35:1409–1423. doi: 10.1016/j.neuroimage.2006.12.040. [DOI] [PubMed] [Google Scholar]
- Gerig G, Davis B, Lorenzen P, Xu S, Jomier M, Piven J, Joshi S. Computational anatomy to assess longitudinal trajectory of brain growth. Proceedings of the 3rd International Symposium on 3D Data Processing, Visualization, and Transmission (3DPVT) 2006 Chapel Hill, NC: IEEE. p. 1041–1047. [Google Scholar]
- Huismana TAGM, Boltshauserb E, Martina E, Nadalc D. Diffusion tensor imaging in progressive multifocal leukoencephalopathy: early predictor for demyelination? Am J Neuroradiol. 2005;26:2153–2156. [PMC free article] [PubMed] [Google Scholar]
- Jacobs RE, Ahrens ET, Dickinson ME, Laidlaw D. Towards a micro MRI atlas of mouse development. Comp Med Imaging Graph. 1999;23:15–24. doi: 10.1016/s0895-6111(98)00059-7. [DOI] [PubMed] [Google Scholar]
- Joshi S, Davis B, Jomier M, Gerig G. Unbiased diffeomorphic atlas construction for computational anatomy. Neuroimage. 2004;23:S151–S160. doi: 10.1016/j.neuroimage.2004.07.068. [DOI] [PubMed] [Google Scholar]
- Kabani N, MacDonald D, Holmes CJ, Evans A. A 3D atlas of the human brain. Neuroimage. 1998;7:S717. [Google Scholar]
- Kim JH, Budde MD, Liang H-F, Klein RS, Russell JH, Cross AH, Song S-K. Detecting axon damage in spinal cord from a mouse model of multiple sclerosis. Neurobiol Dis. 2006;21:626–632. doi: 10.1016/j.nbd.2005.09.009. [DOI] [PubMed] [Google Scholar]
- Kovacevic N, Henderson JT, Chan E, Lifshitz N, Bishop J, Evans AC, Henkelman RM, Chen XJ. A Three-dimensional MRI Atlas of the mouse brain with estimates of the average and variability. Cereb Cortex. 2005;15(5):639–645. doi: 10.1093/cercor/bhh165. [DOI] [PubMed] [Google Scholar]
- Larvaron P, Boespflug-Tanguy O, Renou J, Bonny J. In vivo analysis of the post-natal development of normal mouse brain by DTI. NMR Biomed. 2007;20:413–421. doi: 10.1002/nbm.1082. [DOI] [PubMed] [Google Scholar]
- Ma Y, Hof PR, Grant SC, Blackband SJ, Bennett R, Slatest L, McGuigan MD, Benveniste H. A three-dimensional digital atlas database of the adult C57BL/6J mouse brain by magnetic resonance microscopy. Neuroscience. 2005;135:1203–1215. doi: 10.1016/j.neuroscience.2005.07.014. [DOI] [PubMed] [Google Scholar]
- MacKenzie-Graham A, Lee E-F, Dinov ID, Bota M, Shattuck DW, Ruffins S, Yuan H, Konstantinidis F, Pitiot A, Ding Y, et al. A multimodal, multidimensional atlas of the C57BL/6J mouse brain. J Anat. 2004;204:93–102. doi: 10.1111/j.1469-7580.2004.00264.x. [DOI] [PMC free article] [PubMed] [Google Scholar]
- McKinstry RC, Mathur A, Miller JH, Ozcan A, Snyder AZ, Schefft GL, Almli CR, Shiran SI, Conturo TE, Neil JJ. Radial organization of developing preterm human cerebral cortex revealed by non-invasive water diffusion anisotropy MRI. Cereb Cortex. 2002;12:1237–1243. doi: 10.1093/cercor/12.12.1237. [DOI] [PubMed] [Google Scholar]
- Mori S, Itoh R, Zhang J, Kaufmann WE, Van Zijl PCM, Solaiyappan M, Yarowsky P. Diffusion tensor imaging of the developing mouse brain. Magn Reson Med. 2001;46:18–23. doi: 10.1002/mrm.1155. [DOI] [PubMed] [Google Scholar]
- Munasinghe JP, Gresham GA, Carpenter TA, Hall LD. Magnetic resonance imaging of the normal mouse brain: comparison with histologic sections. Lab Anim Sci. 1995;45:674–679. [PubMed] [Google Scholar]
- Nissanov J, Bertrand L. 3D anatomy of the rat brain: A 42-micron isotropic atlas, version 1.0. Imaging and Computer Vision Center, Drexel University; 1998. Technical Report 100198. [Google Scholar]
- Nolan PM, Peters J, Strivens M, Rogers D, Hagan J, Spurr N, Gray IC, Vizor L, Brooker D, Whitehill E, et al. A systematic, genome-wide, phenotype-driven mutagenesis programme for gene function studies in the mouse. Nat Genet. 2000;25:440–443. doi: 10.1038/78140. [DOI] [PubMed] [Google Scholar]
- O'Donnell L, Westin C-F. High-dimensional white matter atlas generation and group analysis. MICCAI'06. 2006:243–251. [PubMed] [Google Scholar]
- Paigen K, Eppig JT. A mouse phenome project. Mamm Genome. 2000;11:715–717. doi: 10.1007/s003350010152. [DOI] [PubMed] [Google Scholar]
- Pierpaoli C, Jezzard P, Basser PJ, Barnett A, Chiro GD. Diffusion tensor MR imaging of human brain. Radiology. 1996;201:637–648. doi: 10.1148/radiology.201.3.8939209. [DOI] [PubMed] [Google Scholar]
- Shen D, Davatzikos C. HAMMER: Hierarchical attribute matching mechanism for elastic registration. IEEE Trans Med Imaging. 2002;21:1421–1439. doi: 10.1109/TMI.2002.803111. [DOI] [PubMed] [Google Scholar]
- Song S-K, Sun S-W, Ju W-K, Lin S-J, Cross AH, Neufeld AH. Diffusion tensor imaging detects and differentiates axon and myelin degeneration in mouse optic nerve after retinal ischemia. Neuroimage. 2003;20:1714–1722. doi: 10.1016/j.neuroimage.2003.07.005. [DOI] [PubMed] [Google Scholar]
- Spring S, Lerch JP, Henkelman RM. Sexual dimorphism revealed in the structure of the mouse brain using three-dimensional magnetic resonance imaging. Neuroimage. 2007;35:1424–1433. doi: 10.1016/j.neuroimage.2007.02.023. [DOI] [PubMed] [Google Scholar]
- Sun SW, Neil JJ, Song SK. Relative indices of water diffusion anisotropy are equivalent in live and formalin-fixed mouse brains. Magn Reson Med. 2003;50:743–748. doi: 10.1002/mrm.10605. [DOI] [PubMed] [Google Scholar]
- Sun SW, Neil JJ, Liang HF, He YY, Schmidt RE, Hsu CY, Song SK. Formalin fixation alters water diffusion coefficient magnitude but not anisotropy in infarcted brain. Magn Reson Med. 2005;53:1447–1451. doi: 10.1002/mrm.20488. [DOI] [PubMed] [Google Scholar]
- Tyszka JM, Readhead C, Bearer EL, Pautler RG, Jacobsa RE. Statistical diffusion tensor histology reveals regional dysmyelination effects in the shiverer mouse mutant. Neuroimage. 2006;29:1058–1065. doi: 10.1016/j.neuroimage.2005.08.037. [DOI] [PMC free article] [PubMed] [Google Scholar]
- Valverde F. Apical dendritic spines of the visual cortex and light deprivation in the mouse. Exp Brain Res. 1967;3:337–352. doi: 10.1007/BF00237559. [DOI] [PubMed] [Google Scholar]
- Verma R, Mori S, Shen D, Yarowsky P, Davatzikos C. Spatio-temporal maturation patterns of murine brain quantified via diffusion tensor MRI and deformation-based morphometry. Proc Natl Acad Sci USA. 2005;102:6978–6983. doi: 10.1073/pnas.0407828102. [DOI] [PMC free article] [PubMed] [Google Scholar]
- Website. 2002 Mouse Atlas Project. In: LONI. [Google Scholar]
- Williams BS, Doyle MD. An internet atlas of mouse development. Comput Med Imaging Graph. 1996;20:433–447. doi: 10.1016/s0895-6111(96)00041-9. [DOI] [PubMed] [Google Scholar]
- Xu D, Mori S, Shen D, Zijl PCMv, Davatzikos C. Spatial normalization of diffusion tensor fields. Magn Reson Med. 2003;50:175–182. doi: 10.1002/mrm.10489. [DOI] [PubMed] [Google Scholar]
- Xue R, Sawada M, Goto S, Hurn PD, Traystman RJ, Zijl PCMv, Mori S. Rapid three-dimensional diffusion MRI facilitates the study of acute stroke in mice. Magn Reson Med. 2001;46:183–188. doi: 10.1002/mrm.1174. [DOI] [PubMed] [Google Scholar]
- Xue R, Zijl PCMv, Crain BJ, Solaiyappan M, Mori S. In vivo three-dimensional reconstruction of rat brain axonal projections by diffusion tensor imaging. Magn Reson Med. 1999;42:1123–1127. doi: 10.1002/(sici)1522-2594(199912)42:6<1123::aid-mrm17>3.0.co;2-h. [DOI] [PubMed] [Google Scholar]
- Zhang J, Richards LJ, Yarowsky P, Huang H, van Zijl PCM, Mori S. Three-dimensional anatomical characterization of the developing mouse brain by diffusion tensor microimaging. Neuroimage. 2003;20:1639–1648. doi: 10.1016/s1053-8119(03)00410-5. [DOI] [PubMed] [Google Scholar]
- Zhang J, van Zijl PCM, Mori S. Three-dimensional diffusion tensor magnetic resonance microimaging of adult mouse brain and hippocampus. Neuroimage. 2002;15:892–901. doi: 10.1006/nimg.2001.1012. [DOI] [PubMed] [Google Scholar]
- Zijdenbos AP, Forghani R, Evans AC. Automatic “pipeline” analysis of 3-D MRI data for clinical trials: application to multiple sclerosis. IEEE Trans Med Imaging. 2002;21:1280–1291. doi: 10.1109/TMI.2002.806283. [DOI] [PubMed] [Google Scholar]