Abstract
We demonstrate a new protein detection methodology based upon frequency domain electrical measurement using silicon nanowire field-effect transistor (SiNW FET) biosensors. The power spectral density of voltage from a current-biased SiNW FET shows 1/f-dependence in frequency domain for measurements of antibody functionalized SiNW devices in buffer solution or in the presence of protein not specific to the antibody receptor. In the presence of protein (antigen) recognized specifically by the antibody-functionalized SiNW FET, the frequency spectrum exhibits a Lorentzian shape with a characteristic frequency of several kHz. Frequency and conventional time domain measurements carried out with the same device as a function of antigen concentration show more than 10-fold increase in detection sensitivity in the frequency domain data. These concentration dependent results together with studies of antibody receptor density effect further address possible origins of the Lorentzian frequency spectrum. Our results show that frequency domain measurements can be used as a complementary approach to conventional time domain measurements for ultra-sensitive electrical detection of proteins and other biomolecules using nanoscale FETs.
Keywords: nanowire, FET, biosensor, frequency domain, Lorentzian
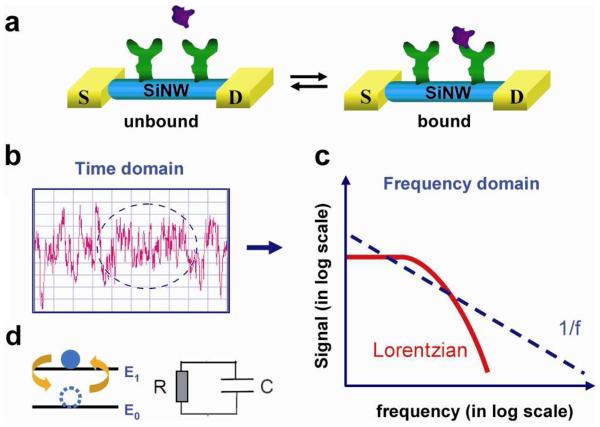
One dimensional nanostructures such as semiconducting nanowires (NWs)1 have become a focus of intensive research due to their demonstrated potential for realizing a range of well-defined nanoscale devices for electronics,2 photonics,3 and biosensors.4,5 In the latter area, previous work has shown that SiNW FET biosensors can be used to detect pH,4,5 gas molecules,6 proteins,7,8 DNA,9,10 and even single virus particles.11 The high surface-to-volume ratio and tunable carrier density in SiNW and other NW FETs make them sensitive probes of surface interactions, in particular, binding and unbinding of biomolecules as shown in Figure 1a. To date, NW FET biosensor studies have focused primarily on measuring the total signal, such as SiNW FET conductance, as a function of changes in the analyte concentration.4-10 Fluctuations in the NW FET signal at equilibrium have not, however, been studied. Fluctuations about equilibrium are generally interesting as they can convey information about the system dynamics without perturbation.12,13 In this regard, electrical signal fluctuations of SiNW FET biosensors could reflect the dynamics of the biomolecule-NW hybrid system through a coupling to carrier transport in the SiNW device. However, fluctuations in the measured electrical signal are composed of a number of potential noise sources, including intrinsic device noise due to mobility and/or carrier fluctuations,14 thermal fluctuations of the environment,15 and the interaction between biomolecules and the NW surface.5 The variety of potential noise sources could make it difficult to obtain clear insight from direct conductance versus time data (e.g., Figure 1b), although the noise spectra in frequency domain may allow one to directly analyze contributions from different noise sources as shown schematically in Figure 1c.
Figure 1.
(a) Schematic of protein binding and unbinding to an antibody-modified SiNW FET sensor. S and D correspond to the source and drain metal contacts to the NW. (b) A schematic of electrical noise in a time-domain measurement. (c) Schematic of Lorentzian and 1/f functions in the frequency domain. (d) Models of a two-level system (left) and an RC circuit (right).
Specifically, the frequency domain spectrum of a two-level fluctuator system has the form of Lorentzian function similar to that of an RC circuit. In this context, the population in each state or the current flowing through the RC circuit decays as exp(-t/τ), where τ represents the relaxation time of the system. In the frequency domain, this exponential decay is transformed to a Lorentzian function (Fig. 1c, red curve), S(f) α(Γ)/[(Γ)2 +(2πf)2], with a characteristic cut-off frequency,16 (Γ) = 1/τ. For systems with a large distribution of τ's, the Lorentzian functions add up to a 1/f function.17 1/f noise is well known in conventional metal-oxide-semiconductor FETs (MOSFETs), arising from capture and emission of electrons from trap states.14,17,18 1/f spectra have also been extensively observed and used to study transport in single-electron transistors,19 and carbon nanotubes (CNTs).20-22
To address the challenge of differentiating signals from a variety of noise sources through frequency domain analysis, we hypothesized that if the Lorentzian function associated with biomolecule binding on SiNW FET surfaces has a more significant contribution than other noise sources, it will lead to a Lorentzian peak adding to the 1/f spectrum. The observation of such a phenomenon was recently reported on a small-molecule functionalized CNT FET surface at single molecule level, however, no analysis of such spectra has been demostrated.23 Moreover, it is unclear if and how the molecular binding will affect the frequency domain spectrum for typical nanoscale FET sensors where a large number of receptors are linked on the device surface. In this paper, we have carried out extensive time domain and frequency domain measurements of antigen binding on SiNW FET surfaces that were covalently-modified with monoclonal antibodies. Our work demonstrates that the frequency domain noise spectra of SiNW FETs not only provides a means to complement real-time conductance data for protein sensing, but also contains information that is useful to further understand the NW-protein-solution interface.
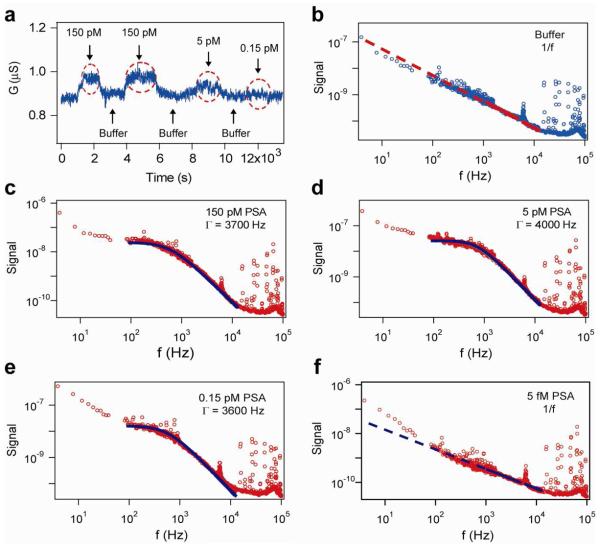
In a typical experiment, a p-type (boron-doped) SiNW FET biosensor was first modified with monoclonal antibodies specific to prostate specific antigen (PSA, Supporting Information),7,8 then solutions with different PSA concentrations and pure buffer were sequentially delivered to the NW sensor via a micro-fluidic channel. Distinct conductance changes of the SiNW FET were observed in real-time measurements (Fig. 2a), where the increases of conductance indicated the electrical gating effect when negatively-charged PSA molecules bind to the p-type SiNW FETs, while unbinding of PSA molecules from the SiNW FET surface led to a return to the conductance baseline.7,8 The concentration dependent conductance change further shows that it is difficult to distinguish the signal from noise level when the PSA concentration is at or below 0.15 pM (signal to noise ratio < 2, Fig. 2a), indicating a reliable PSA detection limit for this specific SiNW device is ca. 5 pM in conventional time-domain measurement.
Figure 2.
(a) Time domain conductance measurement of a p-type SiNW FET sensor modified with PSA monoclonal antibodies, when different concentrations of PSA solutions (as shown) and pure buffer were sequentially delivered to the sensor. Red dashed circles indicate the time windows of PSA binding on the NW surface. (b) Power spectrum of the same SiNW FET sensor in buffer shows a 1/f frequency dependence. The data are blue circles and the 1/f dependence is shown as the red dashed line. (c-e) Power spectra recorded in solutions with different PSA concentrations, 150, 5, 0.15 pM, show Lorentzian shape curves, with characteristic frequencies (Γ) of 3700, 4000, and 3600 Hz, respectively. (f) Power spectrum recorded in 5 fM PSA solution shows a 1/f frequency dependence. The y-axis unit for Figs. (b-f) is V2/Hz. Data in (c-f) are red circles and fits are black dashed lines.
The voltage noise spectra of the same SiNW FET were recorded using a spectrum analyzer during the periods when the real-time conductance reached equilibrium (Supporting Information). When the device was in pure buffer, a clear 1/f spectrum was observed in the frequency domain, (Fig. 2b, data shown as blue circles and 1/f dependence fit is shown as red dashed line), similar to silicon MOSFET or CNT FET devices reported previously.17,20-22 When solutions with different PSA concentrations (0.15 - 150 pM) were delivered and this SiNW FET sensor was in binding equilibrium periods (as indicated in the time windows in Fig. 2a), the power spectra showed curved shapes (Fig. 2c-e, data curves in red circles and Lorentzian fits in black dashed lines) are clearly different from that measured in buffer. These curves can be well-fit by a Lorentzian function, S(f) α (Γ).[(Γ)2 + (2πf)2], where Γ represents the characteristic frequency.14 Our measurements yield a characteristic frequency value ca. 3800 ± 200 Hz for different PSA concentrations ranging from 0.15 - 150 pM with no clear trend versus concentration. In addition, although this SiNW FET sensor did not yield a noticeable conductance change in the time domain for 0.15 pM PSA solution, the Lorentzian curve shape was still clearly observed in the power spectrum at this concentration (Fig. 2e), indicating the PSA binding was still detectable at this concentration in the frequency domain. Finally, when the PSA concentration was lowered to 5 fM, the Lorentzian curve shape disappeared and a 1/f curve was observed, similar to that measured in buffer. These results indicate that the detection limit for this SiNW device in the frequency domain was at least 0.15 pM, or ca. 30 times better than that the same device measured in the time domain (i.e., 5 pM). The improved detection sensitivity is attributed to the separation of the Lorentzian characteristic frequency from the most dominant background of 1/f noise, which becomes less important at high frequencies.
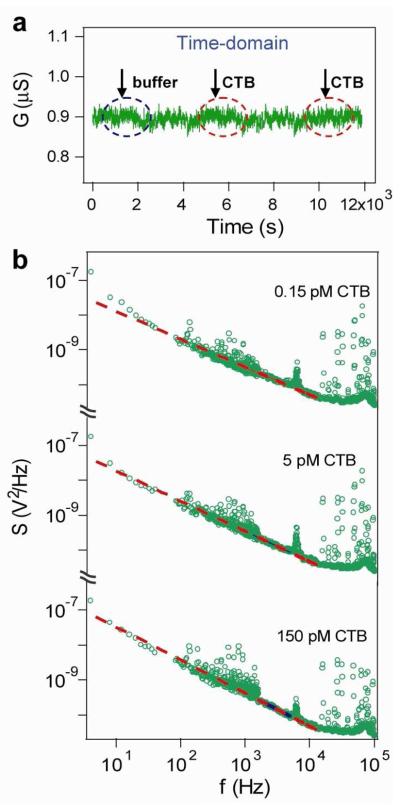
We have also carried out an additional control experiment to study the selectivity of the frequency domain detection by measuring the time and frequency domain response in the presence of another protein. Specifically, similar time domain and frequency domain data was recorded from a SiNW FET sensor modified with PSA antibody when cholera toxin sub-unit B (CTB)24 and pure buffer solutions were sequentially delivered to the sensor. Real-time measurement showed no observable conductance change for CTB solution concentrations from 0.15 to 150 pM (Fig. 3a), as CTB does not bind to the PSA antibody. The power spectra for this same SiNW FET sensor showed similar 1/f curves in the different concentrations CTB solutions (Fig. 3b), as that measured from the buffer. This control experiment demonstrates that the Lorentzian shaped power spectrum only appears when biomolecules bind to a SiNW FET sensor, and thus, that the frequency domain measurement provides a robust and complementary tool to the time domain measurement for sensitive biomolecule detection.
Figure 3.
(a) Real-time conductance measurement of a p-type SiNW FET sensor modified with monoclonal antibodies to PSA, while different concentrations of CTB solutions and pure buffer were sequentially delivered onto the sensor surface. Black and red dashed circles indicate the time windows when buffer or CTB solutions were delivered onto the NW surface. (b) The power spectra of the same SiNW FET sensor in solutions with different CTB concentrations, 0.15, 5, 150 pM, respectively, show curves of 1/f shape. The data are green circles and fits are red dashed lines.
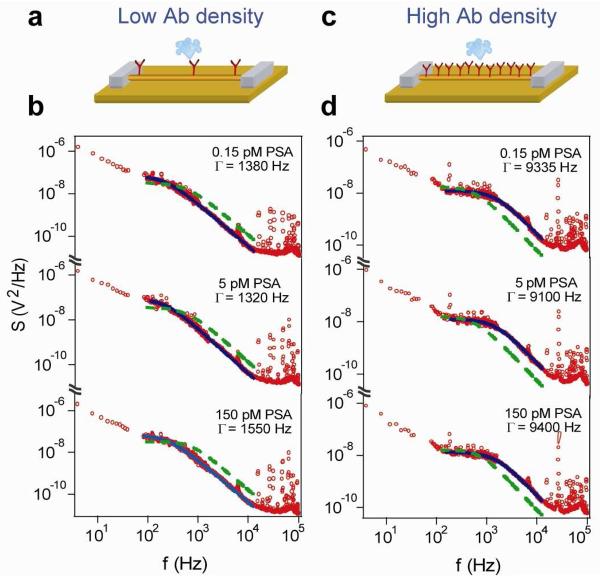
To further understand the spectra acquired during the biomolecule binding on SiNW FET sensor surface, we carried out frequency domain measurement using SiNW FET sensors modified with different densities of surface receptors; that is, the PSA antibodies. The densities of surface-linked antibodies were controlled by tuning the antibody modification time, from 20 min for a low surface receptor coverage to 5 hours for a high surface receptor coverage.11 Overall, the power spectra (Fig. 4) show similar shape Lorentzian functions for different antibody density, although the characteristic frequency (Γ) showed a systematic increase with increasing antibody density. For SiNW sensors modified with low antibody coverage, the measured Γ is 1450 ± 150 Hz (Fig. 4a, b); while for SiNW sensors modified with high antibody coverage, the measured Γ is 9250 ± 200 Hz (Fig. 4c, d), where these values can be compared to the measured Γ of ca. 3800 Hz from SiNW sensors with medium antibody coverage. In addition, for a same SiNW sensor, no significant shift of the Γ values was observed from PSA concentrations in the range tested here (0.15 – 150 pM).
Figure 4.
(a, c) Schematics illustrating SiNW FET sensors modified with antibodies at low and high density, respectively. (b, d) Power spectra recorded from devices modified with PSA antibodies at low and high density, respectively, for PSA concentrations from 0.15, 5 and 150 pM. The data are red circles, while black continuous lines correspond to Lorentzian fits. For comparison, a Lorentzian curve with a characteristic frequency of 3800 Hz is also added into each figure, shown in green dashed lines.
Two noise sources of particular interest in understanding the observed Lorentzian line shapes associated with specific protein binding are (1) the equivalent gate voltage noise from the binding/unbinding of individual antigen to antibody receptors, and (2) the additional thermal (Johnson) noise associated with the antibody and bound antigen layers (see Supporting Information for details). First, we consider that the noise of Lorentzian curve arises from the two-level system of individual antigen binding/unbinding to an antibody on the NW FET sensor surface.23 In this model, the characteristic frequency Γ of Lorentzian noise spectrum is related to the rates of antigen-antibody binding/unbinding.25 An estimate of Γ =ka X [PSA] + kd can be made using the known forward rate constant k ~ 10−2 /s,26 a backward rate constant k ~ 10−2 /s,26 and PSA concentrations used in our experiments, thus Γ is ~ 10−2 Hz. This is not consistent with our measured Γ of several kHz. We note that this small frequency estimate is lower than the range of our measurements and in a regime that is typically dominated by the 1/f background. In the future, it would be interesting to further test the potential quantitative applicability of this model by choosing other receptor/analyte pairs such that characteristic frequency was at substantially higher frequency. Second, we consider the extra gate voltage noise associated with thermal fluctuations of the PSA antibody and bound PSA layers on the SiNW sensors.27,28 In this model, Γ is determined by the RC time constant of the effective circuit that resembles the biomolecule-NW system, and we estimate Γ to be several kHz, (Supporting Information). Notably, since the antibody density strongly affects the capacitance of this layer, it will have a critical effect on the characteristic time Γ,27 as observed in our experiments.
In summary, we have demonstrated frequency domain electrical detection of selective protein binding to antibody-modified SiNW FET sensors. Sub-picomolar detection has been routinely achieved given that the characteristic frequencies associated with protein binding are well-separated from other noise sources, and over 10-fold increase in detection sensitivity has been achieved using the frequency domain than time domain measurements with the same device. While the ultimate detection floor by either time domain conductance measurement or frequency domain voltage noise measurement is jointly determined by several factors including the biomolecule equilibrium dissociation constant,29 the mass-transport rate towards to the NW surface,30 and the electrolyte double-layer screening effects,5,31 our results show that the frequency domain analysis provides a complementary and powerful method to the real-time detection and should be especially useful in cases where the extrinsic noise level is high or the system investigated is in an equilibrium state.
Supplementary Material
Acknowledgement
G.Z. acknowledges support of this work by Fudan University startup fund. X.G. acknowledges support of this work by CWRU startup fund. G.Z. and X.G. thank Professor Wei Lu for discussion. C.M.L. acknowledges support of this work by the NIH R21 award (5R21CA133519) and Director's Pioneer Award (5DP1OD003900).
Footnotes
Supporting Information Available. Methods. These materials are available free of charge via the Internet at http://pubs.acs.org.
References
- 1.Lieber CM, Wang ZL. MRS Bulletin. 2007;32:99–108. [Google Scholar]
- 2.Xiang J, Lu W, Hu Y, Wu Y, Yan H, Lieber CM. Nature. 2006;441:489–493. doi: 10.1038/nature04796. [DOI] [PubMed] [Google Scholar]
- 3.Pauzauskie PJ, Yang P. Materials Today. 2006;9:36–45. [Google Scholar]
- 4.Cui Y, Wei Q, Park H, Lieber CM. Science. 2001;293:1289–1292. doi: 10.1126/science.1062711. [DOI] [PubMed] [Google Scholar]
- 5.Gao PAX, Zheng G, Lieber CM. Nano Lett. 2010;10:547–552. doi: 10.1021/nl9034219. [DOI] [PMC free article] [PubMed] [Google Scholar]
- 6.McAlpine MC, Ahmad H, Wang D, Heath JR. Nat. Mater. 2008;6:379–384. doi: 10.1038/nmat1891. [DOI] [PMC free article] [PubMed] [Google Scholar]
- 7.Stern E, Klemic JF, Routenberg DA, Wyrembak PN, Turner-Evans DB, Hamilton AD, LaVan DA, Fahmy TM, Reed MA. Nature. 2007;445:519–522. doi: 10.1038/nature05498. [DOI] [PubMed] [Google Scholar]
- 8.Zheng G, Patolsky F, Cui Y, Wang WU, Lieber CM. Nat. Biotechnol. 2005;23:1294–1301. doi: 10.1038/nbt1138. [DOI] [PubMed] [Google Scholar]
- 9.Hahm J, Lieber CM. Nano Lett. 2004;4:51–54. [Google Scholar]
- 10.Soleymani L, Fang Z, Sargent EH, Kelley SO. Nat. Nanotechnol. 2009;4:844–848. doi: 10.1038/nnano.2009.276. [DOI] [PubMed] [Google Scholar]
- 11.Patolsky F, Zheng G, Hayden O, Lakadamyali M, Zhuang X, Lieber CM. Proc. Natl. Acad. Sci. USA. 2004;101:14017–14022. doi: 10.1073/pnas.0406159101. [DOI] [PMC free article] [PubMed] [Google Scholar]
- 12.Crooker SA, Rickel DG, Balatsky AV, Smith DL. Nature. 2004;431:49–52. doi: 10.1038/nature02804. [DOI] [PubMed] [Google Scholar]
- 13.Scofield JH. Rev. Sci. Instrum. 1987;58:985–993. [Google Scholar]
- 14.Weissman MB. Rev. Mod. Phys. 1988;60:537–571. [Google Scholar]
- 15.Laudau LD, Lifshitz EM. Statistical Physics. 3rd ed. Butterworth-Heinemann; Oxford: 1980. [Google Scholar]
- 16.Bohm A, Harshman NL, Walther H. Phys. Rev. A. 2002;66:012107. [Google Scholar]
- 17.Simoen E, Claeys C. Solid State Electron. 1999;43:865–882. [Google Scholar]
- 18.Dutta P, Horn PM. Rev. Mod. Phys. 1981;53:497–516. [Google Scholar]
- 19.Lu W, Ji Z, Pfeiffer L, West KW, Rimberg AJ. Nature. 2003;423:422–425. doi: 10.1038/nature01642. [DOI] [PubMed] [Google Scholar]
- 20.Xu G, Liu F, Han S, Ryu KM, Badmaev A, Lei B, Zhou CW. Appl. Phys. Lett. 2008;92:223114. [Google Scholar]
- 21.Lin YM, Appenzeller J, Knoch J, Chen ZH, Avouris P. Nano Lett. 2006;6:930–936. doi: 10.1021/nl052528d. [DOI] [PubMed] [Google Scholar]
- 22.Collins PG, Fuhrer MS, Zettl A. Appl. Phys. Lett. 2000;76:894–896. [Google Scholar]
- 23.Goldsmith BR, Coroneus JG, Kane AA, Weiss GA, Collins PG. Nano Lett. 2008;8:189–194. doi: 10.1021/nl0724079. [DOI] [PubMed] [Google Scholar]
- 24.de Haan L, Hirst TR. Mol. Membr. Biol. 2004;21:77–92. doi: 10.1080/09687680410001663267. [DOI] [PubMed] [Google Scholar]
- 25.Feher G, Weissman M. Proc. Natl. Acad. Sci. USA. 1973;70:870–875. doi: 10.1073/pnas.70.3.870. [DOI] [PMC free article] [PubMed] [Google Scholar]
- 26.Myszka DG. Curr. Opin. Biotech. 1997;8:50–57. doi: 10.1016/s0958-1669(97)80157-7. [DOI] [PubMed] [Google Scholar]
- 27.Hassibi A, Navid R, Dutton RW, Lee TH. J. Appl. Phys. 2004;96:1074–1082. 2005, 98, 069903. [Google Scholar]
- 28.Voelker M, Fromherz P. Phys. Rev. Lett. 2006;96:228102. doi: 10.1103/PhysRevLett.96.228102. [DOI] [PubMed] [Google Scholar]
- 29.Ip SHC, Johnson ML, Ackers GK. Biochemistry. 1976;15:654–660. doi: 10.1021/bi00648a032. [DOI] [PubMed] [Google Scholar]
- 30.Sheehan PE, Whitman LJ. Nano Lett. 2005;5:803–807. doi: 10.1021/nl050298x. [DOI] [PubMed] [Google Scholar]
- 31.Nair PR, Alam MA. Nano Lett. 2008;8:1281–1285. doi: 10.1021/nl072593i. [DOI] [PubMed] [Google Scholar]
Associated Data
This section collects any data citations, data availability statements, or supplementary materials included in this article.


