Abstract
Microwave Tomography (MWT) is a novel imaging modality which might be applicable for non-invasive assessment of functional and pathological conditions of biological tissues. The imaging of the soft tissue of extremities is one of its potential applications. The feasibility of this technology for such applications was demonstrated earlier.
This is the first of two companion papers focused on an application of MWT for imaging of the extremity’s soft tissues. The goal of this study is to assess the technical performance of the developed 2D MWT system dedicated for imaging of functional and pathological conditions of the extremity’s soft tissues. Specifically, the system’s performance was tested by its ability to detect signals associated with physiological activity and soft tissue interventions (circulatory related changes, blood flow reduction and a simulated compartmental syndrome) – so called “physiological signatures”.
The developed 2D MWT system dedicated for an imaging of animal extremities demonstrates good technical performance allowing for stable and predictable data acquisition with reasonable agreement between experimentally measured electromagnetic (EM) field and simulated EM field within a measurement domain. Using the system we were able to obtain physiological signatures associated with systolic vs diastolic phases of circulation in an animal extremity, reperfusion vs occlusion phases of the blood supply to the animal’s extremity and the a compartment syndrome. The imaging results are presented and discussed in the second companion paper.
1. Introduction
The accurate assessment of the soft tissue component of the injured extremity remains a major deficiency in management of fractures. It is important to understand the soft tissue injury, as this component is often the determinant of the final outcome of treatment. The soft tissues provide the blood supply for the bone to heal, provide the coverage for the bone and the muscles, nerves and vessels provide for a functional outcome following injury. To date several methods; such as laser Doppler and transcutaneous oxygen tensions have been attempted to assess soft tissue viability but they have been no better than the assessment by physical examination of the injured extremity. None of these methods have correlated with the functional outcome of the injured extremity. Consequently there is an important need to develop a simple effective method of assessing soft tissue viability.
Microwave tomography (MWT) has been shown to outline and identify myocardial infarction (Semenov et al 2003). The applicability of this technique to extremity muscle injury is extremely appealing. This technique if successful would provide the surgeon with a measure of the soft tissue viability (especially muscle) associated with an extremity injury. This would allow the surgeon to time the surgical intervention appropriately, to avoid major disastrous soft tissue complications and to be able to prognosticate the long-term functional outcome for patients. Microwave tomography combined with plain radiology in the acute emergency situation would provide the treating surgeon with the complete assessment of both components of any given extremity injury. This would drastically enhance the ability of surgeons to provide quality and effective care for extremity injuries.
MW tomography and sensing is a novel diagnostic modality which might be applicable for non-invasive assessment of functional and pathological conditions of biological tissues Fear et al (2000), Fhager et al (2010), Hagness et al (1998), Hawley et al (1991), Meaney et al (2007), Mojabi et al (2009), Poplack et al (2007) and Semenov (2009). Extremities’ soft tissue imaging is one of its potential applications. Previously we have demonstrated the feasibility of the technology for non-invasive assessment of extremities’ soft tissue blood content and compartmental injury Semenov et al (2007). The dependence of tissue dielectric properties (which are actually imaged within MWT) from its various functional and pathological conditions, such as blood and oxygen contents, ischemia and infarction Semenov et al (2000a, 2002a), malignancies Chaundhary et al (1984), Lazebnik et al (2007a, 2007b), Joines et al (1994), Smith et al (1986), Surowiec et al (1986) and edema Kao et al (1999) has been demonstrated.
We have previously developed two-dimensional (2D) and three-dimensional (3D) microwave tomographic systems (Semenov et al 1996, Semenov et al 2002b) and the methods of image reconstruction (Bulyshev et al 2000, Semenov et al 1999, Souvorov et al 1998). Feasibility of the technology for cardiac imaging was demonstrated (Semenov et al 2000b, Semenov et al 2003) and the conclusion made that microwave tomography is capable of both structural and functional cardiac imaging. As in any biomedical imaging, the classical MWT imaging scenario consists of consequential cycles of measurements of scattered by the object signals, obtained from a plurality of transmitters located at various points around the object. Some portions of the extremity might be approximated as two-dimensional (2D) structures with obvious limitations. As an initial MWT imaging approach for extremity imaging we used 2D technical and image reconstruction schemes. Our goal is to image functional conditions of soft tissues with respect to physiological variations, for example, blood content and circulation within a tissue. Circulatory related changes dictate strong requirements for a system to have time resolution of about 10–30msec. In addition to this requirement, there is a need for the measurement of highly attenuated within a body electromagnetic (EM) signals which dictates very tight requirements for the system performance.
Safety is an important feature of MWT imaging. Within this modality a non-ionizing electromagnetic field is used in contrast to the ionizing radiation used in CT-imaging and nuclear medicine or invasive techniques required for tissue pressure monitoring. We estimate that the level of EM field used in imaging procedures will be comparable with the level of EM field used in cell phones at the same GHz portion of electromagnetic spectrum.
This is the first of two companion papers focused on an application of microwave tomography for extremities soft tissue imaging using a dedicated 2D MWT system. The goal of this study is to assess the technical and imaging performance of the developed 2D MWT system dedicated for the imaging of functional and pathological conditions of extremity’s soft tissues. Specifically the system performance was tested in its ability for detecting signals associated with physiological activity and/or interventions in soft tissues. We define such associated signals as “physiological signatures”. The paper is organized as follows. The 2D MWT system is described in Section 2. Further in Section 2 the methodology of computer simulations and the methodology of animal experiments are described. The technical performance of the dedicated 2D MWT system is described in Section 3. In Section 3 experimental test results are presented and compared with the results of simulations. Further in Section 3 “physiological signatures” are presented and discussed. The imaging results are presented and discussed in the second companion paper.
2. Materials and Methods
The dedicated 2D MWT system is described in Subsection 2.1. Subsection 2.2 presents the computer simulation approaches used for simulation of EM field distribution within the imaging chamber. Subsection 2.3 describes the methodology of the animal studies using acute models of a short term blood flow reduction and compartment syndrome of the animal’s upper front extremity. Please note that index ε below denotes relative permittivity of matter.
2.1 2D MWT system
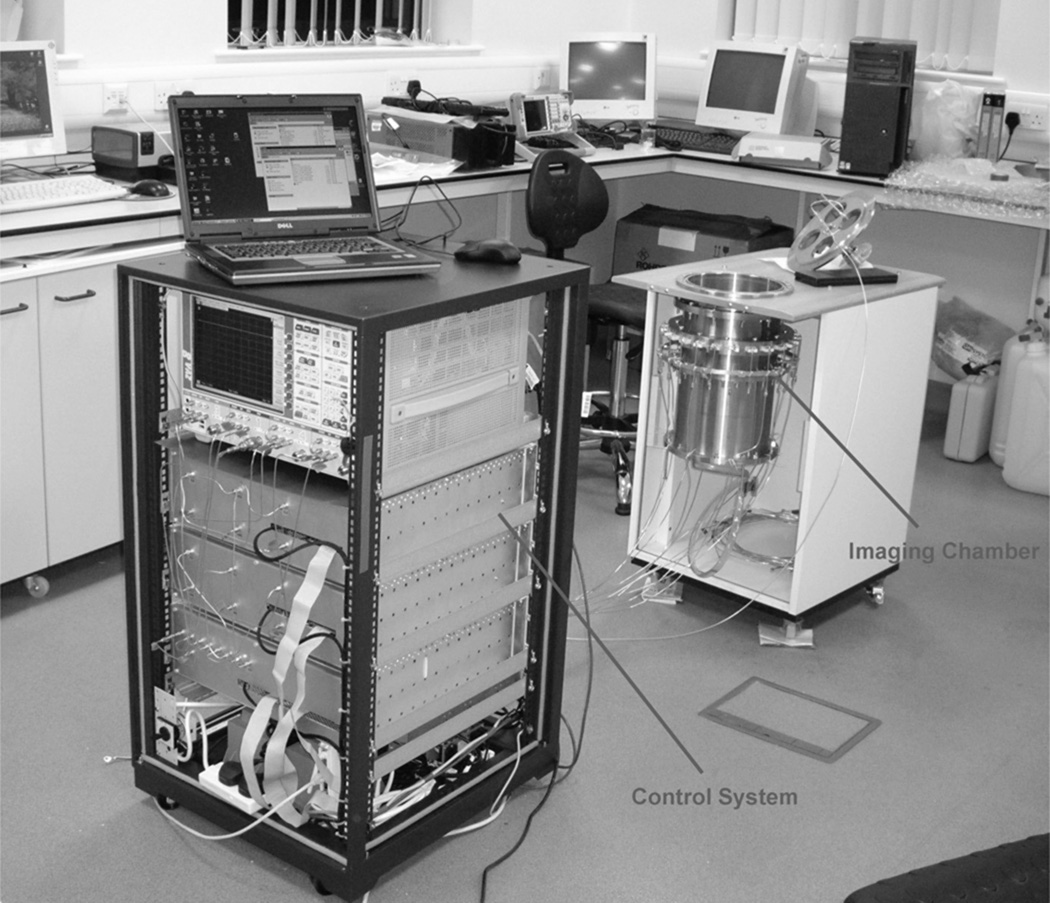
The 2D MWT system for extremity imaging consists of two major blocks: an electronic / microwave unit (or control unit) and a 2D imaging chamber (Figure 1). The antennas within the imaging chamber and control unit are connected via 24 coaxial cables. The imaging chamber is a metallic cylinder with a radius of 10.75cm with 24 antennas equidistantly located at the perimeter of its horizontal cross-section. The vertical position of antenna’s cross-section is 12cm from the top of the chamber and 27cm from the bottom of the imaging chamber. Each antenna is a ceramic filled waveguide (ε~60 and dimensions 5.3*2.1*0.75cm) operating in both transmitting and receiving modes. During an imaging procedure the chamber is filled with matching solutions of various dielectric properties. We used mixtures of intralipid (fatty) emulsion with salt of different concentration as well as an alcohol mixture with salt. The goal was i) to get the best impedance matching possible between skin (including superficial tissues), matching solution and the antennas and ii) to decrease as much as possible unwanted reflections of EM field from the boundaries of an imaging domain. The control unit transmits EM radiation to any antenna (working as a transmitter at certain time point) and measures scattered EM fields on all the rest of 23 antennas, working as receivers at this particular time. Then the next neighbor antenna was switched to work as a transmitter with consequential adjustment of the other 23 receiving antennas. The full tomographic data acquisition cycle consists of 24 successive, sequential irradiations from each of 24 antennas. This leads to a matrix of 24*23 complex measured data. Full system electronic scanning and control allows us to achieve very short time resolution (total acquisition time) of 12 msec. The system is capable to acquire about 20,000 full consequential measurements (frames) that give us an option for reconstructing, for example a “240sec movie” of 20,000 frames with 12msec frame rates. Implied system / antenna architecture allows for conducting of the measurements within frequency range of about 1.0 to 2.3GHz.
Figure 1.
General view of 2D MWT system for extremities soft tissues imaging in its test phase setting.
2.2 Computer simulation methodology
In order to simulate the distribution of EM field within an imaging chamber with a plurality of ceramic waveguide antennas located within a horizontal cross-section of the chamber we used FDTD method (SEMCAD X). The imaging chamber was simulated as a metallic cylinder 21cm in diameter and a height of 20cm. Twenty four equidistantly spaced ceramic waveguide antennas (with dimensions specified in Subsection 2.1) were position at the mid-horizontal cross-section of the chamber. The simulation runs from an excitation of one of 24 waveguide antennas for 20nsec for frequency of 1GHz. The imaging chamber was completely filled with a salty solution of ε=77+j28.
2.3 Animal experiments methodology
Animal experiments were conducted at the Cannon Research Center of the Carolinas Medical Center. Animals in this study were cared for under an Institutional Animal Care and Use Committee approved research protocol and the NIH guidelines for laboratory research. Three month old female Yorkshire domestic cross/farm pigs (ten animals) were used in these studies. Animals were acclimated in a fully accredited by AAALAC vivarium prior to the experimental procedure.
The animals were premedicated with Telazol (4.4mg/kg IM), Xylazine (2.2mg/kg IM) and Atropine (0.05mg/kg IM) 10–15 minutes prior to anesthetic induction. An IV line was placed in a marginal ear vein. Following intubation, anesthesia was maintained with 1.5–3% Isoflurane and the animal placed on a ventilator. ECG and/or arterial flow were utilized to help monitor the animal. Signals from either an ECG or flow monitor were recorded synchronously with the experimental data acquisition procedure. Proper ventilation was ensured by volume controlled positive pressure ventilation, using the O2 saturation and end-tidal CO2 concentration as proper ventilation indices.
The animal was placed on the surgical table in the supine position. The area of the left medial foreleg and left lateral chest was prepped and shaved. An incision approximately 6cm long was made in the left medial foreleg adjacent to the superior end of the brachial artery. The underlying tissue was dissected to expose the area between the biceps and the medial aspect of the triceps brachii muscle groups where the brachial artery was identified, dissected out of the muscle groups and isolated. A pneumatic occluder (In Vivo Metric Systems, Healdsburg, CA, USA) was secured around the brachial artery as superior as possible in an effort to involve as much of the leg as possible and to avoid an interference with microwave tissue interrogation during an imaging procedure. A vascular flow probe (Transonic System, Inc., Ithaca, NY, USA) was placed around the artery distal to the occluder to monitor the degree of changes of blood flow. The animal was then transferred from the surgical table to an experimental table containing the imaging chamber. The animal was positioned in such a way as to have one or both front legs suspended in imaging chamber (see Figure 2).
Figure 2.
Animal experiments setting: (A) general view and (B) view to an imaging chamber. 1 – imaging chamber; 2 – back view of the 2D MWT system.
We conducted a careful adjustment of an animal making sure that an animal is on proper ventilation, reliable readings of blood flow is constantly obtained, the position of animals’ extremity (ies) is within a central area of an imaging chamber and a vertical position of an antennas cross-section is within a central portion of the fore leg. The imaging chamber was then filled with a matching solution at room temperature up to a maximal vertical height avoiding overflow.
The series of short arterial flow occlusions were conducted. In each series baseline tomographic data was recorded during 15min every 5min when the flow is not compromised. The physiological readings, such as blood flow, heart rate (HR), O2 saturation were recorded. In the occlusion phase, immediately after the flow reached zero, the tomographic measurements were conducted for 13sec. Then the occluder was released un-compromising blood flow. We then conducted tomographic measurements for 13sec of the initial phase of reperfusion period. Overall occlusion time was within 30–50sec period.
An acute compartment syndrome was created in the brachioradialis muscle group of the left foreleg according to the technique of Hargens et al (1981). A 20-gauge needle was inserted into the compartment and the pressure was gradually increased by a syringe injection of lactated Ringers’ solution. The baseline tomographic data was collected as well as physiological readings, such as blood flow, HR and O2 saturation. Four successive injections of 20mL of lactated ringer solution were performed separated by 5min periods. Therefore, the overall volume of injected solution was 80mL at the 16th min of experiment. The tomographic (13sec time collection) and physiological data were collected at 1min and 5min post each injection.
3. Results and Discussion: system performance and physiological signatures
System technical performance is presented subsection 3.1. Also in here, results of computer simulations of EM field distribution within the imaging chamber are compared with experimentally measured fields. Subsection 3.2 covers the results of the animal experimental study in obtaining physiological signatures for interventions simulating a short term flow reduction and compartment syndrome.
3.1 System performance and EM field distribution within an imaging chamber
Standing Wave Ratio (SWR) of manufactured ceramic waveguides was tested in salty mixture (ε ≈ 78 +j24 at 1GHz). The results are summarized in Table 1 for three frequencies used in experimental studies. Good SWR was achieved at two upper frequencies, while at lower frequency SWR raises to 2.7, demonstrating a slight mis-match. The standard deviation values (Std) of SWRs for a group of 26 tested antennas is about 10%. This is despite that a tolerance of dielectric constant of ceramic core was about ±5% and careful procedures during antennas integration. Additional uncertainties related to the position of each individual antenna within an imaging chamber during the system integration clearly indicate the need for system calibration. Overall, the system allows for conducting tomographic experiments within a frequency range of 1.0–2.3GHz with programmable probing frequency setting.
Table 1.
Statistics of SWR for 26 manufactured ceramic waveguide antennas.
| Frequency [GHz] | Mean | Std |
|---|---|---|
| 1.0 | 2.7 | 0.3 |
| 1.25 | 1.6 | 0.2 |
| 1.5 | 1.3 | 0.1 |
In Table 2 we summarized the experimentally measured attenuation and the receivers’ signal range within an imaging chamber. In the Table 2 the “Overall receivers’ signal range” represents the maximal difference in amplitude of the received signals for the case when all 23 receivers are in operation, while “Receivers’ signal range on opposite π” corresponds to the case when only 13 receivers on opposite semicircle are used. As can be seen, both parameters are within the range of technical performance of recent state of the art MW measurement technology. From the signal range point of view, there is no need for restriction of using a limited number of opposite receivers – all 23 receivers may be used. However, as seen below the complexity of EM field distribution within a metallic imaging chamber prevents for the moment the use of all 23 receivers. Only complex signals from receivers on opposite π are taken into consideration for images reconstruction.
Table 2.
Experimentally measured attenuation and receivers’ signal range within an imaging chamber. See text for details.
| Freq [GHz] | ε | Max attenuation on opposite Tx/Rx [dB] |
Overall receivers’ signal range [dB] |
Receivers’ signal range on opposite π [dB] |
|---|---|---|---|---|
| 1.05 | 55 + j24 | 92 | 60 | 14 |
| 1.25 | 54 + j23 | 106 | 74 | 18 |
| 1.50 | 53 + j22.5 | 112 | 76 | 12 |
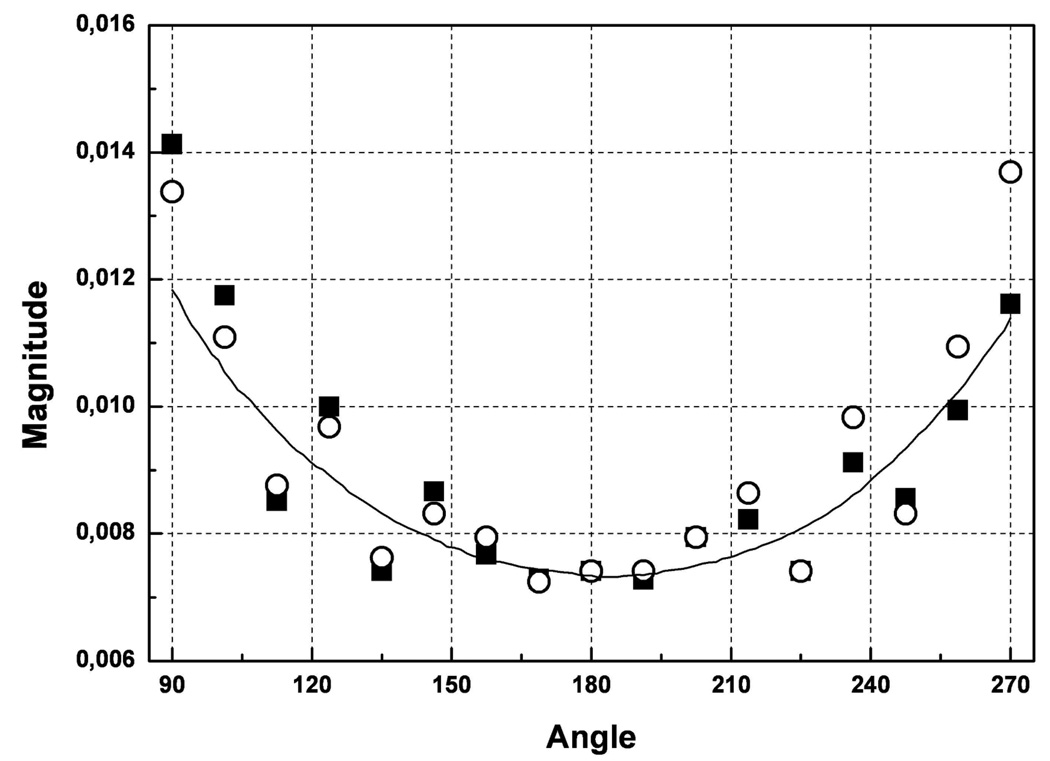
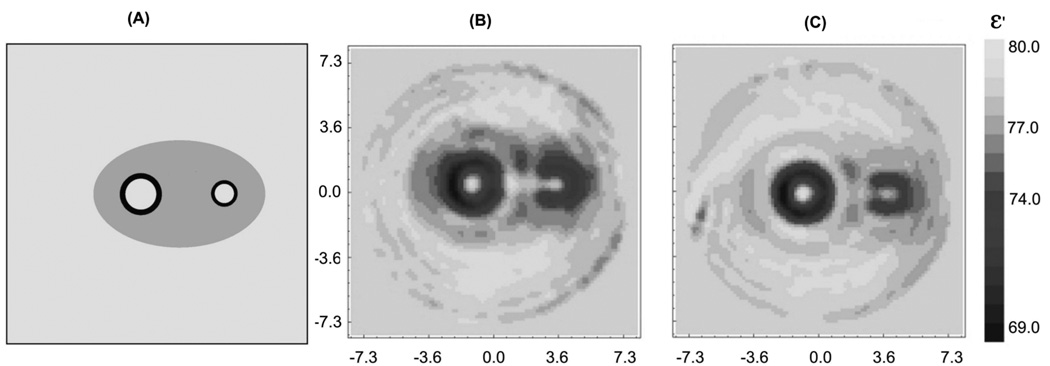
How EM field distribution within experimental domain of dozens of [cm] with absorptive media is affected by cylindrical metallic casing at frequencies of our interest? To assess this problem we conducted experiments using our 3D MWT system with large imaging chamber presented elsewhere (Semenov et al 1999). We measured and compared EM field distribution within a tomographic imaging chamber for two cases. In the first case we’ve placed a metallic cylinder (cupper, wall thickness 0.15mm, height 30cm and diameter 20cm) within a central part of an imaging chamber (case 1). The cylinder had a plurality of rectangular windows equidistantly located in its central horizontal cross-section simulating a 2D metallic imaging chamber. Then with the help of robotic system we’ve placed transmitting antenna at one window outside of the cylinder and then positioned receiver antenna sequentially at all opposing windows. The dimensions of rectangular windows within a metallic cylinder and waveguide antennas were similar. In the second case (case 2) we removed the metallic cylinder and repeated all measurements at exactly the same 3D geometrical positions and with the same medium in the chamber with dielectric properties of ε = 79+j9 at 2.05GHz. As can be seen from Figure 3, experimental points for case 1 indeed follow an overall trend of the field measured without metallic cylinder (case 2) with expected oscillations. The next question was, to what extent do these differences in the measured EM field allow for using an un-modified direct solver of our inversion algorithm (presented elsewhere Souvorov et al 1998). We conducted similar experiments as in case 1 and 2 above but with a cylindrical phantom, comprising a low contrast medium with two high contrast tubes. There was a slight difference between case 1 and case 1A as all receivers’ “windows” were connected forming a larger angular window to ease a tomographic measurement procedure. The results presented in Figure 4 clearly indicate an applicability and robustness of our imaging approach in spite of the presence of cylindrical metallic casing.
Figure 3.
A comparison of measured EM field distribution within a tomographic imaging chamber for two cases: symbols – when a measurement domain is within a metallic cylinder with “antenna windows” simulating a small metallic imaging chamber (case 1), line - the field without boundary restrictions within a measurement domain (case 2). Two symbol styles represent two independent measurements. See text for details. Frequency 2.05GHz. ε = 79+j9.
Figure 4.
Reconstructed images of the cylindrical phantom obtained for two different cases of the boundary of an imaging domain: (B) - without a metallic casing (case 2), (C) – with a metallic cylinder (case 1A). The original phantom configuration is presented in (A). See text for details. Frequency 2.05GHz. ε = 79+j9.
As we intended to use our system for multi-frame data acquisition, the temporal stability of measurements is another important factor to be considered. After careful system adjustment and tuning, the system demonstrates good stability during multi-frame measurements: at least 0.2–0.7% in amplitude and at least 0.2–0.7 degree in phase at IFBW 1kHz within the time frame of chosen tomographic data acquisition protocol when the imaging chamber is filled (13msec total acquisition time per frame, 50msec time interval between each frame and 133 frames acquired).
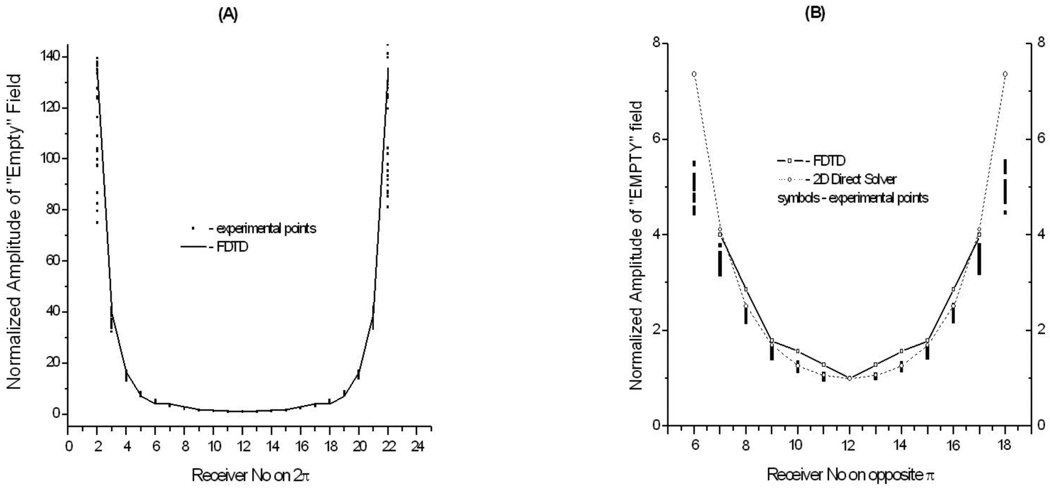
It is important for image reconstruction to have a predictable distribution of EM field for so called “Empty” imaging chamber, when the chamber is filled with a matching solution of known dielectric properties but there is no object inside. This is illustrated in Figure 5, where a distribution of the amplitude for a simulated “Empty” field is compared with experimentally measured fields. As can be seen from the Figure (right hand panel), there is a good fit in between the experimentally measured EM field and simulated data for receivers on opposite π. Simulated data from both our own fast 2D Direct solver (presented elsewhere Souvorov et al (1998)) and FDTD solver are in a reasonable agreement. As the source in 2D Direct solver we used an unlimited string here, positioned at center of the irradiating surface of the waveguide. However, the 2D Direct solver fails to produce a reasonable fit with the experimental data when all 23 receivers (located on 2π) are considered. The FDTD solver is in reasonable agreement for measured field. Our imaging algorithms require the solution of mathematical direct problem significant number of times: for each of antennae, at each of iterations. The number of antennas is 24 in presented experimental system, but might rise to a hundred or more in clinically applicable systems. Therefore we consider that the use of a relatively slow FTDT solver is impractical at the moment for image reconstruction. Recent hardware accelerators dedicated for FDTD solvers and parallel computing might be a solution, but a rather expensive one. Therefore, the absence of a fast and reliable direct solver prohibits at this moment the use of all 24 (Tx)*23 (Rx) matrix of scattered EM field in image reconstruction. Instead, we used a 24(Tx)*13(Rx) matrix. The need for a fast and reliable direct solver applicable for use in MWT setting with casing cannot be overestimated.
Figure 5.
Experimentally measured and simulated EM field distribution within horizontal, through antennas cross-section of an imaging chamber filled with solution of ε =77+j28. A – for all 23 receivers located on 2π, B – for 13 receivers located on opposite π. Dots - experimental points, straight line – simulation results using FDTD solver, dashed line – simulated results using 2D direct solver (right hand panel only). Frequency 1GHz.
As the final step of testing the technical performance of the system, we’ve conducted an experimental tomographic imaging protocol using low contrast 2D physical phantom, similar to Semenov et al (2000c). The image of the 2D phantom of the same quality as in Semenov et al (2000c) has been reconstructed. Concluding part 3.1, the system demonstrates good technical performance and allows for stable and predictable data acquisition with a reasonable agreement between experimentally measured EM field and a simulated EM field. Obtained images of physical phantoms further support this conclusion.
3.2 Physiological signatures
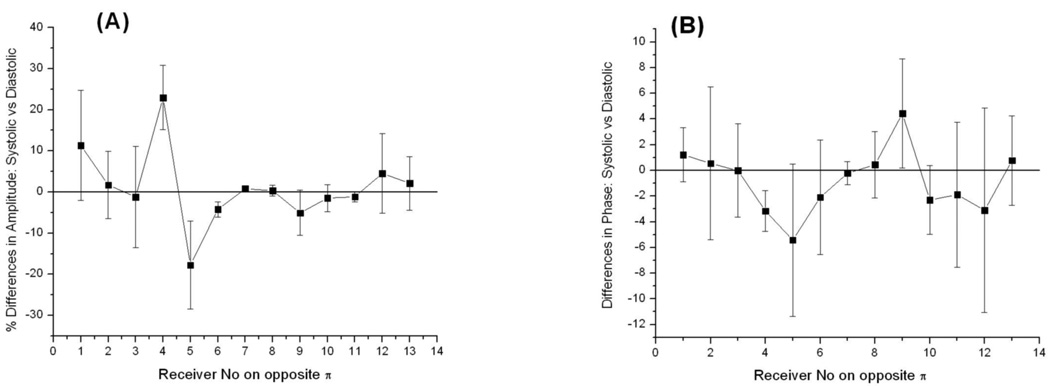
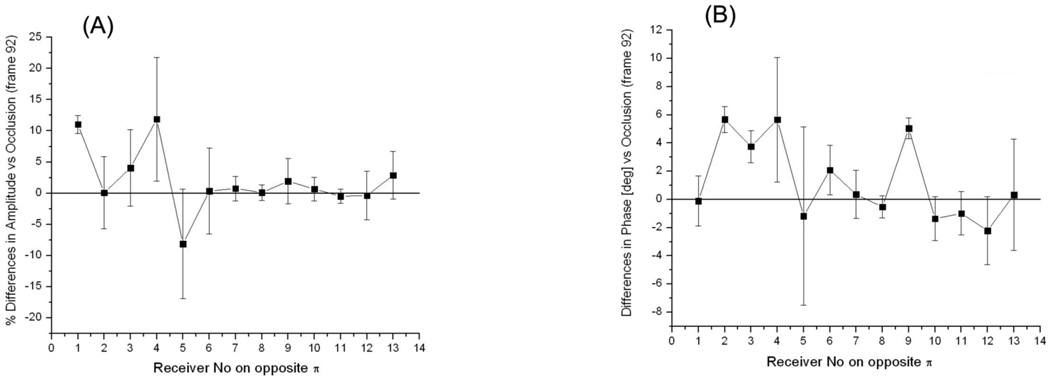
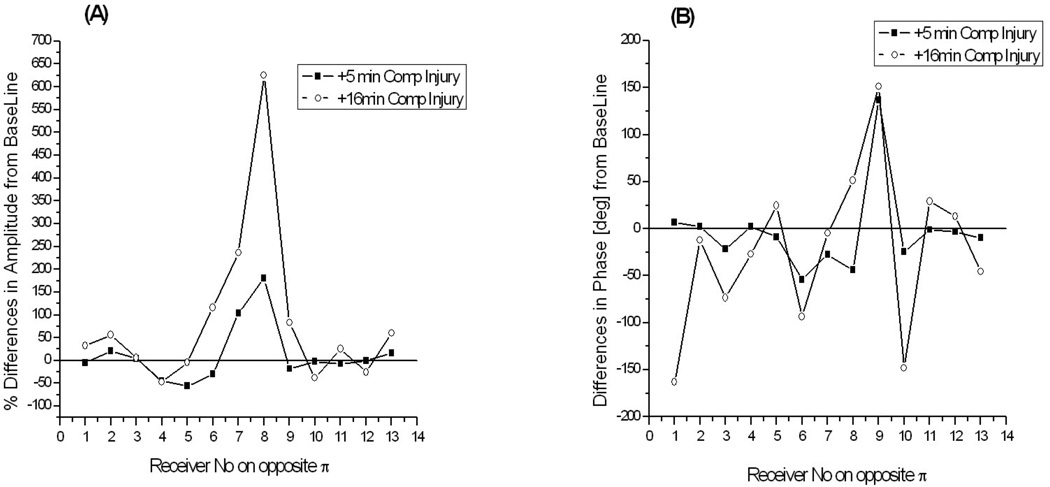
The focus of this portion of the study was on the ability of the system for detecting signals associated with physiological interventions of soft tissues – so called physiological signatures. This is a critical issue prior to conducting an imaging phase, because if there are no changes in the experimentally measured EM fields associated with physiological changes / interventions, it would be impossible to image them no matter how perfect the image reconstruction algorithm is. We have focused on obtaining physiological signatures for measured EM fields associated with i) systolic vs diastolic phases of circulation, ii) short term occlusion vs reperfusion of the swine extremity and iii) a simulated compartment syndrome in the swine extremity. Results are presented in the following series of graphs as % differences in amplitude of scattered EM fields (left hand panels) and as absolute differences in phase [deg] (right hand panels).
As can be seen from Figures 6 and 7, there are differences in both amplitude and phases of the signals. The differences are more pronounced at receivers 3–5 for particular configuration of transmitter and receivers represented in the Figure. The value of differences is up to 10–20% in amplitude and 4–6 degrees in phase. The figures also highlight a complexity of scattered EM field when physiological signatures are detectable within a small part of a measurement domain: in the presented case it is about 2 receivers out of 13 overall. Therefore, it is clear that in order for a more precise “discretization” of informative portions of scattered EM fields within a measurement domain more receivers per measurement domain would be preferable. This is supported by our previous imaging results where the effect of the number of receivers on the quality of reconstructed images was studied Semenov et al (1998). It has been shown that when the number of receivers is less than a critical number, the image reconstruction fails. An “optimal” number of receivers are a very case sensitive value, dependent on the geometry and dimensions of the imaging domain, contrast and dimensions of biological (dielectric) in-homogeneities to be imaged, dielectric matching etc. The imaging chamber of our system does have the largest possible number of antennas (24) in its 2D cross-section. This is restricted by physical dimensions of the waveguide antennas (5.3*2.1*0.75 [cm]). Smaller dimensions of antennas would allow increasing the number of antennas for better satisfaction of a “discretization” requirement, however this consequentially increases the number of Tx/Rx electronic channels of the system and an overall cost of electronics.
Figure 6.
Differences in measured EM field associated systolic vs diastolic phases of circulation: (A) - % differences in amplitude and (B) – absolute differences in phase for one of animal. Frequency 1.5GHz. Summarized differences between three systolic vs three diastolic frames are shown for 13 opposite receivers and one transmitting antenna.
Figure 7.
Differences in measured EM field associated reperfusion vs occlusion phases of blood supply to animal extremity: (A) - % differences in amplitude and (B) – absolute differences in phase for one of animal. Frequency 1.5GHz. Summarized differences for three reperfusion frames are shown for 13 opposite receivers and one transmitting antenna.
The differences associated with the development of compartmental syndrome in the animal extremity are much more significant, as can be seen in the Figure 8. They have risen up to 6 times in amplitude and up to 150degrees in phase at +16min of injury progression. This suggests a very confident image reconstruction revealing the location and degree of an injury within the extremities’ soft tissues.
Figure 8.
Differences in measured EM field associated with the development of compartmental injury in animal extremity: (A) - % differences in amplitude and (B) – absolute differences in phase. Frequency 1.05GHz. The differences at +5min and +16min of injury development are shown for 13 opposite receivers and one of transmitting antenna.
Obtained physiological signatures allow for successive MWT imaging of associated physiological interventions. This is demonstrated in the companion, imaging paper.
4. Conclusions
The newly developed 2D MWT system dedicated for animal extremities imaging demonstrates good technical performance allowing for a stable and predictable data acquisition with a reasonable agreement between an experimentally measured EM field and a simulated EM field within a measurement domain. Obtained images of physical phantoms further support this conclusion. Using this system we were able to obtain physiological signatures associated with systolic vs diastolic phases, reperfusion vs occlusion phases and simulated compartment syndrome in an animal extremity. This study suggests grounds for further successive imaging of these types of physiological activities and interventions.
Acknowledgements
The project described was supported by Grant Number R01EB007211 from the National Institute of Biomedical Imaging and Bioengineering, the National Institutes of Health, USA. The content is solely the responsibility of the authors and does not necessarily represent the official views of the National Institute of Biomedical Imaging and Bioengineering or the National Institutes of Health.
References
- Bulyshev AE, Semenov SY, Souvorov AE, Svenson RH, Nazarov AG, Sizov YE, Tatsis GP. Three dimensional microwave tomography. Theory and computer experiments in scalar approximation Inverse Problems. 2000;16:863–875. [Google Scholar]
- Chaundhary SS, Mishra RK, Swarup A, Thomas JM. Dielectrical properties of normal and malignant human breast tissues at radiowave and microwave frequencies Indian. J. Biochem. Biophys. 1984;21:76–80. [PubMed] [Google Scholar]
- Fear EC, Stuchly MA. Microwave detection of breast cancer. IEEE Trans MTT. 2000;48:1854–1863. [Google Scholar]
- Fhager A, McKelvey T, Persson M. Stroke Detection Using a Broad Band Microwave Antenna System. EUCAP2010; 4th European Conference on Antennas and Propagation; April 12–16; Barcelona, Spain. 2010. pp. C13P1–C13P2. [Google Scholar]
- Hagness SC, Taflove A, Bridges JE. Two-dimensional FDTD analysis of a pulsed microwave confocal system for breast cancer detection: fixed-focus and antenna-array sensors. IEEE Tran BME. 1998;45:1470–1479. doi: 10.1109/10.730440. [DOI] [PubMed] [Google Scholar]
- Hargens AR, Schmidt DA, Evans KL, Gonsalves MR, Cologne JB, Garfin SR, Mubarak SJ, Hagan PL, Akeson WH. Quantitation of skeletal-muscle necrosis in a model compartment syndrome. J Bone Joint Surg Am. 1981;63:631–636. [PubMed] [Google Scholar]
- Hawley MS, Broquetas A, Jofre L, Bolomey JCh, Gaboriaud G. Microwave imaging of tissue blood content changes. J.Biomed. Eng. 1991;13:197–202. doi: 10.1016/0141-5425(91)90126-r. [DOI] [PubMed] [Google Scholar]
- Joines WT, Zhang Y, Li C, Jirtle RL. The measured electrical properties of normal and malignant human tissue. Medical Physics. 1994;31:547–550. doi: 10.1118/1.597312. [DOI] [PubMed] [Google Scholar]
- Kao HP, Cardos ER, Shwedyk E. Correlation of permittivity and water content during cerebral edema. IEEE Trans. BME. 1999;46:1121–1128. doi: 10.1109/10.784144. [DOI] [PubMed] [Google Scholar]
- Lazebnik M, McCartney L, Popovic D, Watkins C, Lindstrom MJ, Harter J, Sewall S, Magliocco A, Booske JH, Okoniewski M, Hagness SC. A large-scale study of the ultrawideband microwave dielectric properties of normal breast tissue obtained from reduction surgeries. Phys.Med.Biol. 2007a;52:2637–2656. doi: 10.1088/0031-9155/52/10/001. [DOI] [PubMed] [Google Scholar]
- Lazebnik M, Popovic D, McCartney L, Watkins CB, Lindstrom MJ, Harter J, Sewall S, Ogilvie T, Magliocco A, Breslin TM, Temple W, Mew D, Booske JH, Okoniewski M, Hagness SC. A large-scale study of the ultrawideband microwave dielectric properties of normal, benigh and malignant breast tissues obtained from cancer surgeries. Phys.Med.Biol. 2007b;52:6093–6115. doi: 10.1088/0031-9155/52/20/002. [DOI] [PubMed] [Google Scholar]
- Meaney PM, Fanning MW, Raynolds T, Fox CJ, Fang Q, Kogel CA, Poplack SP, Paulsen KD. Initial clinical experience with microwave breast imaging in women with normal mammography. Academic Radiology. 2007;14:207–221. doi: 10.1016/j.acra.2006.10.016. [DOI] [PMC free article] [PubMed] [Google Scholar]
- Mojabi P, LoVetri J. Microwave Biomedical Imaging Using the Multiplicatively Regularized Gauss–Newton Inversion Method. IEEE A and WP Letters. 2009;8:645–648. [Google Scholar]
- Poplack SP, Tosteson TD, Wells WA, Pogue BW, Meaney PM, Hartov A, Kogel CA, Soho SK, Gibson JJ, Paulsen KD. Electromagnetic breast imaging: results of a pilot study in women with abnormal mammograms. Radiology. 2007;243:350–359. doi: 10.1148/radiol.2432060286. [DOI] [PubMed] [Google Scholar]
- Semenov SY, Svenson RH, Boulyshev AE, Souvorov AE, Borisov V, Sizov YE, Dezern KR, Baranov VY, Tatsis GP, Starostin AN. Microwave tomography. Two-dimensional system for biological imaging. IEEE Trans BME. 1996;43:869–877. doi: 10.1109/10.532121. [DOI] [PubMed] [Google Scholar]
- Semenov SY, Bulysheb AE, Souvorov AE, Svenson RH, Sizov YE, Borisov VY, Posukh VG, Kozlov IM, Nazarov AG, Tatsis GP. Microwave tomography: theoretical and experimental investigation of the iteration reconstruction algorithm. IEEE Trans. MTT. 1998;46:133–141. [Google Scholar]
- Semenov SY, Svenson RH, Bulyshev AE, Souvorov AE, Nazarov AG, Sizov YE, Pavlovsky A, Borisov VY, Voinov BG, Simonova G, Starostin AN, Tatsis GP, Baranov VY. Three dimensional microwave tomography. Experimental prototype of the system and vector Born reconstruction method. IEEE Trans. BME. 1999;46:937–946. doi: 10.1109/10.775403. [DOI] [PubMed] [Google Scholar]
- Semenov SY, Svenson RH, Tatsis GP. Microwave spectroscopy of myocardial ischemia and infarction. 1. Experimental study. Annals of Biomed. Eng. 2000a;28:48–54. doi: 10.1114/1.253. [DOI] [PubMed] [Google Scholar]
- Semenov SY, Bulyshev AE, Souvorov AE, Nazarov AG, Sizov YE, Svenson RH, Posukh VG, Pavlovsky AV, Repin PN, Tatsis GP. Three dimensional microwave tomography: Experimental imaging of phantoms and biological objects. IEEE Trans MTT. 2000b;48:1071–1074. [Google Scholar]
- Semenov SY, Svenson RH, Bulyshev AE, Souvorov AE, Nazarov AG, Sizov YE, Posukh VG, Pavlovsky AV, Repin PN, Tatsis GP. Spatial resolution of microwave tomography for detection of the myocardial ischemia and infarction. Experimental study on two-dimensional models. IEEE Trans MTT. 2000c;48:538–544. [Google Scholar]
- Semenov SY, Svenson RH, Posukh VG, Nazarov AG, Sizov YE, Kassel J, Tatsis GP. Dielectric spectroscopy of canine myocardium during ischemia and hypoxia at frequency spectrum from 100KHz to 6GHz. IEEE Trans. MI. 2002a;21:703–707. doi: 10.1109/TMI.2002.800590. [DOI] [PubMed] [Google Scholar]
- Semenov SY, Svenson RH, Boulyshev AE, Souvorov AE, Nazarov AG, Sizov YE, Posukh VG, Pavlovsky A, Repin PN, Starostin AN, Voinov B, Tatsis GP, Baranov VY. Three-dimensional microwave tomography: initial experimental imaging of animals. IEEE Trans. BME. 2002b;49:55–63. doi: 10.1109/10.972840. [DOI] [PubMed] [Google Scholar]
- Semenov SY, Bulyshev AE, Posukh VG, Sizov YE, Williams TC, Souvorov AE. Microwave tomography for detection/imaging of myocardial infarction. 1. Excised canine hearts. Annals of Biomed. Eng. 2003;31:262–270. doi: 10.1114/1.1553452. [DOI] [PubMed] [Google Scholar]
- Semenov SY, Kellam JF, Althausen P, Williams TC, Abubakar A, Bulyshev A, Sizov Y. Microwave tomography for functional imaging of extremity soft tissues. Feasibility assessment. Phys. Med. Biol. 2007;52:5705–5719. doi: 10.1088/0031-9155/52/18/015. [DOI] [PubMed] [Google Scholar]
- Semenov SY. Microwave Tomography: Review of the Progress towards Clinical applications. Phil. Trans. R. Soc. A. 2009;367:3021–3042. doi: 10.1098/rsta.2009.0092. [DOI] [PMC free article] [PubMed] [Google Scholar]
- Smith SR, Foster KR, Wolf GL. Dielectric properties of VX-2 carcinoma versus normal liver tissue. IEEE Trans. BME. 1986;33:522–524. doi: 10.1109/TBME.1986.325740. [DOI] [PubMed] [Google Scholar]
- Souvorov AE, Bulyshev AE, Semenov SY, Svenson RH, Nazarov AG, Sizov YE, Tatsis GP. Microwave tomography: a two-dimensional Newton iterative scheme. IEEE Trans. MTT. 1998;46:1654–1659. [Google Scholar]
- Surowiec AJ, Stuchly SS, Barr JR, Swarup A. Dielectrical properties of breast carcinoma and the surrounding tissues. IEEE Trans. BME. 1988;35:257–263. doi: 10.1109/10.1374. [DOI] [PubMed] [Google Scholar]


