

Abstract
Objective
Abnormal myelination is a major pathological sequela of chronic periventricular white matter injury (PWMI) in survivors of premature birth. We tested the hypothesis that myelination failure in chronic hypoxia-ischemia-induced PWMI is related to persistent depletion of the oligodendroctye (OL) precursor pool required to generate mature myelinating OLs.
Methods
A neonatal rat model of hypoxia-ischemia was employed where acute degeneration of late OL progenitors (preOLs) occurs via a mostly caspase-independent mechanism. The fate of OL lineage cells in chronic cerebral lesions was defined with OL-lineage-specific markers.
Results
Acute caspase-3-independent preOL degeneration from hypoxia-ischemia was significantly augmented by delayed preOL death that was caspase-3-dependent. Degeneration of preOLs was offset by a robust regenerative response that resulted in a several-fold expansion in the pool of surviving preOLs in chronic lesions. However, these preOLs displayed persistent maturation arrest with failure to differentiate and generate myelin. When preOL-rich chronic lesions sustained recurrent hypoxia-ischemia at a time in development when white matter is normally resistant to injury, an approximately 10-fold increase in caspase-dependent preOL degeneration occurred relative to lesions caused by a single episode of hypoxia-ischemia.
Interpretation
The mechanism of myelination failure in chronic white matter lesions is related to a combination of delayed preOL degeneration and preOL maturation arrest. The persistence of a susceptible population of preOLs renders chronic white matter lesions markedly more vulnerable to recurrent hypoxia-ischemia. These data suggest that preOL maturation arrest may predispose to more severe white matter injury in preterm survivors that sustain recurrent hypoxia-ischemia.
Human periventricular white matter injury (PWMI) is the major form of brain injury and leading cause of cerebral palsy in survivors of premature birth. With advances in neonatal care, a changing spectrum of chronic PWMI has emerged. Whereas focal cystic necrotic lesions (periventricular leukomalacia; PVL) previously predominated,1, 2 recent neuroimaging studies support that focal or diffuse noncystic myelination disturbances and cerebral gray matter atrophy are now the major lesions associated with chronic PWMI.3–6
The critically-ill preterm neonate appears to be particularly susceptible to ischemic white matter injury related to developmentally-regulated susceptibility of preOLs to oxidative stress.2,7 PreOLs are pre-myelinating, mitotically-active late oligodendrocyte (OL) progenitors that generate mature myelinating OLs.7 The high-risk period for PWMI coincides with selective vulnerability of preOLs to oxidative stress.8–11 Early human PWMI lesions display a pronounced but not complete reduction in preOL density,8 which suggests a mechanism for subsequent myelination failure in chronic PWMI. However, the fate of the residual pool of preOLs is unknown. Prior studies have not determined if myelination disturbances are related to persistent depletion of preOLs.12–17
We hypothesized that myelination failure in chronic PWMI is related to acute degeneration of preOLs from hypoxia-ischemia (H–I) that depletes the preOL pool available to generate mature OLs. We employed a preterm-equivalent neonatal rat model of H–I where white matter injury is accompanied by pronounced acute preOL degeneration via a mostly caspase-3-independent mechanism and earlier and later OL stages are markedly more resistant.10,18 We analyzed diffuse non-cystic white matter lesions that resemble those now common in human PWMI. Paradoxically, chronic white matter lesions displayed myelination failure that coincided with reactive astrogliosis and robust regeneration of preOLs. Expansion of the preOL pool occurred despite delayed preOL death that was caspase-3-mediated. These unexpected findings support an alternative explanation for myelination failure in chronic non-cystic PWMI that is related to a persistent arrest of OL maturation at pre-myelinating stages. PreOL maturation arrest may have deleterious consequences for preterm survivors that sustain recurrent hypoxia-ischemia. We demonstrate that persistence of preOLs beyond their normal developmental window markedly increases white matter susceptibility to injury in response to recurrent hypoxia-ischemia.
Materials and Methods
Animal Surgical Procedures
The left common carotid artery was ligated in Sprague-Dawley rats (10 pups per litter) at P3 or P7.10,19 To achieve moderate cerebral injury, pups were placed in containers (submerged in a 37°C water bath to maintain normothermia) through which humidified oxygen (6% for 3.5h at P3 or 8% for 2.5 h at P7) and balanced nitrogen flowed at 3 L/min. Thereafter, the pups were returned to their dams until sacrifice. For recurrent hypoxia-ischemia (rH-I), pups were subjected to H–I at P3 and recovered until P7 when the left common carotid artery was again ligated distal to the ligation done at P3. Since the carotid artery distal to the first ligation had visible blood flow, the repeated ligation was done due to apparent re-canalization or re-anastomosis of the carotid artery. After repeated ligation, pups recovered for 2h with the dam and were exposed to humidified oxygen (8% for 2.5 h), as described above. For recurrent H–I, a total of 37 animals were operated in 3 separate studies with a total mortality of 13 animals (32 ± 26%).
Unless otherwise noted, after H–I at P3, animals survived for 1, 4, 7 or 11 days (i.e., until P4, P7, P10 or P14). Animals were randomly allocated to each survival group. A minimum of three brains was analyzed at each time point (see figure legends for details). For each study, between 10 and 20 animals from two separate litters were combined without identifiers and randomly operated for carotid ligation. Studies were repeated at least once, and thus, animals from a minimum of four separate litters were entered into each study. For a single episode of HI at P3, 154 animals were operated in 10 separate studies with a total mortality of 9 animals (i.e., 6 ± 8% mortality).
Immunohistochemical Studies
Brains were fixed for 24 h by immersion in ice-cold 4% paraformaldehyde in 0.1M phosphate buffer, pH7.4 and stored at 2–4°C in PBS. Free-floating coronal sections of brains with moderate lesions (50μm) were serially-cut in ice cold PBS with a Leica VTS-1000 vibrating microtome. Tissue sections were stored in cryoprotectant solution (30%v/v ethylene glycol, 15% w/v sucrose in 30 mM phospate buffer, pH 7.4) at −20°C. The immunohistochemical protocols to visualize specific OL lineage stages were described.18 Early OL progenitors were distinguished by a combination of the O4 antibody and a rabbit polyclonal antibody against the platelet-derived growth factor receptor-alpha (PDGFRα; 1:1000; courtesy of Dr. William Stallcup, Burnham Institute, La Jolla, CA).20 Fluorescent double-labeling to distinguish preOLs (O4+O1-) and immature OLs (O4+O1+) employed a biotinylated O4 antibody and the O1 antibody.11 Astrocytes were visualized with rabbit anti-bovine glial fibrillary acidic protein (GFAP) antisera (1:1000; Z-0334; DAKO, Carpinteria, CA), a mouse anti-human vimentin antibody (Clone V9, V6630: Sigma, Saint Louis, MO) or mouse anti-rat CD44 antibody 5G8 (1:20; courtesy of Dr. Larry S. Sherman).21 Axons were visualized with the pan-axonal neurofilament marker, mouse monoclonal antibody SMI-312 (1:1000; SMI-312R; Covance, Berkley, CA).22 Neurons were visualized with a mouse biotinylated anti-NeuN antibody (1:100; MAB377B; Chemicon, Temecula, CA) detected with Rhodamine Red X-conjugated Streptavidin (1:400; 016-290-084; Jackson ImmunoResearch, West Grove, PA). Mouse monoclonal antibody Ki67 (1:200; NCL-L-Ki67-MM1; Novocastro, Newcastle upon Tyne, UK) was visualized after antigen retrieval (20 min in 50 mM sodium citrate, pH 6.0 at 90°C). Degenerating O4 antibody-labeled cells were double-labeled with anti-activated caspase-3 rabbit polyclonal antisera (1:1000; #9664; Cell Signaling Technology; Danvers, MA). Tissue sections were counterstained with Hoechst 33324 to visualize nuclear morphology. Immuofluorescence staining was visualized with a Leica DMRA upright fluorescent microscope and photographed with a Hammamatsu Orca ER photometric cooled charge-coupled device camera driven with Improvision Openlab 4.0.2 software.
Quantification of the Density of PDGRRα or O4-labeled cells
In perinatal rodents, the PDGFRα localizes mostly to OL progenitors, while the O4 antibody labels the total pool of preOLs (O4+O1-) and immature OLs (O4+O1+).20 The total density of PDGFRα- or O4-labeled cells was determined in tissue sections counterstained with Hoechst 33324 to define regional boundaries. Tissue sections were double-labeled for GFAP to define lesions that displayed reactive astrogliosis. Cells were counted in a blinded manner in a minimum of three adjacent coronal sections in lesions and corresponding control regions in the contralateral hemisphere.10 Lesions were analyzed at the level of the mid-septal nuclei, and typically encompassed the supracallosal radiation, the underlying corpus callosum, the adjacent external capsule and overlying cerebral cortex.10 For each lesion, a minimum of eight fields was counted per section. Cell profiles that contained a nucleus, visualized with Hoechst 33324, were counted with a 40× (0.0625 mm2/field) objective equipped with a counting grid. The profiles of both intact-appearing and degenerating OL-lineage cells were counted and together comprised the calculation of the total cell density. Degenerating cells were confirmed to contain a pyknotic nucleus.
Quantification of the Density of Triple-labeled Cells
Tissue sections were immunofluorescently double-labeled for: cleaved caspase-3 and O4, PDGFRα and O4, Ki67 and O4, or Ki67 and PDGFRα. Cell nuclei were counterstained with Hoechst 33324. Due to the complexity of the triple-staining, Z-stacks of ten or more digitized images were collected for each of the three fluorophores (fluoroscein, rhodamine and Hoechst 33324) with a 40× objective at 1 μm steps and an orthogonal projection image was generated for each fluorophore. For each field analyzed, the three projection images were merged. A minimum of 10 merged projection images was generated to quantify the density of triple-labeled cells within control regions or lesions. Lesions were identified by the typical reactive-appearance of early OL progenitors and preOLs. Only cell profiles that contained a nucleus were counted.
Statistical Analysis
In the rat and other lissencephalic animals, cortical thickness is directly proportional to the cubed root of the cortical volume.23 To determine the effect of cerebral atrophy upon cell density measurements, mean cerebral thickness was used as a marker of cerebral volume. For each lesion and corresponding contralateral control region, cerebral thickness was measured between the pial surface and the ventral surface of the subcortical white matter. Three measurements were obtained at the medial and lateral boundaries of the lesion and the approximate midpoint of the lesion. Paired samples t-tests were first run between the H–I and control groups to determine relative atrophy between groups. All single H–I groups (P4, P7, P10, P14) and rH-I groups were analyzed against controls. All groups showed a significant decrease in cerebral thickness. After single H–I at P4, cerebral thickness (mm) in controls was 2.32 ± 0.07 vs. 2.18 ± 0.06 in the H–I group (p=0.03, Student’s t-test). At P14, cerebral thickness in controls was 2.9 ± 0.12 vs. 2.04 ± 0.27 in the H–I group (p<0.0001). Overall, when all four single H–I groups were combined, cerebral thickness in the H–I group was 2.15 ± 0.08 vs. control (2.73 ± 0.06; p<0.0001).
Due to this reduction in cerebral thickness, we accounted for the degree of atrophy by using cerebral thickness as a covariate when comparing cell density measurements between treatment groups. We first tested the homogeneity of regression assumption within each study and when no violations to the model were found (i.e., no interaction between factors), full factorial univariate ANCOVAs were run, with cerebral thickness as the covariate, cell density as dependent variable, and treatment (H–I, H–I control or normoxia-control) as the fixed factor.
Cell density data were presented uncorrected for atrophy. These data were analyzed by paired samples t-tests between H–I and the contralateral control hemisphere (i.e., H–I control group). In some studies, uncorrected cell density data were also compared between the H–I group and a separate normoxia control group (i.e., normoxia-control) by independent samples t-tests. Means ± SEMs for dependent variables are presented in all figures with significance indicated for both statistical analyses (paired samples t-tests and univariate ANCOVAs). For all figures *p<.05, **p<.01, ***p<.001 refers to analysis of data corrected for cerebral atrophy by univariate ANCOVAs and †p<.05, ††p<.01, †††p<.001 refers to analysis of uncorrected data by paired samples t-tests.
Results
Perinatal H–I triggers delayed OL lineage death that is caspase-dependent
In the preterm-equivalent rat, H–I causes mostly caspase-3-independent acute preOL degeneration.10 To determine the fate of the pool of OL lineage cells that survived for 1, 4, 7 or 11 days after acute H–I at P3, we quantified the density of O4-antibody-labeled cells with morphological features of degeneration. The O4-antibody labels both preOLs and OLs.10 At 24 h after H–I (Fig. 1A), a high density of cells were acutely degenerating that had a shrunken soma and fragmented processes (Fig. 1B, C). Cell degeneration was detected for at least 7 days after acute H–I (Fig. 1A).
Figure 1.

Perinatal H–I triggers acute preOL degeneration that is mostly independent of caspase-3 activation and delayed preOL degeneration that is caspase-3-dependent. (A) The density of O4-labeled cells with morphological features of degeneration peaked 24h after H–I (P4) and remained significantly elevated at P7 (†p=0.02, Univariate ANCOVA; *p= 0.04, paired samples t-test) and P10 (†p=0.04, Univariate ANCOVA; *p=0.04, paired samples t-test; n=3 per each survival time). (B) Degenerating O4-labeled cells at P4 (arrowheads) typically had fragmented processes and cytoplasmic O4-staining, consistent with disrupted membrane integrity. (C) At P7, degenerating O4-labeled cells (arrowheads) were reduced relative to P4. (D) The density of O4+/cleaved-caspase-3+ cells was very low at P4, peaked at P7 (†p=0.03, Univariate ANCOVA; *p=0.04, paired samples t-test) and remained elevated at P14 (†p=0.000, Univariate ANCOVA; ***p= 0.01, paired samples t-test; n=3 per each survival time). (E) At P4, few O4-labeled cells (red) stained for cleaved-caspase-3 (green). (F) At P7, numerous O4-labeled cells were caspase-3-positive. Scale bars: 100 μm.
The density of degenerating O4-labeled cells that stained for cleaved caspase-3 was very low at P4 (Fig. 1D), but by P7 was very similar to the density of cells that acutely degenerated via a caspase-3-independent mechanism at P4 (Fig. 1A). Within clusters of O4-labeled cells, were many cells that appeared morphologically intact but were undergoing caspase-dependent apoptosis, as supported by staining for cleaved caspase-3 (Fig. 1E, F). Hence, there was significant delayed death of OL-lineage cells that occurred via a mechanism distinct from that, which triggered acute cell death.
Chronic post-ischemic cerebral lesions display hypomyelination
We hypothesized that the combination of acute and delayed cell death depletes OL lineage cells required for cerebral myelination. We stained with the O1 antibody to detect early myelination in P10 animals that survived for 7 days after H–I. Control cerebral white matter had a normal early myelination pattern (Fig. 2A) and a distribution of GFAP-labeled astrocytes mostly restricted to the white matter (Fig. 2B). In contrast, the contralateral post-ischemic hemisphere showed a striking lack of myelin staining (Fig. 2C) that overlapped with diffuse GFAP staining (Fig. 2D).
Figure 2.
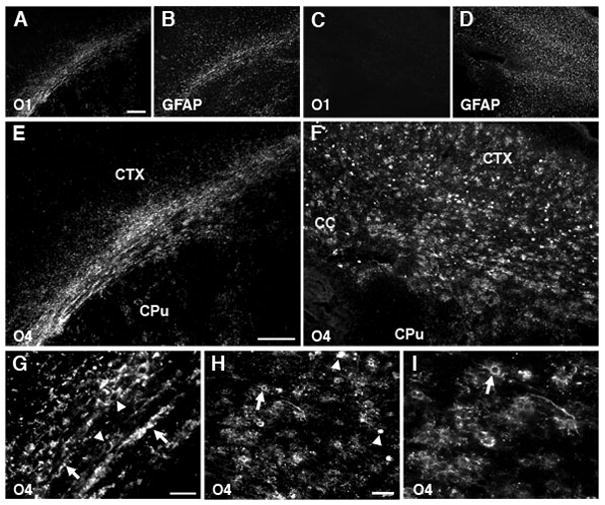
Numerous O4-positive cells accumulate in myelin-deficient lesions. (A) Normal early myelination (O1-antibody) in controls at P10 coincided with GFAP-labeled astrocytes (B) mostly restricted to the white matter. (C) Absence of myelin in the contralateral post-ischemic lesion coincided with diffuse staining for GFAP-labeled astrocytes (D). (E) Early myelination in controls at P10 (O4 antibody). (F) Absence of myelin in the contralateral lesion coincided with numerous immature-appearing O4-labeled cells. (G) Control corpus callosum contained numerous O4-labeled myelin sheaths (arrows) and myelinating cells (arrowheads). (H) Within chronic lesions, degenerating O4-labeled cells (arrowheads) were the minority relative to intact-appearing cells (arrows). (I) Detail of H (see arrow in H) shows the typical immature morphology of O4-labeled cells in lesions. Scale bars: A–D, 200μm; E–H, 100μm; I, 50 μm.
Staining with O4 confirmed normal myelination in the control hemisphere (Fig. 2E). However, reduced myelination in cerebral lesions was not accompanied by a loss of OL lineage cells, as we hypothesized. Rather, numerous O4-labeled apparent preOLs were visualized throughout lesions (Fig. 2F). Thus, control white matter contained O4-labeled somata with a markedly reduced arbor of processes and apparent contacts with myelin sheaths (Fig. 2G). However, in lesions at P10 (Fig. 2H, I) and P14 (data not shown), only pre-myelinating O4-labeled cells were seen without myelin sheaths. Scattered degenerating cells were also present in lesions (Fig. 2H, arrowheads), but most cells appeared morphologically intact (Fig. 2H, I, arrows).
Axons are unmyelinated in chronic lesions (Supplemental Figure 1)
We next determined if the accumulation of pre-myelinating O4-labeled cells in chronic lesions was related to a loss of intact axons. In control white matter at P10, staining for O4 (Supp Fig. 1A) and anti-neurofilament (NF) protein antibody SMI-312 (Supp. Fig. 1B) revealed a normal distribution of myelinated axons and myelinating OLs (Supp. Fig. 1E,G; arrowheads). By contrast, numerous O4-labeled somata but no myelin sheaths (Supp. Fig. 1C) localized to lesions where a normal pattern of SMI-312-labeled axons was seen (Supp. Fig. 1D,F,H). Hence, chronic lesions had no apparent loss of axons, but accumulated pre-myelinating cells that failed to initiate myelination.
Chronic post-ischemic lesions show arrested OL lineage maturation and preOL accumulation
We next determined if the numerous pre-myelinating O4-labeled cells in lesions were preOLs or aberrant glial cells generated in response to injury. In P10 control white matter, myelinating cells stained with the O4 and O1 antibodies (Fig. 3A–C). However, in lesions, few O4-labeled cells stained for O1 (Fig. 3D–F). We determined if these apparent preOLs (O4+O1-) were an atypical astroglial progenitor cell. However, O4-labeled cells did not stain for GFAP (Fig. 3G) or vimentin (Fig. 3H), markers of astroglia and radial glia, respectively. Nor did they label for CD44 (Fig. 3I), a marker of astroglial progenitors,24 or for the neural stem cell marker nestin (data not shown). In ischemic lesions, O4-labeled cells markedly accumulated where NeuN-labeled neurons were reduced (Fig. 3J), but these O4-labeled cells did not express NeuN (Fig. 3K).
Figure 3.

Chronic post-ischemic lesions show arrested OL lineage maturation at the preOL stage. (A–C) Myelin and OLs (arrows) in the control corpus callosum, visualized with biotinylated O4-(bO4) (A) and O1- (B) antibodies; merge in “C.” (D–E) Contralateral white matter lesion contains mostly preOLs (arrowheads) that are bO4-positive (D) but O1-negative (E). Merge in “F” shows double-labeled OLs (arrows). (G–K) O4-labeled apparent preOLs do not label for astroglial (G–I) or neuronal (J,K) markers. (G,H) O4-labeled cells (red) do not stain for the mature astrocyte markers GFAP (green, arrows; G) or vimentin (green, arrows; H); nuclei stained with Hoechst 33324 (blue in G–I). (I) O4-labeled cells (green, arrows) do not stain for CD44 (red, a marker of mature astrocytes and astroglial progenitors). (J) Chronic cerebral gray matter lesion contained numerous O4-labeled cells (green) but fewer NeuN-labeled neurons (red). (K) O4-labeled cells (green, arrowheads) do not label with neuronal nuclear marker NeuN (red, arrows). (L) A significant increase in density of O4-labeled cells persisted in post-ischemic lesions analyzed at P4 (*p= 0.04, univariate ANCOVA for HI control; p= 0.012, univariate ANCOVA, normoxia control; †p= 0.016, independent samples t-test, normoxia control), at P7 (*p=0.03, univariate ANCOVA; †p= 0.02, paired samples t-test) at P10 (*p=0.02, univariate ANCOVA; †p= 0.04, paired samples t-test) and P14 (**p=0.003, Univariate ANCOVA; †p= 0.02, paired samples t-test, H–I control; *p= 0.013, univariate ANCOVA, normoxia control; †††p= 0.000, independent samples t-test, normoxia control) (n=3 per group). Scale bars: A–F, 50 μm; G–I, 100μm; J, 200μm; K, 50μm.
Between P4 and P14, preOL density increased significantly in cerebral lesions relative to controls (Fig. 3L). At P4, preOL density in lesions increased more than 2-fold relative to controls. PreOL density at P7 was ~4-fold higher than control. Thereafter, preOL density declined but remained significantly elevated relative to control at P10 and P14. Hence, post-ischemic lesions contained a markedly expanded population of OL lineage cells that were arrested at the preOL stage and failed to initiate normal myelination.
Early OL progenitors in chronic post-ischemic lesions display a pronounced increase in density that follows a time-course distinct from preOLs
The total pool of cerebral OL progenitors is comprised of distinct populations of OL progenitors that stain for platelet-derived growth factor receptor-alpha (PDGFRα) and preOLs (late OL progenitors).25 In lesions, PDGFRα localized to cells distinct from those stained for O4 (Fig. 4A) or O1-positive immature OLs (Fig. 4B). The PDGFRα was not expressed by GFAP-labeled reactive astrocytes (Fig. 4C). PDGFRα-positive OL progenitors were markedly increased in lesions (Fig. 4D) relative to controls (Fig. 4E) and closely over-lapped in distribution with GFAP-labeled reactive astrocytes (Fig. 4F). The PDGFRα-positive progenitors in lesions (Fig. 4H) had a more extensive arbor of processes and the somata were hypertrophic compared to controls (Fig. 4I).
Figure 4.
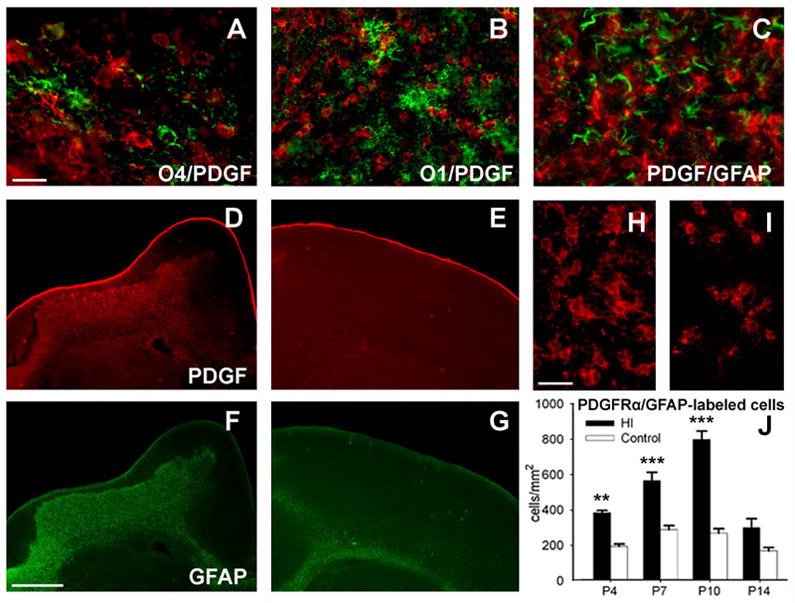
Early OL progenitors in chronic post-ischemic lesions display a pronounced increase in density that follows a time-course distinct from preOLs. (A–C) In cerebral lesions, staining for PDGFRα (red) identified numerous early OL progenitors that were distinct from O4-labeled cells (A), O1-labeled OLs (B), and GFAP-labeled reactive astrocytes (C). (D–G) Low power images of double-labeling for PDGFRα and GFAP in a large cerebral lesion (D, F) relative to a similar contralateral control region (E, G). (D, E) Staining for PDGFRα was markedly increased in chronic lesions “D” relative to control “E.” Note that in the lesion the distribution of staining for PDGFRα “D” closely overlaps with that of GFAP “F.” (H, I) High power images of cells stained for PDGFRα in lesions “H” versus control “I.” Cells in lesions were morphologically reactive in appearance with hypertrophic somata and more ramified processes. (J) A significant increase in density of PDGFRα-labeled OL progenitors persisted in post-ischemic lesions analyzed at P4 (**p=0.002, univariate ANCOVA; ††p=0.008, paired samples t-test; **p= 0.009, univariate ANCOVA, normoxia control; ††p= 0.001, independent samples t-test, normoxia control), at P7 (***p=0.000, univariate ANCOVA and †††p=0.000, paired samples t-test) and P10 (***p=0.000, univariate ANCOVA; †††p=0.000, paired samples t-test); n=3 in P4 and P14 groups; n=5 in P7 and P10 groups. Scale bars: A–C, 100μm; D–G, 1mm; H, I, 50μm.
In lesions, the density of PDGFRα-positive OL progenitors increased ~2-fold relative to controls by P4 (Fig. 4J) and continued to increase significantly at P7 and P10. Despite the decline in OL progenitors at P14, degenerating cells were not visualized at this time or earlier (data not shown). Hence, the increase in density of OL progenitors and preOLs after H–I followed different time-courses, and these two populations of progenitors differed in their susceptibility to delayed cell death in chronic post-ischemic cerebral lesions.
Early OL progenitors proliferate in post-ischemic lesions
We next determined if the increase in OL progenitors and preOLs in lesions was due to cell proliferation. Proliferating cells were identified with the cell cycle-cell proliferation marker Ki67, which is expressed by mammalian cells at all phases of the cell cycle, but is not induced by DNA damage or repair.26,27 Nuclear staining with Ki67 was detected in both O4-antibody-labeled preOLs (Fig. 5A) and PDGFRα-labeled OL progenitors (Fig. 5C). The density of Ki67–labeled preOLs (Fig. 5B) was much lower than Ki67–labeled OL progenitors (Fig. 5D). Significant proliferation of OL progenitors was seen at P4 and was still detected at P14. In lesions, we also detected an increase in transitional OL progenitors that labeled for both PDGFRα and O4-antibody (Fig. 5E), which supported that OL progenitors contributed to the increased density of preOLs.
Figure 5.

Both early OL progenitors and preOLs proliferate in post-ischemic lesions. (A) A subset of O4-labeled cells (red, arrowhead) stained with the nuclear proliferation marker Ki67 (green). (B) A significant increase in O4/Ki67-labeled cells was detected at P10 (*p=0.01, univariate ANCOVA; †p= 0.02, paired samples t-test; n=3 per group). (C) A subpopulation of PDGFRα-labeled cells (red, arrowhead) stained with Ki67 (green). (D) A significant increase in PDGFRα/Ki67-labeled cells was detected in post-ischemic lesions at P4 (**p=0.002, univariate ANCOVA; †p=0.01, paired samples t-test), at P7 (††p=0.007, paired samples t-test), at P10 (†p= 0.04, paired samples t-test) and P14 (***p=0.000, univariate ANCOVA; ††p= 0.003, paired samples t-test); n=4 at P4 and P14; n=5 at P7 and P10). (E) Apparent early OL progenitor-derived cells (arrowheads) labeled with O4 antibody (green) and for PDGFRα. (F) The SVZ was not an apparent source of early OL progenitors (PDGFRα+O4-), transitional OL progenitors (PDGFRα+O4+) or preOLs (PDGFRα-O4+) in post-ischemic lesions. Lesions showed no significant increases in these three classes of OL progenitors at P7 or P10. Scale bars: A,C, 100μm; E, 50μm.
We also determined whether chronic injury stimulated proliferation of OL-lineage cells in the subventricular zone (SVZ) that might further contribute to the expansion of OL progenitors and preOLs. Neither at P7 nor P10, did we detect increased numbers of OL progenitors (PDGFRα+O4-) transitional OL progenitors (PDGFRα+O4+) or preOLs (PDGFRα-O4+) in the SVZ (Fig. 5F). Hence, the SVZ did not appear to be a significant source of either OL progenitors or preOLs in lesions.
Maturation arrest of the OL lineage in chronic cerebral lesions confers enhanced susceptibility to recurrent hypoxia-ischemia
Since H–I at P3 resulted in arrested preOL maturation, we tested the hypothesis that preOL-rich chronic white matter lesions have an extended developmental window of susceptibility to H–I. We analyzed lesions from rats that first sustained H–I at P3 and again sustained recurrent H–I (rH-I) at P7 (see Materials and Methods). At P8, 24h after rH-I, we determined the density of O4-labeled cells relative to animals at P8 that sustained a single episode of H–I at P3 or P7. For all conditions, total cell density was significantly increased relative to control (Fig. 6A), but was higher in response to rH-I (672 ± 46 cells/mm2) relative to H–I at P3 (430 ± 35) or P7 (347 ± 40). The density of cells with morphological features of degeneration (Fig. 6B) was much higher in response to rH-I (189 ± 12 cells/mm2) relative to H–I at P3 (19 ± 1) or P7 (73 ± 17). In response to rH-I (Fig. 6C), there was an ~10-fold increase in density of cells stained for O4 and cleaved caspase-3 (510 ± 27) relative to H–I at P3 (60 ± 2) or P7 (45 ± 4). PreOLs were markedly more susceptible to caspase-3-mediated degeneration from rH-I (Fig. 6D) than from a single episode of H–I at P3 (Fig. 6E) or P7 (Fig. 6F). After rH-I, 76 ± 2% of the total preOLs stained for caspase-3, whereas 13 ± 2% were observed 5-days after H–I at P3 and 14 ± 1% were observed 24h after H–I at P7. At 24h after H–I at P3, 0.3 ± 0.2% of the total preOLs stained for caspase-3 (see Fig. 1D).
Figure 6.

Recurrent H–I (rH-I) at P7 markedly increased the acute degeneration of preOLs in chronic lesions generated after initial H–I at P3. Comparison of responses observed on P8 at: 1 day after rH-I, 5 days after H–I at P3 or 1 day after H–I at P7. (A) Total O4-labeled cells were significantly increased in response to rH-I (***p=0.000, univariate ANCOVA; †††p=0.000, paired samples t-test) or single episodes of H–I at P3 (*p=0.03, univariate ANCOVA; †p=0.02, paired samples t-test) or P7 (*p=0.05, univariate ANCOVA; †p=0.03, paired samples t-test); n=3 in P3 and P7 groups; n=6 in rH-I group for panels A–C. (B) Density of O4-labeled cells with morphological features of degeneration was significantly increased in response to rH-I (***p=0.000, univariate ANCOVA; †††p=0.000, paired samples t-test) and after H–I at P3 (**p=0.003, univariate ANCOVA; ††p=0.003, paired samples t-test). (C) A pronounced increase in density of O4+/cleaved caspase-3-positive cells in response to rH-I (***p=0.000, univariate ANCOVA; †††p=0.000, paired samples t-test), relative to H–I at P3 (***p=0.000, univariate ANCOVA; ††p=0.001, paired samples t-test) or H–I at P7 (**p=0.005, univariate ANCOVA; †p=0.03, paired samples t-test). (D-F) Double-staining (arrows) for O4-antibody (red) and cleaved caspase-3 (green) in response to rH-I in “D,” H-I at P3 in “E” and H–I at P7 in “F.” Scale bars: D–F, 100μm.
The enhanced white matter susceptibility to rH-I was not accompanied by global degeneration of other OL lineage stages, astrocytes and axons (Supplemental Figure 2). Numerous reactive-appearing PDGFRα+ OL progenitors (Supp. Fig.2A, B) localized to the rH-I lesions. Although control white matter contained numerous early-myelinating O1-labeled OLs (Supp. Fig. 2C), reactive-appearing OLs but no myelin localized to the rH-I lesions (Supp. Fig. 2D). The rH-I lesions also contained numerous reactive astrocytes (Supp. Fig. 2E) with no morphological features of degeneration (Supp. Fig. 2F). Axons in control white matter (Supp. Fig 2G) and rH-I lesions (Supp. Fig 2H) labeled extensively for SMI-312. A reduction in NeuN-labeled neurons (Supp. Fig 2I, lower left) was seen in rH-I lesions, as confirmed by staining for Hoechst 33324 (Supp. Fig 2J). Hence, the greater resistance of early OL progenitors and astroglia to a single episode of H–I persisted in the rH-I lesions, whereas preOLs remained the predominant glial population susceptible to acute degeneration. Maturation arrest of preOLs in chronic lesions, thus, conferred markedly increased susceptibility to recurrent hypoxia-ischemia.
Discussion
Progress to prevent myelination failure in chronic PWMI has been hampered by limited information about the cellular mechanisms related to this common form of brain injury in survivors of premature birth. The delayed response of the OL lineage to injury is more complex than we and others predicted from studies of acute H–I.10,12,28 During the early phase of cerebral injury, acute preOL degeneration occurred via a mechanism mostly independent of caspase-3 activation. As cerebral injury progressed, delayed preOL degeneration was similar in magnitude to acute preOL degeneration, but occurred via a different mechanism that involved activation of caspase-3. This combination of acute and delayed preOL degeneration would appear to be sufficient to markedly reduce the pool of preOLs available to generate myelinating OLs. However, our data support that preOL degeneration is not sufficient to explain the myelination failure in chronic injury. Rather, early OL progenitors and preOLs displayed a robust regenerative response that compensated for acute and delayed preOL degeneration. Despite expansion of the precursor pool, preOLs in chronic lesions displayed a persistent arrest of maturation. Hence, on balance, the primary mechanism by which the OL lineage contributes to myelination failure involves arrest of preOL differentiation. The persistence of a large pool of preOLs with arrested differentiation conferred persistent susceptibility to H–I at a time in development when we previously showed that cerebral white matter in the P7 rat is more resistant to injury.10
We evaluated several alternative mechanisms for myelination failure in chronic lesions. We observed no apparent axonal degeneration or reductions in axon density with SMI-312, which detects intact and degenerating axons in fetal periventricular white matter.11, 22 Our results are consistent with recent findings that axons in P3 murine cerebral white matter are markedly more resistant to oxygen glucose deprivation than axons from later in development.29 We excluded that numerous OLs were present in lesions but failed to initiate contact with axons. We cannot exclude that intact-appearing axons in chronic lesions have alterations that inhibit preOL differentiation. We did not find aberrant preOLs that expressed markers of other neural or neural stem cell lineages.
Myelination failure in chronic PWMI appears related to an intrinsic failure of preOL differentiation. In multiple sclerosis (MS), preOLs have also been observed to accumulate adjacent to lesion borders where intact axons are present.30,31 The mechanism of preOL maturation arrest in chronic lesions is unknown. One potential explanation is inhibition of preOL maturation by substances intrinsic to the glial scar. Hypertrophic reactive astrogliosis is a well-established feature of chronic human PWMI.1 Similarly, we found that preOL accumulation in chronic H–I lesions consistently coincided with reactive astrocyte distribution. Since preOL degeneration is the major form of cell death in white matter lesions in rat and human,8–10 we speculate that acute and delayed preOL death together initiate and sustain the reactive astroglial response. The glial scar is enriched in astrocyte-derived glycoaminoglycans that persist in chronic white matter lesions including human PWMI lesions.32 Hyaluronic acid is also highly enriched in the glial scar arising from H–I in perinatal rats (Back and Sherman, unpublished observations). High molecular weight forms of hyaluronic acid accumulate in MS and traumatic spinal cord lesions and can block remyelination when introduced into lesions generated by chemical demyelination.31,33 It is, therefore, possible that hyaluronic acid or other molecules in the glial scar microenvironment block preOL maturation following perinatal H–I.
Our findings support that both early OL progenitors and preOLs are competent to generate robust but distinct reactive responses to perinatal white matter injury from H–I. Early OL progenitors were morphologically distinct from preOLs and displayed hypertrophic changes in the soma and processes that have been observed with other forms of CNS injury.34 By contrast, preOLs in chronic lesions typically accumulated as tightly-packed clusters of cells that displayed few processes. Early OL progenitors displayed a much more robust proliferative response in chronic lesions than did preOLs, which supports that early OL progenitors, resident in the white matter, were the primary source of preOLs that accumulated in chronic lesions. Although the total OL progenitor pool can be amplified from the SVZ in response to H–I,35,36 we found that the density of these cells in the post-ischemic SVZ did not increase sufficiently to account for the marked expansion in either progenitor pool.
OL progenitors and preOLs also differed substantially in their susceptibility to H–I. Unlike preOLs, OL progenitors were highly resistant to early degeneration after H–I10 and delayed degeneration in chronic lesions. The triggers for delayed preOL apoptosis are unknown, but may be intrinsic or related to loss of trophic support, possibly secondary to cerebral neuronal injury. Among the neuronal-derived growth factors that may be critical for preOL survival after perinatal H–I are the neurotrophins, including NGF and BDNF.37,38 The overall differences in the time courses for expansion of OL progenitors and preOLs may be related to differences in relative amounts of proliferation, death, and survival potential of these two contiguous OL progenitor stages, as well as the rate at which early OL progenitors differentiate to preOLs.
Recent changing patterns of PWMI reflect trends toward a marked reduction in the cystic lesions of PVL and a greater incidence of less severe focal or diffuse non-cystic lesions. The basis for these changing patterns may be multi-factorial. In a fetal sheep model of in utero global cerebral ischemia, we found that the duration of ischemia contributed to the severity of acute white matter injury in a non-linear fashion.22 A moderate duration of ischemia generated diffuse non-cystic PWMI, whereas more prolonged ischemia caused a pronounced increase in lesions that resembled PVL. We speculate that the recurrence of H–I episodes may also contribute to the severity of chronic PWMI. After a single episode of H–I, chronic moderate lesions, without necrosis were accompanied by diffuse myelination failure and preOL maturation arrest. Such lesions may retain the potential for myelination if preOL maturation can be promoted. Recurrent H–I caused more severe injury with pronounced preOL loss. Perhaps, infants with more mild non-cystic lesions sustain a single episode of ischemia of shorter duration, whereas more prolonged ischemia, especially if recurrent, results in more severe PWMI with a reduced potential for myelination.
During normal periventricular white matter development, the onset of myelination coincides with increased resistance to H–I and a decreased incidence of PWMI.11,22 Thus, preOL maturation arrest may render chronic lesions persistently more vulnerable to H–I, because the preOL is the OL stage most susceptible to oxidative stress.39,40 Hence, during prematurity, a single episode of white matter injury may extend the developmental window dominated by susceptible preOLs and, thereby, increase the risk for worse outcome after recurrent H–I. Future studies are needed to determine if preOL maturation arrest occurs in chronic human PWMI lesions, for how long it may persist, and if neurological outcome is improved when recurrent hypoxia-ischemia is prevented in preterm survivors.
Supplementary Material
Supplementary Figure 1. Failure of myelination in post-ischemic lesions at P10 despite intact-appearing axons. (A) Normal O4-labeled myelination pattern in the control hemisphere coincides with the presence of numerous intact axons in “B” labeled for neurofilament (NF) protein with SMI-312. (C) A typical post-ischemic lesion was rich in O4-labeled cells without apparent myelination of numerous axons in “D” that lacked features of axonal degeneration. (E,G) Control hemisphere: higher power details of SMI-312-labeled axons (red), O4-labeled myelinating cells (green, arrowheads) and scattered O4-labeled myelinated axons (arrows, yellow). (F,H) Post-ischemic lesion: higher power detail of intact-appearing SMI-312-labeled axons (red; arrows), O4-labeled somata (green; arrowheads). Note in “H” O4-labeled immature-appearing bipolar cells (arrowheads) that make no apparent contacts with axons (arrows). Scale bars: A–D, 200μm; E–F, 100 μm; G–H, 50 μm.
Supplemental Figure 2. Recurrent H–I does not trigger nonselective degeneration of all neural cell types. The panels show typical features of lesions that were analyzed at 24 h after rH-I. (A,B) Early OL progenitors (PDGFRα+) appeared reactive and showed no morphological features of degeneration. (C,D) The control external capsule (C) contained numerous O1 antibody-labeled axon sheaths and OLs. In the contralateral rH-I lesion (D), only reactive-appearing OLs with highly elaborated processes and no axon sheaths were seen. (E, F) A diffuse rH-I lesion (E) contained numerous GFAP-labeled astrocytes with hypertrophic and reactive features (F). (G, H) Staining for SMI-312 revealed numerous axons in both the control corpus callosum (G) and an atrophic region of the contralateral callosum (H). (I) Reduction in NeuN-labeled neurons at lower left in a rH-I lesion. The magnitude of neuronal loss was very similar to that seen after a single episode of H–I at P3 (see for example, Fig. 4J). (J) Neuronal loss in the rH-I lesion (I) coincided with a region of pyknotic cells (arrowheads, lower left in J) visualized by Hoechst-33324 fluorescent counterstain. Scale bars: A, 500 μm; B, 50μm; C, D, 200μm; inserts in C, D 50 μm; E, 500 μm; F, 50μm; G, H, 200μm; I, J, 500 μm.
Acknowledgments
This study supported by the NIH (National Institutes of Neurological Diseases and Stroke, KO2NS41343; 1RO1NS054044, R37NS045737, R01 NS056234) a Bugher Award from the American Heart Association and the March of Dimes Birth Defects Foundation. We are very grateful to Dr. William Stallcup for generously providing the PDGFRα antisera used in these studies.
References
- 1.Kinney H, Back S. Human oligodendroglial development: relationship to periventricular leukomalacia. Semin Pediatr Neurol. 1998;5:180–189. doi: 10.1016/s1071-9091(98)80033-8. [DOI] [PubMed] [Google Scholar]
- 2.Volpe JJ. Neurobiology of periventricular leukomalacia in the premature infant. Pediatr Res. 2001;50:553–562. doi: 10.1203/00006450-200111000-00003. [DOI] [PubMed] [Google Scholar]
- 3.Hamrick S, Miller SP, Leonard C, et al. Trends in severe brain injury and neurodevelopmental outcome in premature newborn infants: the role of cystic periventricular leukomalacia. J Pediatr. 2004;145:593–599. doi: 10.1016/j.jpeds.2004.05.042. [DOI] [PubMed] [Google Scholar]
- 4.Counsell S, Allsop J, Harrison M, et al. Diffusion-weighted imaging of the brain in preterm infants with focal and diffuse white matter abnormality. Pediatrics. 2003;112:176–180. doi: 10.1542/peds.112.1.1. [DOI] [PubMed] [Google Scholar]
- 5.Inder TE, Andersen NJ, Spencer C, et al. White matter injury in the premature infant: a comparison between serial cranial ultrasound and MRI at term. AJNR Am J Neuroradiol. 2003;24:805–809. [PMC free article] [PubMed] [Google Scholar]
- 6.Miller SP, Cozzio CC, Goldstein RB, et al. Comparing the diagnosis of white matter injury in premature newborns with serial MR imaging and transfontanel ultrasonagraphy findings. AJNR Am J Neuroradiol. 2003;24:1661–1669. [PMC free article] [PubMed] [Google Scholar]
- 7.Back SA. Perinatal white matter injury: The changing spectrum of pathology and emerging insights into pathogenetic mechanisms. MRDD Res Rev. 2006;12:129–140. doi: 10.1002/mrdd.20107. [DOI] [PubMed] [Google Scholar]
- 8.Back SA, Luo NL, Mallinson RA, et al. Selective vulnerability of preterm white matter to oxidative damage defined by F2-isoprostanes. Ann Neurol. 2005;58:108–120. doi: 10.1002/ana.20530. [DOI] [PubMed] [Google Scholar]
- 9.Haynes RL, Folkerth RD, Keefe RJ, et al. Nitrosative and oxidative injury to premyelinating oligodendrocytes in periventricular leukomalacia. J Neuropathol Exp Neurol. 2003;62:441–450. doi: 10.1093/jnen/62.5.441. [DOI] [PubMed] [Google Scholar]
- 10.Back SA, Han BH, Luo NL, et al. Selective vulnerability of late oligodendrocyte progenitors to hypoxia-ischemia. J Neurosci. 2002;22:455–463. doi: 10.1523/JNEUROSCI.22-02-00455.2002. [DOI] [PMC free article] [PubMed] [Google Scholar]
- 11.Back SA, Luo NL, Borenstein NS, et al. Late oligodendrocyte progenitors coincide with the developmental window of vulnerability for human perinatal white matter injury. J Neurosci. 2001;21:1302–1312. doi: 10.1523/JNEUROSCI.21-04-01302.2001. [DOI] [PMC free article] [PubMed] [Google Scholar]
- 12.Follet PL, Rosenberg PA, Volpe JJ, Jensen FE. NBQX attenuates excitotoxic injury to the developing white matter. J Neurosci. 2000;20:9235–9241. doi: 10.1523/JNEUROSCI.20-24-09235.2000. [DOI] [PMC free article] [PubMed] [Google Scholar]
- 13.Skoff R, Bessert D, Barks J, et al. Hypoxic-ischemic injury results in acute disruption of myelin gene expression and death of oligodendroglial precursors in neonatal mice. Int J Dev Neurosci. 2001;19:197–208. doi: 10.1016/s0736-5748(00)00075-7. [DOI] [PubMed] [Google Scholar]
- 14.Biran V, Joly L-M, Heron A, et al. Glial activation in white matter following ischemia in the neonatal P7 rat brain. Exp Neurol. 2006;199:103–112. doi: 10.1016/j.expneurol.2006.01.037. [DOI] [PubMed] [Google Scholar]
- 15.Husson I, Mesples B, Bac P, et al. Melatonergic neuroprotection of the murine periventricular white matter against neonatal excitotoxic challenge. Ann Neurol. 2002;51:82–92. doi: 10.1002/ana.10072. [DOI] [PubMed] [Google Scholar]
- 16.Olivier P, Baud O, Bouslama M, et al. Moderate growth restriction: deleterious and protective effects of white matter damage. Neurobiol Dis. 2007;26:253–263. doi: 10.1016/j.nbd.2007.01.001. [DOI] [PubMed] [Google Scholar]
- 17.Pang Y, Cai Z, Rhodes P. Disturbance of oligodendrocyte development, hypomyelination and white matter injury in the neonatal rat brain after intracerebral injection of lipopolysaccharide. Brain Res Dev Brain Res. 2003;140:205–214. doi: 10.1016/s0165-3806(02)00606-5. [DOI] [PubMed] [Google Scholar]
- 18.Craig A, Luo NL, Beardsley DJ, et al. Quantitative analysis of perinatal rodent oligodendrocyte lineage progression and its correlation with human. Exp Neurol. 2003;181:231–240. doi: 10.1016/s0014-4886(03)00032-3. [DOI] [PubMed] [Google Scholar]
- 19.Vannucci RC, Connor JR, Mauger DT, et al. Rat model of perinatal hypoxic-ischemic brain damage. J Neurosci Res. 1999;55:158–163. doi: 10.1002/(SICI)1097-4547(19990115)55:2<158::AID-JNR3>3.0.CO;2-1. [DOI] [PubMed] [Google Scholar]
- 20.Back S, Craig A, Luo N, et al. Protective effects of caffeine on chronic hypoxia-induced perinatal white matter injury. Ann Neurol. 2006;60:696–705. doi: 10.1002/ana.21008. [DOI] [PubMed] [Google Scholar]
- 21.Sherman L, Wainwright D, Ponta H, Herrlich P. A splice variant of CD44 expressed in the apical ectodermal ridge presents fibroblast growth factors to limb mesenchyme and is required for limb outgrowth. Genes Dev. 1998;12:1058–1071. doi: 10.1101/gad.12.7.1058. [DOI] [PMC free article] [PubMed] [Google Scholar]
- 22.Riddle A, Luo N, Manese M, et al. Spatial heterogeneity in oligodendrocyte lineage maturation and not cerebral blood flow predicts fetal ovine periventricular white matter injury. J Neurosci. 2006;26:3045–3055. doi: 10.1523/JNEUROSCI.5200-05.2006. [DOI] [PMC free article] [PubMed] [Google Scholar]
- 23.Hofman M. On the evolution and geometry of the brain in mammals. Prog Neurobiol. 1989;32:137–158. doi: 10.1016/0301-0082(89)90013-0. [DOI] [PubMed] [Google Scholar]
- 24.Han S, Wu Y, Tuohy T, et al. CD44 expression identifies astrocyte restricted precursor cells. Dev Biol. 2004;276:31–46. doi: 10.1016/j.ydbio.2004.08.018. [DOI] [PubMed] [Google Scholar]
- 25.Reynolds R, Hardy RJ. Oligodendroglial progenitors labeled with the O4 antibody persist in the adult rat cerebral cortex in vivo. J Neurosci Res. 1997;47:455–470. doi: 10.1002/(sici)1097-4547(19970301)47:5<455::aid-jnr1>3.0.co;2-g. [DOI] [PubMed] [Google Scholar]
- 26.Scholzen T, Gerdes J. The Ki-67 protein: from the known and the unknown. J Cell Physiol. 2000;182:311–322. doi: 10.1002/(SICI)1097-4652(200003)182:3<311::AID-JCP1>3.0.CO;2-9. [DOI] [PubMed] [Google Scholar]
- 27.Kuan C-Y, Schloemer A, Lu A, et al. Hypoxia-ischemia induces DNA synthesis without cell proliferation in dying neurons in adult rodent brain. J Neurosci. 2004;24:10763–10722. doi: 10.1523/JNEUROSCI.3883-04.2004. [DOI] [PMC free article] [PubMed] [Google Scholar]
- 28.Lin S, Rhodes P, Lei M, et al. α-Phenyl-n-tert-butyl-nitrone attenuates hypoxic-ischemic white matter injury in the neonatal rat brain. Brain Res. 2004;1007:132–141. doi: 10.1016/j.brainres.2004.01.074. [DOI] [PubMed] [Google Scholar]
- 29.McCarran W, Goldberg M. White matter axon vulnerability to AMPA/kainate receptor-mediated ischemic injury is developmentally regulated. J Neurosci. 2007;27:4220–4229. doi: 10.1523/JNEUROSCI.5542-06.2007. [DOI] [PMC free article] [PubMed] [Google Scholar]
- 30.Wolswijk G. Chronic stage multiple sclerosis lesions contain a relatively quiescent population of oligodendrocyte precursor cells. J Neurosci. 1998;18:601–609. doi: 10.1523/JNEUROSCI.18-02-00601.1998. [DOI] [PMC free article] [PubMed] [Google Scholar]
- 31.Back S, Tuohy T, Chen H, et al. Hyaluronan accumulates in demyelinated lesions and inhibits oligodendrocyte progenitor maturation. Nat Med. 2005;9:966–972. doi: 10.1038/nm1279. [DOI] [PubMed] [Google Scholar]
- 32.Sherman L, Back S. A GAG reflex prevents repair of the damaged CNS. Trends Neurosci. 2007 Nov 30; doi: 10.1016/j.tins.2007.11.001. [Epub ahead of print] [DOI] [PubMed] [Google Scholar]
- 33.Struve J, Maher P, Li Y, et al. Disruption of the hyaluronan-based extracellular matrix in spinal cord promotes astrocyte proliferation. Glia. 2005;52:16–24. doi: 10.1002/glia.20215. [DOI] [PubMed] [Google Scholar]
- 34.Nishiyama A, Yu M, Drazba J, Tuohy V. Normal and reactive NG2+ glial cells are distinct from resting and activated microglia. J Neurosci Res. 1997;48:299–312. doi: 10.1002/(sici)1097-4547(19970515)48:4<299::aid-jnr2>3.0.co;2-6. [DOI] [PubMed] [Google Scholar]
- 35.Ong J, Plane J, Parent J, Silverstein F. Hypoxic-ischemic injury stimulates subventricular zone proliferation and neurogenesis in the neonatal rat. Pediatr Res. 2005;58:600–606. doi: 10.1203/01.PDR.0000179381.86809.02. [DOI] [PubMed] [Google Scholar]
- 36.Yang Z, Levison S. Hypoxia/ischemia expands the regenerative capacity of progenitors in the perinatal subventricular zone. Neurosci. 2006;139:555–564. doi: 10.1016/j.neuroscience.2005.12.059. [DOI] [PubMed] [Google Scholar]
- 37.Casaccia-Bonnefil P, Carter B, Dobrowsky R, Chao M. Death of oligodendrocytes mediated by the interaction of nerve growth factor with its receptor p75. Nature. 1996;383:716–719. doi: 10.1038/383716a0. [DOI] [PubMed] [Google Scholar]
- 38.Han BH, Holtzman DM. BDNF protects the neonatal brain from hypoxic-ischemic injury in vivo via the ERK pathway. J Neurosci. 2000;20:5775–5781. doi: 10.1523/JNEUROSCI.20-15-05775.2000. [DOI] [PMC free article] [PubMed] [Google Scholar]
- 39.Back SA, Gan X-D, Li Y, et al. Maturation-dependent vulnerability of oligodendrocytes to oxidative stress-induced death caused by glutathione depletion. J Neurosci. 1998;18:6241–6253. doi: 10.1523/JNEUROSCI.18-16-06241.1998. [DOI] [PMC free article] [PubMed] [Google Scholar]
- 40.Baud O, Greene A, Li J, et al. Glutathione peroxidase-catalase cooperativity is required for resistance to hydrogen peroxide by mature rat oligodendrocytes. J Neurosci. 2004;24:1531–1540. doi: 10.1523/JNEUROSCI.3989-03.2004. [DOI] [PMC free article] [PubMed] [Google Scholar]
Associated Data
This section collects any data citations, data availability statements, or supplementary materials included in this article.
Supplementary Materials
Supplementary Figure 1. Failure of myelination in post-ischemic lesions at P10 despite intact-appearing axons. (A) Normal O4-labeled myelination pattern in the control hemisphere coincides with the presence of numerous intact axons in “B” labeled for neurofilament (NF) protein with SMI-312. (C) A typical post-ischemic lesion was rich in O4-labeled cells without apparent myelination of numerous axons in “D” that lacked features of axonal degeneration. (E,G) Control hemisphere: higher power details of SMI-312-labeled axons (red), O4-labeled myelinating cells (green, arrowheads) and scattered O4-labeled myelinated axons (arrows, yellow). (F,H) Post-ischemic lesion: higher power detail of intact-appearing SMI-312-labeled axons (red; arrows), O4-labeled somata (green; arrowheads). Note in “H” O4-labeled immature-appearing bipolar cells (arrowheads) that make no apparent contacts with axons (arrows). Scale bars: A–D, 200μm; E–F, 100 μm; G–H, 50 μm.
Supplemental Figure 2. Recurrent H–I does not trigger nonselective degeneration of all neural cell types. The panels show typical features of lesions that were analyzed at 24 h after rH-I. (A,B) Early OL progenitors (PDGFRα+) appeared reactive and showed no morphological features of degeneration. (C,D) The control external capsule (C) contained numerous O1 antibody-labeled axon sheaths and OLs. In the contralateral rH-I lesion (D), only reactive-appearing OLs with highly elaborated processes and no axon sheaths were seen. (E, F) A diffuse rH-I lesion (E) contained numerous GFAP-labeled astrocytes with hypertrophic and reactive features (F). (G, H) Staining for SMI-312 revealed numerous axons in both the control corpus callosum (G) and an atrophic region of the contralateral callosum (H). (I) Reduction in NeuN-labeled neurons at lower left in a rH-I lesion. The magnitude of neuronal loss was very similar to that seen after a single episode of H–I at P3 (see for example, Fig. 4J). (J) Neuronal loss in the rH-I lesion (I) coincided with a region of pyknotic cells (arrowheads, lower left in J) visualized by Hoechst-33324 fluorescent counterstain. Scale bars: A, 500 μm; B, 50μm; C, D, 200μm; inserts in C, D 50 μm; E, 500 μm; F, 50μm; G, H, 200μm; I, J, 500 μm.