Abstract
This paper describes the application of large deformation diffeomorphic metric mapping to cortical surfaces based on the shape and geometric properties of subregions of the superior temporal gyrus in the human brain. The anatomical surfaces of the cortex are represented as triangulated meshes. The diffeomorphic matching algorithm is implemented by defining a norm between the triangulated meshes, based on the algorithms of Vaillant and Glaunès. The diffeomorphic correspondence is defined as a flow of the extrinsic three dimensional coordinates containing the cortical surface that registers the initial and target geometry by minimizing the norm. The methods are demonstrated in 40 high resolution MRI cortical surfaces of planum temporale (PT) constructed from subsets of the superior temporal gyrus (STG). The effectiveness of the algorithm is demonstrated via the Euclidean positional distance, distance of normal vectors, and curvature before and after the surface matching as well as the comparison with a landmark matching algorithm. The results demonstrate that both the positional and shape variability of the anatomical configurations are being represented by the diffeomorphic maps.
Keywords: diffeomorphics, large deformation, surface matching, normal vector
1 Introduction
Diffeomorphic mapping is now being used by various investigators in the field of Computational Anatomy to study the geometric variation of human anatomy (Grenander and Miller, 1998; Gee and Bajcsy, 1999; Miller, Trouvé, and Younes, 2002; Twining, Marsland, and Taylor, 2002; Beg et al., 2005; Joshi et al., 2004; Avants and Gee, 2004). Over the past several years we have been using large deformation diffeomorphic metric mapping (LDDMM) (Joshi and Miller, 2000b; Camion and Younes, 2001; Beg et al., 2005) for studying the mapping of 3D volume coordinates in the brain as well as in the heart (Helm et al., 2006). This method not only provides a diffeomorphic correspondence between anatomical configurations, but as well defines a metric distance. In all of these cases, LDDMM constructs a flow of diffeomorphic transformations on the extrinsic 3D coordinates of the entire volume, based on a correspondence cost between measurements made in anatomical configurations. Thus far, most of our work has been either based on anatomical landmarks or the MRI image intensities for defining the correspondence function. More recently this has been extended to include multi-valued vector matching and tensor matching arising from DTI studies (Cao et al., 2005b; Cao et al., 2005a). In this paper we examine the extension of these ideas to the understanding of anatomical configurations which are cortical surfaces arising in the parcellation of the human cortex. For this, it is our goal to define registration or correspondences based on the shape of the cortical surface itself, so that the matching is performed not just on the Euclidean positions of the measured surfaces in the extrinsic volume coordinates, but as well based on normal vectors of surfaces. The basic paradigm is to represent surfaces as mathematical objects that encode normal vectors of surfaces (the first order differential geometric structure), which are elements of a vector space equipped with a computable normed distance (Vaillant and Glaunès, 2005). “Closeness” between two surfaces is then given by the norm-square distance between their associated representations. The diffeomorphic transformation is generated on the coordinate system minimizing the norm-squared distance between the mapped surface and the template. The theoretical development of the approach can be found in (Vaillant and Glaunès, 2005). We demonstrate the application of this method in the human cortex on the superior temporal gyrus. We term this method as LDDMM-surface. This method provides powerful information into the matching procedure for correspondence that should be defined by the normal vectors of the cortical surfaces themselves.
Compared to the spherical brain mapping approaches (Fischl et al., 1999; Van Essen and Drury, 1997; Van Essen et al., 2001; Tosun, Rettmann, and Prince, 2004; Van Essen, 2004; Tosun et al., 2004; Thompson et al., 2004; Van Essen, 2005), our approach does not require an intermediate spherical representation of the brain. This intermediate step would introduce large distortion of the brain structure, which does not appear consistently across subjects. As a consequence, matchings would begin with such a distortion error. However, our approach directly works on cortical surfaces and does not require surfaces with correct topology. Furthermore, our matching approach can map two open surfaces from one to the other and the boundaries of two surfaces need not match if the geometries near the boundary are quite different from one another. This is particularly attractive because it allows us to study more local variation of anatomies due to effects of diseases in cortical substructures.
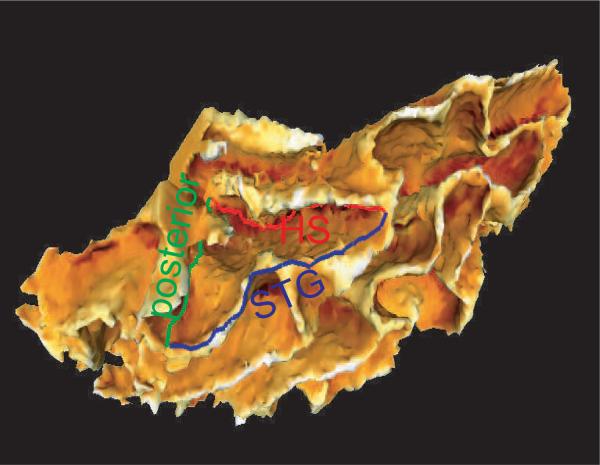
In this paper, we use the planum temporale (PT) to validate our LDDMM-surface matching approach in a population of twenty healthy subjects. Located on the superior temporal plane posterior to the Heschls gyrus (HG) and extending to the posterior ramus, PT is believed to be responsible for speech and language processing (Harasty et al., 2003; Seldon, 2005; Beasley et al., 2005). As an example, shown in Figure 1 is the definition of the PT in the superior temporal gyrus. Building deformation maps on the cortical surface that extrinsically associate corresponding cortical regions across subjects becomes a crucial step in study and comparison on the laminar structure and function of PT across clinical populations to understand the characteristics and symptoms of neurodegenerative diseases and neuropsychiatric disorders, e.g. schizophrenia, bipolar, central auditory processing deficits (Hirayasu et al., 2000; Kasai et al., 2003; Chance et al., 2004; Beasley et al., 2005).
FIG. 1.
The left superior temporal gyrus (STG). The planum temporale (PT) structure is defined by three boundaries – STG (blue line), Heschl's sulcus (red line, HS), and posterior boundary (green line) on the top of STG.
2 LDDMM-Surface
2.1 LDDMM
Exact Matching Formulation
The basic diffeomorphic metric mapping approach taken for understanding the structure of anatomical shapes is to place the set of anatomical shapes into a metric space. This is modeled by assuming that the shapes can be generated one from the other via a flow of diffeomorphisms, solutions of ordinary differential equations with ϕ0 = id the identity map, and associated vector fields vt, t ∈ [0, 1]. We compute pairs S, T, such that there exists a diffeomorphism ϕ transforming one to the other ϕ · S = T. The metric distance between shapes is the length of the geodesic curves ϕt · S, t ∈ [0, 1] through the shape space generated from S connecting to T in the sense that ϕ1 · S = T. These curves ϕt · S, t ∈ [0, 1] are generalizations of simple finite dimensional curves. The metric between two shape S, T takes the form
| (1) |
where vt ∈ V, a smooth Hilbert space with norm ∥ · ∥V. To ensure that the solutions to this equation are diffeomorphisms, V must be a space of smooth vector fields (see (Trouvé, 1995; Dupuis, Grenander, and Miller, 1998) for specific requirements).
Inexact Matching Formulation
In practice the metric ρ and the diffeomorphic correspondence ϕ = ϕ1 between the pair (S, T) is calculated via a variational formulation of the “inexact matching problem”. Associate for each pair (S, T), a norm-squared cost D(S, T); then the variational problem requires minimization of the functional
| (2) |
General results in (Trouvé, 1995; Dupuis, Grenander, and Miller, 1998; Glaunès, 2005) guarantee existence and uniqueness of the solution to this minimization problem. Joshi (Joshi and Miller, 2000a) and Glaunès (Glaunès, Trouvé, and Younes, 2004) have defined such a variational problem for matching isolated landmark points, Beg (Beg et al., 2005) for dense scalar imagery. More recently Cao (Cao et al., 2005b; Cao et al., 2005a) has defined such a solution for diffusion tensor images.
2.2 Triangulate Surface Mesh Norm
Assume the anatomical configurations are subcortical surfaces in the brain, represented via triangulated meshes. Then for any pair S, T, what is required is the definition of the norm-squared registration distance D between surfaces. We represent these surfaces explicitly as triangular meshes in . Given a face f of S, let f1, f2, f3 denote its vertices, e1 = f2 − f3, e2 = f3 − f1, e3 = f1 − f2 its oriented edges, c(f) = ⅓ (f1 + f2 + f3) its center, and N(f) = ½(e3 × e2) which is its normal vector with length equal to its area (see Figure. 2).
FIG. 2.
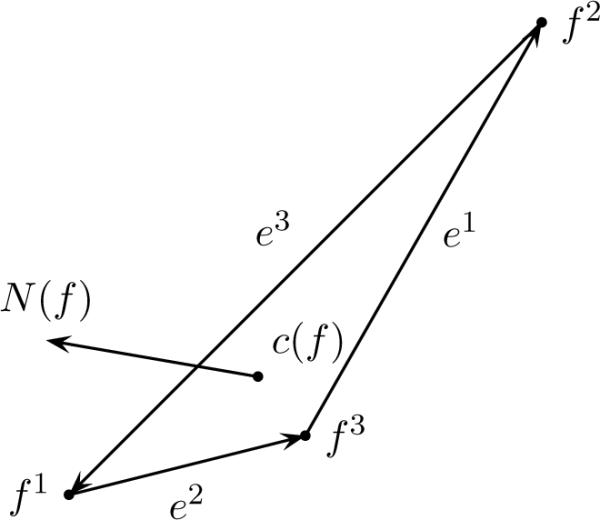
Example face representation from a triangular mesh.
Now let f, g represent the faces of S and q, r represent the faces of T. We impose an inner product structure on these representations which induces a norm-square which we write D(S, T). The matching criterion given by the norm-square becomes
| (3) |
where t is transpose. kW is a radial, positive definite 3 × 3 diagonal matrix kernel function such as
The terms in (3) integrate measures of local geometry for each face via inner products of its normal with normals of neighboring faces. The choice of kernel function, kW, together with its parameters controls the local neighborhoods used in the calculations. The first and last terms measure the local geometry within S and T, and the middle term measures the mismatch in local geometry between S and T. The detailed theoretical derivation of above approach for the continuum surface is in references (Glaunès, 2005; Vaillant and Glaunès, 2005).
2.3 The Algorithm
We write x1, …, xN for the vertices of the mesh S and define the trajectories xi(t) := ϕt(xi) for i = 1, …, N. Note that ϕ1(S) is approximated by applying ϕ1 to the vertices of S. I.e. ϕ1(S) is simply the mesh defined by the vertices xi(1) for all i = 1, …, N, and faces f(1) of S. Since the matching term of (2) depends only on the vertices of the mesh through (3), a general result for diffeomorphic matching problems (Joshi and Miller, 2000b; ?) shows that the solution must be of the form
| (4) |
where α is named as momentum vector because of its analogy with fluid mechanics (Arnold, 1989).
Defining fi(t) = ϕt(fi) for i = 1, 2, 3, the cost function in (2) becomes
The Frechet derivative of J in the space V is given for variations vt + εht. We find ▽Jt for t = [0, 1] satisfying . The gradient (Vaillant and Glaunés, 2005) becomes
together with the identities vt given by Eqn. 4 and
| (5) |
| (6) |
where × denotes the cross product, and a(h) = 1 if h a face of ϕ1(S) and a(h) = −1 if h is a face of T. We can then use this gradient in a descent algorithm to find a minimum solution to (2). The algorithm we have implemented is a simple adaptive step size steepest descent algorithm as outlined below:
Algorithm.
Discretize time into T time steps t = 0,…, T − 1 and initialize xi(t) = xi and αi(t) = 0 for t = 0,…,T − 1.
- Iterate until convergence:
- (a)
-
(b)Set αi(t)new = αi(t) − 2 * ε(αi(t) + βi(t)/σ2), where ε is the descent step size.
-
(c)Compute the new trajectories, xi(t)new, by integrating
-
(d)Compute J(xnew) and while J(xnew) < J(xold) decrease the step size ε and return to 2b.
-
(e)Set α(t) = αnew(t) and x(t) = x(t)new, and increase step size ε.
The stopping criterion for convergence is given by a tolerance on the cost difference between successive iterations.
3 Results
3.1 Subjects, MRI Acquisition, and Data Processing
Twenty healthy subjects, aged from 20 to 54 (mean: 36.5; standard deviation: 11.2), were selected from schizophrenia and bipolar disorder studies of Dr. Patrick Barta in the Division of Psychiatric Neuroimaging at the Johns Hopkins University School of Medicine. There were 10 males and 10 females among these healthy subjects. All subjects gave informed consent for their participation after the risks and benefits of participation were explained to them prior to MRI scanning. The population was examined with high-resolution magnetic resonance (MR) scans acquired using 1.5 T scanner and MPRAGE sequence (repetition time = 13.40 ms, echo time = 4.6 ms, flip angle = 20°, number of acquisition = 1, matrix 256 × 256) with 1 mm3 isotropic resolution across the entire cranium. Using ANALYZE (Robb et al., 1989), raw MR data were reformatted from signed 16-bit to unsigned 8-bit. A 3D region of interest (ROI) subvolume encompassing the superior temporal gyrus (STG) was masked for each of the two hemispheres in each subject (Ratnanather et al., 2003). Bayesian segmentation was performed labeling voxels in the subvolume as gray matter (GM), white matter (WM), or cerebrospinal fluid (CSF) (Joshi et al., 1999; Ratnanather et al., 2001; Ratnanather et al., 2004). Surfaces were generated at the GM/WM interface using a topology-correction method and a connectivity-consistent isosurface algorithm applied to a binarized subvolume of white matter to remove all cavities in the WM object (Han et al., 2002). The connectivity-consistent isosurface algorithm is used to extract the isosurface of the edited image to guarantee that the extracted isosurface has the same topology as the object surface in the binarized image (Han et al., 2001). As demonstrated in Figure 1, the boundary of the planum temporale (PT) was delineated by tracking principal curves from the retro-insular end of the Heschl's Sulcus (HS) to STG, along the posterior STG up to the start of the ramus and back to the retro-insular end of the HS via dynamic programming (Ratnanather et al., 2003). Three landmarks on each surface (intersections between STG and HS, between STG and ramus, between ramus and HS) were manually defined in this procedure and formed the triangulated shape of PT. Each PT surface was represented by a triangulated mesh with approximately 1000 vertices.
The left and right PT surfaces of one subject were selected as left and right templates in such a way that their surface areas are close to average left and right PT surface areas among the population and the surfaces have a typical triangular PT shape. Affine transformation was estimated by the previously described three landmarks to bring PT surfaces to the same orientation as the template. Then, the surface matching algorithm was used to register all PTs onto the template. In our matching algorithm, we assumed kernels kV and kW are Gaussian with variance and . determines the smoothness of vector fields vt and controls how close the target surface is to the template. Small causes unsmooth deformation field and large leads that the deformed surface is far from the template. We experimentally determined and in this study.
3.2 Examples
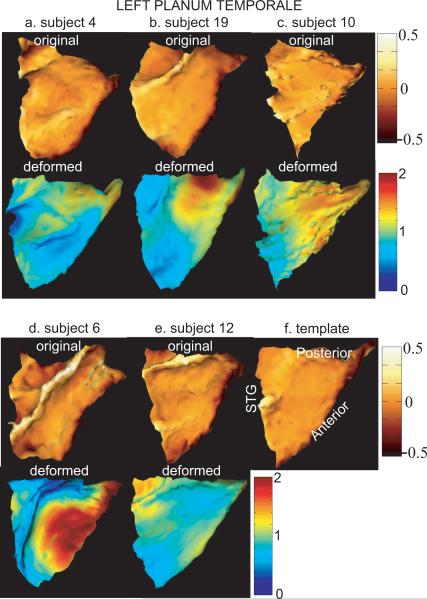
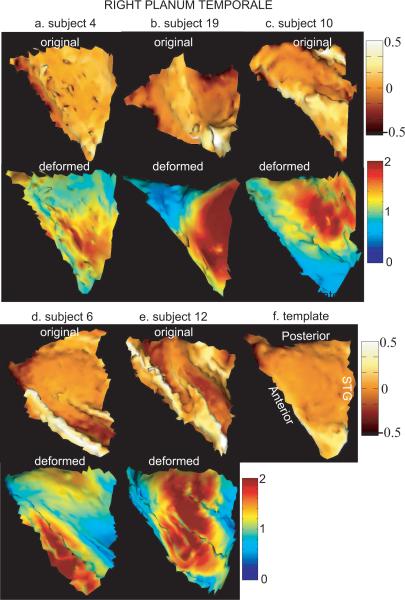
Figures 3 and 4 show results for left and right PTs from the surface matching algorithm, respectively. Panels (a)–(e) of each figure give five examples of original (top row) and deformed PTs (bottom row). Left and right templates are respectively shown in panels (f) of Figures 3 and 4. The top row in each panel shows an original surface color encoded by the mean curvature information for the purpose of visualization. Bright color denotes gyral regions while dark color denotes sulcal regions. The bottom row in each panel shows the deformed surface that is colored by the deformation measurement in the direction of the tangent plane at each location of the surface. This deformation information is quantified by ratio of the area on the deformed surface to the area on the original surface at local coordinate of the cortical surface. Red color denotes stretched regions, while blue color denotes shrunken regions in terms of surface area. In these two figures, all surfaces are in the same orientation as the template surfaces.
FIG. 3.
The top and bottom rows in panels (a)–(e) illustrate left original and deformed PTs. The template surface is shown in panel (f). The original surface is colored by curvature information for the purpose of visualization. The deformed surface is colored by the area deformation. Red and blue respectively denote the stretched and shrunken regions after matching.
FIG. 4.
The top and bottom rows in panels (a)–(e) illustrate right original and deformed PTs. The template surface is shown in panel (f). The original surface is colored by curvature information for the purpose of visualization. The deformed surface is colored by the area deformation. Red and blue respectively denote the stretched and shrunken regions after matching.
The comparison of original surfaces in Figures 3 and 4 indicates that all left or right PT surfaces are in close agreement with the global triangulated shape and three boundary curves. However, these surfaces are variant in details across subjects. For instance, Figure 3(d) shows the original surface with a gyral structure in the interior region. Both Figure 4(c) and Figure 4(e) shows the original surfaces with wavy interior. Moreover, the anterior region of the surfaces in Figure 4(d) and Figure 4(e) have a gyral structure, which is different from that of the other surfaces shown in the top row of Figure 4. These two surfaces are on the STG with double-Heschl's gyrus and the anterior boundary is defined in the first Heschl's sulcus based on cytoarchitectonic structure of the auditory cortex. All others are on the STG with single-Heschl's gyrus and the anterior boundary is defined in the Heschl's sulcus.
The deformed surfaces that are shown in the bottom row of each panel in Figure 3 and Figure 4 suggest that the shape of the deformed surfaces are close to the shape of the template. The color on the surface tells how the original surface moves to the deformed surface. Since the template is relatively flat in the interior, for the case in Figure 3(d), a large portion of the gyral region in the interior becomes similar to the shape of the template after matching. However, we still observe a small bump. For the cases of Figure 4(c) and Figure 4(e), the wavy interior becomes flat after the deformation. For the cases of double-Heschl's gyrus, the algorithm cannot remove this variation since the correspondence between the template and the surfaces (shown in Figure 4(d) and Figure 4(e)) in the Heschl's gyral region is not well defined in terms of the vertex location and the normal vector that are carried by the algorithm.
3.3 Euclidean Position Validation
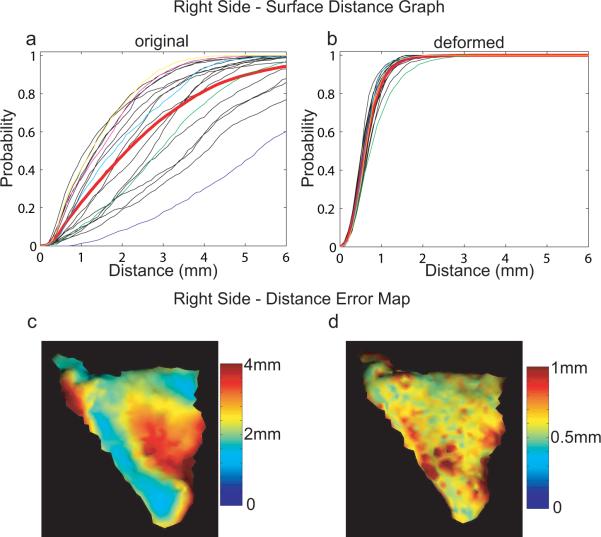
We calculate the cumulative distribution of distances between the deformed targets and the template to quantify their closeness. We call this as surface distance graph from T to S, defined as the percentage of vertices on a template surface T having the distance to a surface S less than d mm. Let vsi and vti respectively be vertices on surfaces S and T. The distance of vti to S is defined by:
| (7) |
where ∥·∥ is the Euclidean distance in R3. The surface distance graph is the cumulative distribution of dti. The visualization of dti on surface T is named as distance error map.
Comparison with and without LDDMM-surface
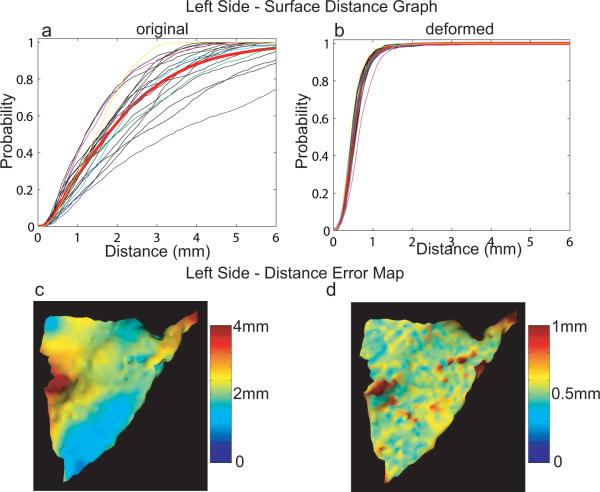
Panel (a) of Figure 5 shows the surface distance graphs of the original left PTs after the affine registration. The red curve is the average graph among the left PTs. The average median of distances is 1.92mm in the population. Blue, green, cyan, magenta, and yellow curves denote the graphs in the order given as one of surfaces shown in Figure 3 (a)–(e). The intuitive illustration of where left PT surfaces are far apart from the left template is demonstrated by a distance error map on the left template surface colored by average distance of PT surfaces to each vertex of the template in panel (c). Obviously, the three corners are closer to the template than other places due to affine transformation constrained to these corners. Similarly, the surface distance graphs of the deformed left PTs are shown in panel (b) and the distance error map is demonstrated in panel (d). Clearly, after the matching, the average median of distances is reduced to 0.55mm within the voxel resolution 1mm and the variation among the graphs is significantly decreased. The worst matched surface among the population in terms of this distance validation is shown in Figure 3(d) and the distance graphs before and after matching are illustrated by magenta curves in panels (a) and (b) of Figure 5, respectively. However, even for this case, 82.4% of vertices on the template have the distance within the voxel resolution 1mm.
FIG. 5.
Distance validation on the left planum temporale. Panels (a, b) show surface distance graphs of left original and deformed PTs, respectively. Mean graphs among the population are marked as red in each panel. Blue, green, cyan, magenta, and yellow curves indicate the surface distance graphs associated with surfaces shown in Figure 3 (a)–(e), respectively. Panels (c, d) intuitively demonstrate where the original and deformed surfaces are far from the template surface, respectively.
In parallel, the results of the surface distance graphs and distance error maps for the right PTs are illustrated in Figure 6. The average medians of distances are 2.40mm and 0.65mm for the original and deformed right PTs, respectively. The worst matched surface among the population in terms of this distance validation is shown in panel (b) of Figure 4. However, even for this case, after matching about 80% of vertices on the template are close to the deformed surface within the MRI resolution 1mm. Notice that the variation in right PTs is larger than that in left PTs for both original and deformed cases. This may be due to the fact that right PT structure is more complicated than the left PT shape as reported in literature (Barta et al., 1995). For example, the double-Heschl's cases, our matching algorithm cannot remove this structure to match the template. But the remained structure of the PT surface can be matched into the proper position of the template based on the similarity of their normal vectors.
FIG. 6.
Distance validation on the right planum temporale. Panels (a, b) show surface distance graphs of right original and deformed PTs, respectively. Mean graphs among the population are marked as red in each panel. Blue, green, cyan, magenta, and yellow curves indicate the surface distance graphs associated with surfaces shown in Figure 4 (a)–(e), respectively. Panels (c, d) intuitively demonstrate where the original and deformed surfaces are far from the template surface, respectively.
Comparison of LDDMM-Surface and Landmark Matchings
The purpose of this section is to compare the LDDMM-surface matching algorithm with a widely-used landmark matching algorithm using surface distance graph. The landmark matching algorithm we used in this paper is also under the LDDMM framework and is described in reference (Joshi and Miller, 2000b).
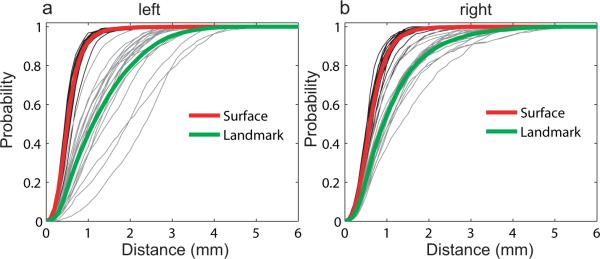
As we describe in Section 3.1, three corner points and three boundary curves of the PT are defined as point and curve landmarks across the population. Five points equally spaced on each boundary and the three corner points were chosen as point landmarks on each PT surface. Then, the landmark matching algorithm (Joshi and Miller, 2000b) is applied to PTs to obtain the deformation field that is used to deform PT surfaces to the template. Distance surface graphs between deformed and template surfaces were computed and are shown in gray in Figure 7(a,b). The average graphs over the population are shown in green in each panel for left and right PTs, respectively. For the comparison, we replot surface distance graphs (shown in Figure 5(b) and 6(b)) in each panel of Figure 7 for the left and right PTs, respectively. These two panels suggest that all surface distance graphs from the surface matching algorithm is above those from the landmark matching algorithm, which implies that the surface matching algorithm introduced in this paper significantly improve matching results from the landmark matching in terms of surface distance measurement. Moreover, compared to the landmark matching, the surface matching algorithm gives the smaller variation of surface distance graphs, which also indicates that the surface matching algorithm properly carries anatomical variation cross the population so that it may increase the power of statistical testing on shape, cortical thickness, curvature, and functional responses in clinical studies.
FIG. 7.
Panels (a, b) show surface distance graphs of left and right PTs, respectively. Surface distance graphs for the surface matching are in black and their average graphs are marked as red in each panel. Similarly, for the landmark matching, distance graphs are in gray and average graphs are marked as green in each panel.
3.4 Geometric Validation
To evaluate the geometric closeness between two surfaces, we compute two quantities: distance of normal vectors (the first-order differential geometric information) given in (3) and mean curvature (the second-order differential geometric information).
Distance of Normal Vectors
The distance of normal vectors between two surfaces is given in (3). It integrates the local first-order geometry for each face via inner products of its normal with normals of neighboring faces. The large value indicates the two surfaces are not close in terms of their normals, while the small value suggests that the normals of the two surfaces are nearly in the same direction and also have the similar length.
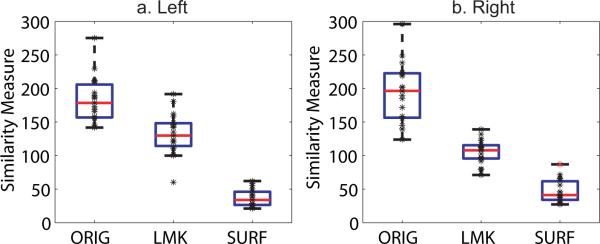
Figure 8 shows the boxplots of this measure for left and right PTs. In each panel, we show the distance of normal vectors of all other 19 PT surfaces relative to the template before matching, after the landmark matching (Joshi and Miller, 2000b), and after the surface matching. The labels on the x-axis respectively represent the results corresponding to surfaces before matching, after the landmark matching, and after the surface matching. Each asterisk represents the measurement for one PT surface. The boxes have lines at the lower quartile, median, and upper quartile values. The whiskers are lines extending from each end of the boxes to show the extent of the rest of the data. The results shown in the figure suggest that the deformed surfaces from the surface matching are much closer to the template, compared to the original surfaces and deformed surfaces from the landmark matching. The standard deviation of the distance indicates the variation of PT surfaces in terms of normal vectors. For the left PTs, they are 33.88, 30.41, and 12.81 respectively for original surfaces, landmark deformed surfaces, and deformed surfaces from the surface matching. For the right PTs, they are 44.17, 17.96, and 17.10 respectively for original surfaces, landmark deformed surfaces, and deformed surfaces from the surface matching. These results suggest that the variation of PT surfaces after the surface matching is less than that of the originals or the landmark deformed surfaces. However, the standard deviation of the distance for the right PTs from the surface matching is close to the one from the landmark matching. This is due to one measurement marked by red asterisk in Figure 8(b), which corresponds to the surface with double-Heschl's gyrus shown in Figure 4(e). Compared to that of the left PTs, the standard deviation of the right PTs before and after the surface matching indicates larger variation in the population, which agree with the euclidean position validation shown in Figures 5 and 6.
FIG. 8.
Panels (a, b) show the boxplots of the similarity measures given in (3). The measure quantifies the closeness of other 19 surfaces relative to the template surface. In each panel, from left box to right box respectively show the measurements for original surfaces, surfaces after landmark matching, surfaces after the surface matching. “ORIG”, “LMK”, and “SURF” respectively denote original, landmark matching, surface matching. In panel (b), one outlier in the surface matching is marked as red asterisk.
Mean Curvature
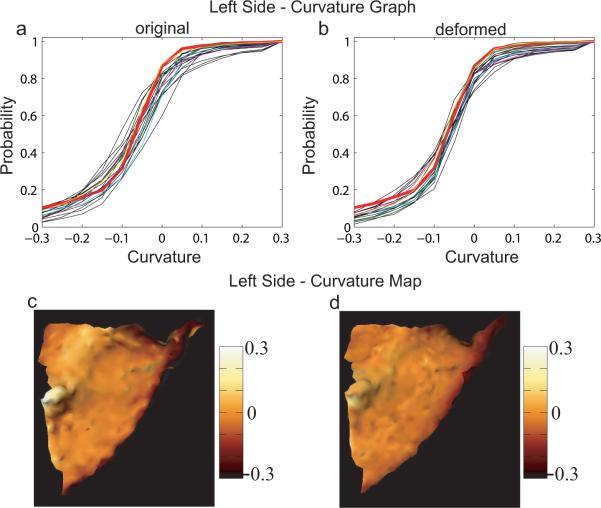
To validate the shapes of the surfaces we use the mean curvature to quantify the second-order differential geometry of the cortical surface. On a triangulated mesh, the local coordinate chart of the cortical surface is fitted by the second order in the Taylor series expansion. The coefficients of the second-order terms construct the shape operator. Its trace of the shape operator at a vertex v ε S determines twice of the mean curvature at v. The estimate of the shape operator, the symmetric 2 × 2 matrix, at each v ε S is based on the neighborhood Nv of the vertex v by minimizing mean squared error (see details in (Joshi et al., 1995; Hamann, 1993)). We use its cumulative distribution to represent the percentage of vertices having mean curvature less than a certain number k, called curvature graph. The representation of mean curvature on the surface is named as curvature map.
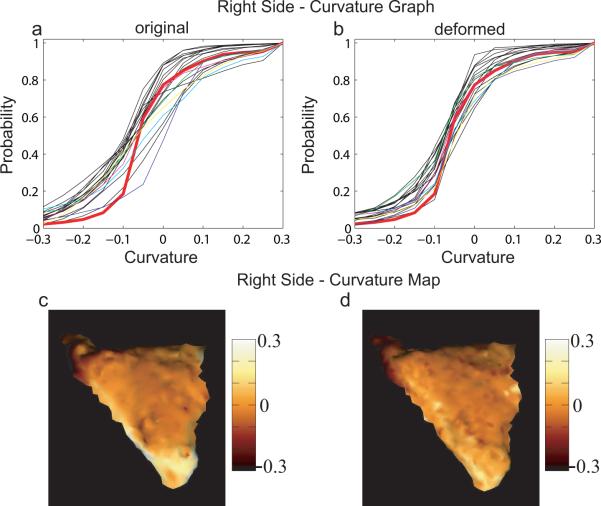
To validate how close the shape of deformed surfaces are to that of the template, mean curvature was computed locally on each PT surfaces (Joshi et al., 1995; Hamann, 1993). Panels (a) and (b) in Figure 9 respectively show curvature graphs for original and deformed left PT surfaces. The curvature graph and map of the left template are given by the red curves in panels (a, b) and (c). The average of curvature maps among matched left PTs is shown in panels (d). Parallelly, panels (a) and (b) in Figure 10 respectively show the curvature graphs of original and deformed right PT surfaces. The curvature graph and map of the right template are given by the red curves in panels (a, b) and (c). The average of curvature maps among deformed right PTs is shown in panels (d). Blue, green, cyan, magenta, and yellow curves denote the distributions associated with surfaces shown in panels (a–e) of Figure 4. In panel (b) of Figures 9 and 10 the curvature graphs are pushed to get close to the red one after matching. And the same phenomena as we see in the previous section is that the variation in the right PT is larger than the one in the left PT for both original and deformed surfaces.
FIG. 9.
Curvature validation on the left planum temporale. Panel (a, b) show curvature graphs for left original and deformed PTs. The curvature map for the left template is marked as red in each panel. Blue, green, cyan, magenta, and yellow curves indicate the curvature graphs associated with surfaces shown in Figure 3 (a)–(e), respectively. The curvature map of the left template is shown in panel (c), while the average of curvature maps among deformed surfaces is in panel (d).
FIG. 10.
Curvature validation on the right planum temporale. Panel (a, b) show curvature graphs for right original and deformed PTs. The curvature map for the right template is marked as red in each panel. Blue, green, cyan, magenta, and yellow curves indicate the curvature graphs associated with surfaces shown in Figure 4 (a)–(e), respectively. The curvature map of the right template is shown in panel (c), while the average of curvature maps among deformed surfaces is in panel (d).
4 Discussion and Conclusion
Our group has been developing large deformation diffeomorphic metric mapping (LDDMM) methods for studying the mapping of coordinates in the brain. The previous work have focused on mapping landmarks (Joshi and Miller, 2000b) or dense images (Beg et al., 2005) and these mapping methods have been used to study hippocampal shapes. However, this paper we present is the first of its kind studying matching methods for mapping cortical surfaces (the boundary between white matter and gray matter). The cortical surface is a geometric object different from landmarks or dense images. It is represented by both its coordinates and normal vectors. The focus of the surface matching approach is to introduce a matching functional that incorporates the geometric information (normal vector) of the cortical surface. We present validation results for the diffeomorphic surface matching approach initially introduced (Vaillant and Glaunès, 2005). The results from both Euclidean and geometric quantitative evaluations as well as the comparison with the landmark matching show that the LDDMM-surface matching algorithm gives good matching fidelity. In the Euclidean positional validation, after the surface matching, about 90% of vertices on the template have distances to all other PTs less than the MRI resolution 1mm in both left and right sides. This is also illustrated on distance error maps on panels (d) of Figures 5 and 6. Moveover, the distance of normal vectors and the mean curvature provide the validation of local shape based on the first and second-order differential geometry of the cortical surface. Furthermore, compared with the landmark matching algorithm, the diffeomorphic maps from the LDDMM-surface matching algorithm carries more of the variability of the anatomical structures. As a limitation of all brain warping techniques, our algorithm also faces the difficulty: the correspondence for many anatomical structures is not well defined, as we described in Section 3.2. If such a case happens, our algorithm matches the structure into the proper place of the template based on normal vectors between the surface and template.
Our surface matching approach overcomes several issues occurring in surface-based matching approaches based on landmarks. A clear issue in using landmarks is that manually labeling landmarks is labor-intensive. Moreover, due to discretization, one point on one surface may not have a homologous point on the other surface. Furthermore, the geometry information is discarded when reducing surfaces, inherently 2D objects, to 0-dimensional point sets. Of course, the tradeo of our approach is the computational time since the algorithm does not require predefined correspondence and exhaustly searches the best match. However, we have optimized the code using tree structures so that the algorithm can be applied to large surfaces as well.
The surface matching method along with its quantitative evaluation on PT cortical surfaces indicates the ability to accurately match cortical surfaces (substructure of the brain) so that it will be powerful to detect any changes in anatomical and functional profiles, such as cortical thickness maps, functional activation maps, and curvature maps, in different populations. From the benefit of the accurate surface matching, the inference of mismatching to statistical analysis will be significantly reduced so that we will be able to clarify ambiguity of regions identified as regions with significant structure or function changes. Moreover, an immediate application of the diffeomorphic matching of our surface matching approach is in statistical inference of shape via the momentum representation of flow (Vaillant et al., 2004). The reference (Miller, Trouvé, and Younes, 2006) has shown that the image under the flow φt is completely determined by the momentum (α) at time t = 0. Therefore, the momenta encode the non-linear transformation from one structure onto another and are in a linear space which leads the shape analysis to linear statistical analysis.
Acknowledgements
The work reported here was supported by grants: NIH R01 MH 064838, NIH R01 EB00975, NIH P41 RR15241, and NSF DMS 0456253. The authors would like to thank Dr. J. Tilak Ratnanather and Dr. Barta for providing data and consulting the planum temporale structure, Dr. Younes for reviewing the draft.
Footnotes
Publisher's Disclaimer: This is a PDF file of an unedited manuscript that has been accepted for publication. As a service to our customers we are providing this early version of the manuscript. The manuscript will undergo copyediting, typesetting, and review of the resulting proof before it is published in its final citable form. Please note that during the production process errors may be discovered which could affect the content, and all legal disclaimers that apply to the journal pertain.
References
- Arnold VI. Mathematical methods of Classical Mechanics. second ed. 1989. [Google Scholar]
- Avants B, Gee JC. Geodesic estimation for large deformation anatomical shape and intensity averaging. NeuroImage. 2004;23:139–150. doi: 10.1016/j.neuroimage.2004.07.010. [DOI] [PubMed] [Google Scholar]
- Barta P, Petty R, McGilchrist I, Lewis RW, Jerram M, Casanova MF, Powers RE, Brill LB, Pearlson GD. Asymmetry of the planum temporale: methodological considerations and clinical associations. Psychiatry Research Neuroimaging. 1995;61:137–150. doi: 10.1016/0925-4927(95)02650-m. [DOI] [PubMed] [Google Scholar]
- Beasley CL, Chana G, Honavar M, Landau S, Everall IP, Cotter D. Evidence for altered neuronal organisation within the planum temporale in major psychiatric disorders. Schizophr Res. 2005;73:69–78. doi: 10.1016/j.schres.2004.08.011. [DOI] [PubMed] [Google Scholar]
- Beg MF, Miller MI, Trouvé A, Younes L. Computing large deformation metric mappings via geodesic flows of diffeomorphisms. International Journal of Computer Vision. 2005;61:139–157. [Google Scholar]
- Camion V, Younes L. Geodesic interpolating splines. In: Figueiredo M, Zerubia J, JainA K, editors. EMMCVPR 2001. Vol. 2134 of Lecture notes in computer sciences 2001. [Google Scholar]
- Cao Y, Miller M, Winslow R, Younes L. Large deformation diffeomorphic metric mapping of vector fields. IEEE Trans. Med. Imag. 2005;24:1216–1230. doi: 10.1109/tmi.2005.853923. [DOI] [PubMed] [Google Scholar]
- Cao Y, Miller MI, Winslow RL, Younes L. Large deformation diffeomorphic metric mapping of fiber orientations. ICCV. 2005;2:1379–1386. doi: 10.1109/tmi.2005.853923. [DOI] [PubMed] [Google Scholar]
- Chance SA, Tzotzoli PM, Vitelli A, Esiri MM, Crow TJ. The cytoarchitecture of sulcal folding in Heschl's sulcus and the temporal cortex in the normal brain and schizophrenia: lamina thickness and cell density. Neurosci Lett. 2004;367:384–388. doi: 10.1016/j.neulet.2004.06.041. [DOI] [PubMed] [Google Scholar]
- Dupuis P, Grenander U, Miller MI. Variational problems on flows of diffeomorphisms for image matching. Quaterly of Applied Math. 1998;56:587–600. [Google Scholar]
- Fischl B, Sereno MI, Tootell RB, Dale AM. High-resolution intersubject averaging and a coordinate system for the cortical surface. Human Brain Mapping. 1999;8:272–284. doi: 10.1002/(SICI)1097-0193(1999)8:4<272::AID-HBM10>3.0.CO;2-4. [DOI] [PMC free article] [PubMed] [Google Scholar]
- Gee JC, Bajcsy RK. Elastic matching: Continuum mechanical and probabilistic analysis. In: Toga AW, editor. Brain Warping. Academic Press; San Diego: 1999. pp. 183–196. [Google Scholar]
- Glaunès J. Ph.D. thesis. Université Paris; 2005. Transport par difféomorphismes de points, de mesures et de courants pour la comparaison de formes etl l'anatomie numérique; p. 13. [Google Scholar]
- Glaunès J, Trouvé A, Younes L. Diffeomorphic matching of distributions: A new approach for unlabelled point-sets and sub-manifolds matching. 2004:712–718. [Google Scholar]
- Grenander U, Miller MI. Computational anatomy: An emerging discipline. Quart. App. Math. 1998;LVI:617–694. [Google Scholar]
- Hamann B. Curvature approximation for triangulated surfaces. Computing Supplement. 1993;8:139–153. [Google Scholar]
- Han X, Xu C, Braga-Neto U, Prince J. Topology correction in brain cortex segmentation using a multiscale, graph-based algorithm. IEEE Trans. Med. Imag. 2002;21:109–121. doi: 10.1109/42.993130. [DOI] [PubMed] [Google Scholar]
- Han X, Xu C, Tosun D, Prince JL. Cortical surface reconstruction using a topology preserving geometric deformable model. Workshop on Mathematical Methods in Biomedical Image Analysis; Kauai Hawaii. 2001. pp. 213–220. [Google Scholar]
- Harasty J, Seldon HL, Chan P, Halliday G, Harding A. The left human speech-processing cortex is thinner but longer than the right. Laterality. 2003;8:247–260. doi: 10.1080/13576500244000175. [DOI] [PubMed] [Google Scholar]
- Helm PA, Younes L, Beg MF, Ennis DB, Leclercq C, Faris OP, McVeigh E, Kass D, Miller MI, Winslow RL. Evidence of structural remodeling in the dyssynchronous failing heart. Circ. Res. 2006;98:125–132. doi: 10.1161/01.RES.0000199396.30688.eb. [DOI] [PubMed] [Google Scholar]
- Hirayasu Y, McCarley RW, Salisbury DF, Tanaka S, Kwon JS, Frumin M, Snyderman D, Yurgelun-Todd D, Kikinis R, Jolesz FA, Shenton ME. Planum temporale and heschl gyrus volume reduction in schizophrenia: a magnetic resonance imaging study of first-episode patients. Arch Gen Psychiatry. 2000;57:692–699. doi: 10.1001/archpsyc.57.7.692. [DOI] [PMC free article] [PubMed] [Google Scholar]
- Joshi M, Cui J, Doolittle K, Joshi S, Van Essen D, Wang L, Miller MI. Brain segmentation and the generation of cortical surfaces. NeuroImage. 1999;9:461–476. doi: 10.1006/nimg.1999.0428. [DOI] [PubMed] [Google Scholar]
- Joshi S, Miller MI. Landmark matching via large deformation diffeomorphisms. IEEE Trans. Image Processing. 2000;9:1357–1370. doi: 10.1109/83.855431. [DOI] [PubMed] [Google Scholar]
- Joshi SC, Davis B, Jomier M, Gerig G. Unbiased diffeomorphic atlas construction for computational anatomy. NeuroImage. 2004;23:151–160. doi: 10.1016/j.neuroimage.2004.07.068. [DOI] [PubMed] [Google Scholar]
- Joshi SC, Miller MI. Landmark matching via large deformation diffeomorphisms. IEEE Trans. Image Processing. 2000;9:1357–1370. doi: 10.1109/83.855431. [DOI] [PubMed] [Google Scholar]
- Joshi SC, Wang J, Miller MI, VanEssen DC, Grenander U. Differential geometry of the cortical surface. In: Melter RA, Wu A, Bookstein F, Green W, editors. Vision Geometry IV. Vol. 2573. SPIE; Bellingham, WA: 1995. pp. 304–311. [Google Scholar]
- Kasai K, Shenton ME, Salisbury DF, Hirayasu Y, Onitsuka T, Spencer MH, Yurgelun-Todd DA, Kikinis R, Jolesz FA, McCarley RW. Progressive decrease of left Heschl Gyrus and Planum Temporale gray matter volume in first-episode schizophrenia: a longitudinal magnetic resonance imaging study. Arch Gen Psychiatry. 2003;60:766–775. doi: 10.1001/archpsyc.60.8.766. [DOI] [PMC free article] [PubMed] [Google Scholar]
- Miller MI, Trouvé A, Younes L. On the metrics and Euler-Lagrange equations of computational anatomy. Annual Review of Biomedical Engineering. 2002;4:375–405. doi: 10.1146/annurev.bioeng.4.092101.125733. [DOI] [PubMed] [Google Scholar]
- Miller MI, Trouvé A, Younes L. Geodesic shooting for computational anatomy. J. Mathematical Imaging and Vision. 2006;24:209–228. doi: 10.1007/s10851-005-3624-0. [DOI] [PMC free article] [PubMed] [Google Scholar]
- Ratnanather JT, Barta PE, Honeycutt NA, Lee N, Morris NG, Dziorny AC, Hurdal MK, Pearlson GD, Miller MI. Dynamic programming generation of boundaries of local coordinatized submanifolds in the neocortex: application to the planum temporale. NeuroImage. 2003;20:359–377. doi: 10.1016/s1053-8119(03)00238-6. [DOI] [PubMed] [Google Scholar]
- Ratnanather JT, Botteron KN, Nishino T, Lal R, Massie AB, Patel SG, Peddi S, Todd RD, Miller MI. Validation of cortical analysis of the medial prefrontal cortex. NeuroImage. 2001;14:1058–1069. doi: 10.1006/nimg.2001.0906. [DOI] [PubMed] [Google Scholar]
- Ratnanather JT, Wang L, Nebel MB, Hosakere M, Han X, Csernansky JG, Miller MI. Generation and analysis of the cingulate gyrus cortical surface in healthy and schizophrenia subjects. Psychiatry Research: NeuroImaging. 2004;132:53–68. doi: 10.1016/j.pscychresns.2004.07.003. [DOI] [PubMed] [Google Scholar]
- Robb RA, Hanson DP, Karwoski RA, Larson AG, Workman EL, Stacy MC. Analyze: a comprehensive, operator-interactive software package for multidimensional medical image display and analysis. Comput. Med. Imaging. Graph. 1989;13:433–454. doi: 10.1016/0895-6111(89)90285-1. [DOI] [PubMed] [Google Scholar]
- Seldon HL. Does brain white matter growth expand the cortex like a balloon? hypothesis and consequences. Laterality. 2005;10:81–95. doi: 10.1080/13576500342000310. [DOI] [PubMed] [Google Scholar]
- Thompson PM, Hayashi KM, Sowell ER, Gogtay N, Giedd JN, Rapoport JL, de Zubicaray GI, Janke AL, Rose SE, Semple J, Doddrell DM, Wang Y, van Erp TG, Cannon TD, Toga AW. Mapping cortical change in alzheimer's disease, brain development, and schizophrenia. NeuroImage. 2004;23:S2–S18. doi: 10.1016/j.neuroimage.2004.07.071. [DOI] [PubMed] [Google Scholar]
- Tosun D, Rettmann ME, Han X, Tao X, Xu C, Resnick SM, Pham DL, Prince JL. Cortical surface segmentation and mapping. NeuroImage. 2004;23:s108–s118. doi: 10.1016/j.neuroimage.2004.07.042. [DOI] [PMC free article] [PubMed] [Google Scholar]
- Tosun D, Rettmann ME, Prince JL. Mapping techniques for aligning sulci across multiple brains. Med. Image Anal. 2004;8:295–309. doi: 10.1016/j.media.2004.06.020. [DOI] [PMC free article] [PubMed] [Google Scholar]
- Trouvé A. An infinite dimensional group approach for physics based models. 1995 Technical report (electronically available at http://www.cis.jhu.edu) (Unpublished)
- Twining C, Marsland S, Taylor C. Measuring geodesic distances on the space of bounded diffeomorphisms. Proceedings of the British Machine Vision Conference (BMVC), Cardiff. 2002;2:847–856. [Google Scholar]
- Vaillant M, Glaunès J. Surface matching via currents. Lecture Notes in Comp. Sci.: Inform. Proc. in Med. Imaging. 2005;3565:381–392. doi: 10.1007/11505730_32. [DOI] [PubMed] [Google Scholar]
- Vaillant M, Miller MI, Younes L, Trouvé A. Statistics on diffeomorphisms via tangent space representations. NeuroImage. 2004;23:161–169. doi: 10.1016/j.neuroimage.2004.07.023. [DOI] [PubMed] [Google Scholar]
- Van Essen D. Surface-based approaches to spatial localization and registration in primate cerebral cortex. NeuroImage. 2004;23:s97–s107. doi: 10.1016/j.neuroimage.2004.07.024. [DOI] [PubMed] [Google Scholar]
- Van Essen D. A population-average, landmark- and surface-based (PALS) atlas of human cerebral cortex. NeuroImage. 2005;28:635–662. doi: 10.1016/j.neuroimage.2005.06.058. [DOI] [PubMed] [Google Scholar]
- Van Essen D, Drury H. Structural and functional analyses of human cerebral cortex using a surface-based atlas. J. Neurosci. 1997;17:7079–7102. doi: 10.1523/JNEUROSCI.17-18-07079.1997. [DOI] [PMC free article] [PubMed] [Google Scholar]
- Van Essen D, Drury H, Dickson J, Harwell J, Hanlon D, Anderson C. An integrated software suite for surface-based analyses of cerebral cortex. Journal of American Medical Informatics Association. 2001;8:443–459. doi: 10.1136/jamia.2001.0080443. [DOI] [PMC free article] [PubMed] [Google Scholar]


