

Abstract
Imagingon act live molecular events within micro-organisms at single cell resolution would deliver valuable mechanistic information much needed in understanding key biological processes. We present a surface-enhanced Raman (SERS) chemical imaging strategy as a first step towards exploring the intracellular bioreduction pockets of toxic chromate in Shewanella. In order to achieve this, we take advantage of an innate reductive mechanism in bacteria of reducing gold ions into intracellular gold nanoislands which provide the necessary enhancement for SERS imaging. We show that SERS has the sensitivity and selectivity not only to identify, but also to differentiate between the two stable valence forms of chromate in cells. The imaging platform was used to understand intracellular metal reductiivities in a ubiquitous metal-reducing organism Shewanella oneidensis MR-1, by mapping Chromate reduction.
Keywords: Surface Enhanced Raman Spectroscopy, Shewanella oneidensis MR-1, Single Cell Raman Imaging, Hexavalent Chromate, Bioremediation
The innate predisposition to sense and counter environmental stimuli is a fundamental trait of living systems. Microorganisms have developed various mechanisms to respond to environmental changes, many of which pose serious public health concerns.1-2 We have limited understanding in some of the key processes of bacteria such as emergence of drug resistant strains, detoxification of multiple metallic species, quorum sensing mechanisms and role of commensal microbiota in host immune systems3 to name a few. While there is an increase in availability of complete genetic information for several important strains,4-6 we currently lack sensitive imaging tools to capture live molecular events required to gain an increased understanding at a macroscopic level. In this report we describe an active intracellular chemical imaging platform using Surface enhanced Raman spectroscopy (SERS) to map multiple target molecules in single cells. We envision the proposed approach could be generalized to examine intracellular biology in its native state in both microbial and mammalian cell systems.
Surface Enhanced Raman Spectroscopy (SERS) is a highly sensitive technology that can be deployed to detect multiple analytes intracellularly when coupled with an inert substrate7 at nanometer resolutions. Here we propose an active SERS platform constituting gold nanoislands grown within cells to detect metal components in single bacterium. SERS amplifies the Raman scattering of a target held in close proximity to the surface of a nanoparticle by 5–7 orders of magnitude.8 SERS has been used for studying intracellular phosphorylation,9 aggregation of membrane lipid bodies10 and detection of cancer markers in mammalian cells.11-12 While enhancement of intracellular structures in single cells is possible in eukaryotes because of the endocytotic uptake of SERS substrates by such cells,13 this is not directly feasible in prokaryotes, especially bacteria.14-16 The intracellular chemical imaging methodology is demonstrated in a ubiquitous metal-reducing organism to simultaneously map the localization of two different forms of Chromium. Our approach uses the innate reductive machinery of cells that rapidly reduces oxidative metallic species into their zero valent states.17 Since bacteria can reduce Au(III) ions into Au(0), the so formed intracellular and extracellular gold nanoislands can be used for SERS platform development. In an earlier report,18 we demonstrated the feasibility of SERS using these intracellular nanoislands in mammalian systems and similarly others have made preliminary attempts to collect intracellular signal from bacteria.15, 19 This intracellular SERS platform has the potential to map the cellular localization of gold and two species of chromium in microbial cells at nanometer resolution in an environmentally important metal-reducing bacterium Shewanella oneidensis MR-1.
Results and Discussion
The approach described here (as shown in Figure 1) is the first to integrate Raman spectroscopic imaging with biologically synthesized Raman signal enhancing gold nanoislands to study intracellular chemical activities at a single-cell resolution. To our knowledge, this is also the first report to differentiate two species of any metal within a single bacterial cell using Raman chemical imaging using intracellularly grown gold nanoislands. Intracellularly grown gold nanoislands were used as active SERS substrates to provide the necessary signal enhancement from within the cell to reveal the cellular localization of Cr(VI) and Cr(III). Our experiments indicate that cells can withstand up to 0.8 mM Au(III) without any measurable adverse effects on cellular growth or physiology under aerobic (described in Supporting information, Sec. SI.1 -Figures S1-a & S1-b) and anaerobic conditions (data not shown). Formation of elemental gold by the reduction of Au(III) was indicated by the light pink color of the bacterial suspension (Figure 2-b, inset) and a UV-visible spectrum absorption maximum at ∼525 nm (Figure 2-b) due to the surface plasmon resonance effect of the formed colloidal gold nanoislands. These results were confirmed by examining whole mount and thin sections of S. oneidensis MR-1 cells treated with a range of Au(III) concentrations by Transmission Electron Microscope (TEM) imaging. The micrographs clearly revealed the presence of an almost even distribution of multiple gold nanoislands (highlighted with red circles) within the cellular micro-environment as shown in Figure 2 (c - e) and Figure S5 (Supporting information Sec SI.5). A careful comparison of surface plasmon peaks for the intracellularly-trapped (λmax ∼525 nm) particles versus particles released into the extracellular suspension led to the observation that the intracellular particles were slightly (∼5 nm) smaller than the extracellular particles. During our experiments, nonspecifically bound particles on the surfaces of cells were removed by repeated washing with PBS to eliminate interference. The washed cells retained their pink coloration, clearly indicating that these were from the nanoislands formed within the cells. The nanoislands thus formed were used as SERS substrates to explore intracellular chromate reduction sites in S. oneidensis MR-1.
Figure 1.

S. oneidensis MR-1, a versatile metal reducer is subjected to hexavalent Chromium-Cr(VI) followed by Au(III) treatment which results in multiple metal nanoislands within the cells. While Intracellular Gold nanoislands formed from Au(III) can be characterized with TEM imaging, Single cell Raman Chemical Imaging driven by intracellularly grown gold nanoislands is required to obtain detailed chemical localization and oxidation state information for Cr(VI) and Cr(III) in living cells.
Figure 2.

Whole Mount TEM micrographs of S. oneidensis MR-1 without Au(III) treatment (a), whole mount (c) and thin-section (d) images of cells with 0.25 mM HAuCl4 treatment and 0.5 mM HAuCl4 treatment (e). UV-Visible spectra (b) of extracellular and intracellular gold nanoislands, with smaller particles trapped inside cells (λmax ∼525 nm).
Specific and distinct Raman bands for Cr(VI) were observed in the 815 - 875 cm-1 range and for Cr(III) at 510-535 cm-1 as shown in Figure 3a. Detailed spectral characterization of chemical controls under SERS and non-SERS conditions is provided in supporting information (Sec SI.7, Figs. S6-a and S6-b). Peak assignment for chromate species was done based on our control spectra and assignment data available in literature.20 The peaks around 880 cm-1 were found to be arising due to the Cr-O-Cr bending frequency in Cr(VI) species.21 Peak seen around 842 cm-1 was assigned to stretching mode Cr – O.22-23 Also, stretching modes associated with Cr3+-O2- are Raman active, but much less intense than those observed in Cr6+-O2-.21 These spectral differences were exploited for the purposes of identifying the hexavalent and trivalent forms of chromium within the intracellular milieu. Spatially resolved confocal Raman chemical maps of Cr(VI) bioreduction in single S. oneidensis MR-1 cells were acquired using a Raman microspectrometer (SENTERRA confocal Raman system from Bruker Optics, Billerica, MA) fitted with a 785 nm laser. Spectra were acquired using a low laser power of 10 mW and an 8 sec accumulation time. A Raman band shift observed between 230-260 cm-1 due to the plasmon-phonon coupling effect resulting from acoustic vibrations of surface characteristics selected by the resonant excitation of localized plasmons24 was used as an indicator for the presence of gold nanostructures by bioreduction. The presence of the Plasmon-phonon band and its applicability in quantification24 and detection25 have been shown by us24 and its basis and origin is discussed in the prior works of others.26-27 A detailed characterization and analysis of this peak with respect to gold and silver SERS substrates is demonstrated in our previous study.24 Figures 3b & 3c illustrate characteristic spectra obtained from S. oneidensis MR-1 cells with intracellularly gold nanoparticles providing the necessary enhancement of the Raman signal. In Figure 3b, the red spectrum corresponds to Cr(VI) – (K2CrO4), Light green and black spectra both correspond to SERS spectra from two different cells showing traces of Cr(VI) trapped in cells. In Figure 3c, black spectrum corresponds to Cr(III) and red spectrum corresponds to SERS spectrum obtained from cells with intracellular gold and Cr(III) (formed by reduction of Cr(VI)). The peak shifts tentatively assigned with the corresponding wavenumbers are shown in the reference table provided in the Supporting information (Sec. SI.6).
Figure 3.

Raman signatures obtained from chemical controls for Cr(VI) and Cr(III) shown in (a) display the distinctive differences in their chemical spectra. (b). SERS Spectra obtained from S. oneidensis MR-1 loaded with intracellularly reduced gold islands indicate the presence of Cr(VI) peaks within the cells (black and green spectra, acquired from two different cells). The peaks from the chemical control (red) at 841 cm-1 perfectly align with the Cr(VI) peaks detected from within the cell. (c) Bacterial SERS spectrum (red) indicates presence of Cr(III) peaks and are aligned with those of chemical control - Cr(III) (black spectrum). The two peaks of Cr(III) present around 533 cm-1 are perfectly aligned with the intracellularly reduced Cr(III). Raman Intensity Maps (aerobic reduction: d-f & anaerobic reduction g-i) averaged over Phonon-Plasmon peak (∼ 230 cm-1) depicting the presence of intracellular pockets of gold nanoislands (d & g), localization of toxic hexavalent chromium- Cr(VI) (e & h) and reduced non-toxic chromium- Cr(III) (f & i) within a single cell.
Single-cell mapping experiments were performed using a 6 × 6 μm2 area with a 40 by 40 grid (step size of 125 nm) resulting in an image resolution of ∼22.5 × 10³ nm2 for the Raman maps. Since the spatial resolution of the instrument with a 100× objective is ∼1 μm2, spectra were acquired with overlapping x-y displacements of the piezo-motor controlled stage for signal collection. These overlaps were ∼0.985 μm2 and were processed by the OPUS™ software for each stepper motion resulting in an image resolution of ∼22.5 × 10³ nm2. The resulting Raman chemical maps are shown in Figure 3 (d-i). Raman maps of the cells were generated by integrating specific peak intensity over the mapped area.
Integrating the phonon-plasmon peak region (220-250 cm-1; Fig. 3d & 3g) from intracellularly reduced gold (Nano-gold), the localization of gold nanoclusters within the cells (marked with red arrows) is revealed. While Raman intensities mapped for Cr(VI) peaks in the wavenumber region of 828-864 cm-1 (Fig. 3e & 3h) revealed clusters of hexavalent chromium (toxic Cr(VI)), Cr(III) peaks mapped in the 522-567 cm-1 region (Fig. 3f & 3i) revealed a number of Cr(III) clusters within the cells. A considerable overlap of the Cr(VI) and Cr(III) sites within the cells confirms the intracellular reduction sites. While insoluble Cr(III) might be trapped inside cells following reduction, we initially did not expect to observe internal localization of the highly mobile Cr(VI). However, Cr(VI) could have been trapped in the reduction sites possibly due to electrostatic interactions with biomolecules leading to its intracellular localization. While both Cr(VI) and reduced Cr(III) were clearly seen in cells grown under aerobic (Fig. 3d - 3f) and anaerobic conditions (Fig. 3g - 3i, Supporting information, Sec. SI.2 - Figure S2 a-f), control samples (Supporting information, Sec. SI.2, Figure S2 g-i) grown in the absence of Cr(VI) did not shown either form of chromium within the cellular periphery. Further, area maps (Supporting information, Sec. SI.2 – Figure S2 g-i) acquired for cells reducing only Cr(VI) without any Au(III) reduction did not show useful signal due to the lack of sufficient signal enhancement. While there are several reports describing chromate reduction in S. oneidensis MR-1,28-30 this is the first study to positively locate intracellular chromate reduction sites within a single bacterium.
To confirm the presence of chromate-trapped reductive pockets within the cells, we used 3-dimensional Fluorescence Lifetime imaging (FLIM). Time-resolved laser induced fluorescence lifetime imaging is a highly selective and sensitive method used for the detection of heavy metals in aqueous solution with detection levels in picomolar concentrations. A YFP (Yellow Fluorescent protein)-labeled S. oneidensis MR-1 strain was used for fluorescence-based experiments. With time-resolved scanning confocal microscope, spatially resolved lifetime images of single cells were obtained to monitor chromate induced lifetime changes with the YFP markers. While it was not possible to differentiate the two forms of chromium within cells with FLIM imaging, we were able to positively identify the chromium localization sites within the cells. A two component fit with average lifetime values of τD1= 1.199 ns and τD2= 3.546 ns was standardized to examine YFP-labeled strain with no chromate treatment.
Upon 6 h of 0.8 mM Cr(VI) treatment, the two lifetime components were reduced by more than 10% of their initial averages to τD1= 1.054 ns and τD2= 3.136 ns as tabulated in Figure 4c (inset, data calculated from signal acquired from a large population of treated cells as shown in supporting information Sec SI.3). We hypothesize that the reduction in lifetime may be due to a change in the local ionic environment around the YFP molecules (similar to data shown in supporting information, Sec. SI.4, Figure S4), which in this case is attributed to the presence of Cr(VI) and Cr(III). These reduced lifetime pockets within the cells could be clearly identified in individual cells demarcated by scattered blue spots indicating reduced lifetime spots as seen in Figure 4b, 4d & 4e. In order to build 3D-FLIM images, we obtained confocal scans at several z-sections with a step size of 200 nm. Figures 4a & 4b shows the reconstructed 3-dimensional images of YFP-expressing S. oneidensis MR-1 cells with 0 mM and 0.8 mM of Cr(VI) treatment, respectively. We observed scattered blue-spots indicative of chromium content in several z-sections within such a 3D image, thus validating our initial observation of intracellular chromate pockets in cells. While FLIM can help in identifying localization of chromium pockets in a single cell with high resolution lifetime imaging, it lacks the sensitivity in distinguishing Cr(VI) from Cr(III). This is the key question addressed by Raman chemical imaging, which has the ability to provide a chemical fingerprint of the species enabling differentiating different forms of chromate as well as different metal species.
Figure 4.

A 3-dimensional FLIM image of YFP-labeled S. oneidensis MR-1 without chromate treatment (a) and the corresponding confocal image (a – a') from within the reconstructed 3D image, a 3D image of cells with 0.8 mM Cr(VI) treatment (b) and a corresponding confocal image (b-b') from within, confocal FLIM images with 0.8 mM Cr(VI) treatment (c-d), Average Fluorescence Lifetimes calculated for a larger cell count (∼200 cells in the field of view) plotted with their corresponding τD values reported in the table.
Further studies to quantitate Cr(VI) and Cr(III) were performed by Inductively Coupled Plasma Mass-Spectrometry (ICP-MS) in cell populations. A dynamic reaction cell (DRC) mediated sample chamber was incorporated to eliminate polyatomic interferences (40Ar12C+, 1H35Cl16O+, 40Ar13C+ and 37Cl16O+) and an amino-propyl coated silica based ion-exchange column was used to separate Cr(VI) from Cr(III).31 The column efficiency is shown in Figure 5b with Cr(VI) (being an oxyanion) almost completely retained within the column and Cr(III) (cation) passed through without much interference from the column. At the end of chromate treatment, cells were separated from the suspension to measure [Cr] in cells versus supernatant. Approximately 80% of Cr(VI) was reduced within 12 h under aerobic conditions. A detailed calibration curve for Cr(III) quantification is shown in Figures 5a. 5c & 5d validate cellular Cr(VI) reduction both intracellularly and extracellularly in the supernatant. The ICP-MS experiments showed strong cellular association of both forms of chromium. Although ICP-MS on cell populations cannot distinguish intra- versus extracellular chromium, the data support the presence of both Cr(III) and Cr(VI) peaks within cells via Raman Chemical Imaging as well as the cellular location of chromium obtained via FLIM imaging.
Figure 5.
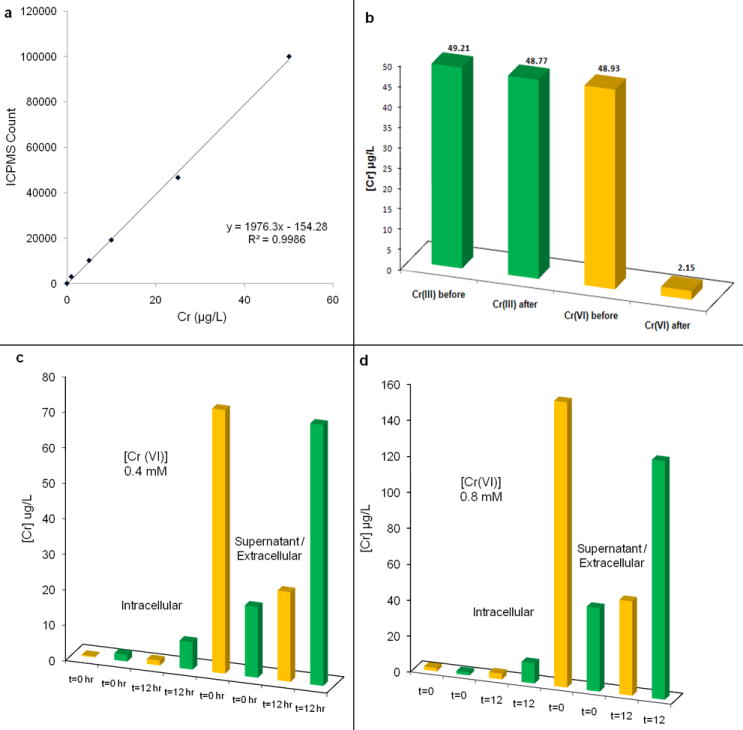
Calibration curve for Cr(VI) (a), Characterization of aminopropyl phase silica column for Chromium speciation (b), Cr(VI) reduction with time: 0.4 mM [Cr(VI)] (c) and 0.8 mM [Cr(VI)] (d). Green bars, Cr(III); Yellow bars, (Cr(VI)).
Imaging of different metal species in single cells are usually performed by X-ray photoelectron spectroscopy; however, these tools are rather specialized because experiments are conducted in a Synchrotron facility, thus limiting accessibility and in most cases requiring extensive sample preparation Most of the current research is done at cell population level examining the microbially mediated remediation of toxic metals in batch culture, rather than examining the fate of toxic metal ions at the single cell level. The proposed Raman imaging platform can be used to probe the biochemical activities within microbes or mammals to obtain a detailed understanding of oxido-reductive pockets present within an intracellular milieu. By creating an intracellular gold nanoisland driven SERS platform, we have shown that Raman Chemical Maps can be obtained to positively locate dispersed intracellular nanoclusters of gold and hexavalent and trivalent forms of chromium in remediating bacterium. Single cell Raman chemical maps show that a considerably higher percentage of intracellular chromate was present in the reduced trivalent form. While this study demonstrates the successful integration of single molecule spectroscopic tools with nanobiotechnology to enhance our knowledge of bioreductive mechanisms at single cell level, it reveals the potential to further study complex electron donor (protein or co-factor) – metal interactions at localization sites within cells. Ultimately, we show that Raman spectroscopy has the potential to distinguish multiple metallic species and thus can be incorporated to probe multiple metal reduction reactions in single bacteria as well as in communities of organisms.
Methods
Organism, culture conditions, Chromate reduction and Gold Nanoisland formation
Shewanella oneidensis MR-1 was cultured on LB Agar plates followed by an overnight incubation in LB broth at 37 °C with vigorous shaking at 240 rpm. For fluorescence lifetime experiments, YFP expressing strain32 was cultured in LB supplemented with 10 μg/ml Gentamycin. Disappearance of extracellular Cr(VI) was quantified spectrophotometrically using a Jasco V570 UV–visible–NIR spectrophotometer (Jasco, Inc., Easton, MD) at 540 nm using the ChromaVer 3 Chromium Reagent (Hach Permachem Reagents, Loveland, CO, USA), which contains 1,5-diphenylcarbazide. S. oneidensis MR-1 was cultured in 5 ml LB with 0 to 1.2 mM Cr(VI) added as K2CrO4 (Sigma Aldrich, St. Louis, MO). The amount of Cr(VI) in the medium was measured at 0, 1, 3, 6, 8 and 24 hours post chromate-addition. Each of these assays was performed in triplicate. After the chromate was completely reduced by cells, the cells were collected by centrifugation and resuspended in PBS buffer (pH 7.4). A 10 mM HAuCl4 stock solution was used to obtain a series of dilutions ranging from 0.3mM to 1.5mM HAuCl4 solutions. Gold nano-island formation was monitored in 2 h intervals using a Jasco V570 UV–visible–NIR spectrophotometer (Jasco, Inc., Easton, MD), in the wavelength range between 400 and 800 nm. The measured spectra were normalized by rescaling the maximum absorbance of the longitudinal plasmon peak to 1. For anaerobic growth, 25 ml of an aerobic culture (mid-log phase) was used to inoculate 200 ml of LB broth maintained under anaerobic conditions, supplemented with 20 mM sodium lactate as the electron donor and either 2 mM Chromate or 5 mM sodium nitrate as the electron acceptor. For gold reduction, anaerobically grown cells at exponential phase were extracted from the media and resuspended in 20 mM bicarbonate buffer (pH 7.4) or HEPES buffer (pH 6.5) supplemented with 10 mM sodium lactate as the electron donor and 2 mM Au(III) as the electron acceptor, all maintained under a bubbling mixture of oxygen free nitrogen and Carbon dioxide.
Toxicity assay & viability tests
An overnight culture of each of the strains of S. oneidensis MR-1(WT/ YFP) was diluted in Luria Broth (LB) to an approximate optical density (OD600) of 0.02 and distributed in 200 ml aliquots in a 96-well plate. Chromate was added to triplicate wells in concentrations ranging from 0.2 mM to 1.5 mM. Au(III) [HAuCl4 3H2O] ranging in concentration from 0.1 mM to 2 mM were examined for the effect of gold ions on the growth of each of these strains. Turbidity was measured at 600 nm periodically on a SpectraMax plus384 High-Throughput Microplate Spectrophotometer. In order to test the viability of cells at the end of Cr(VI)/Au(III) reduction, a series of dilutions of these cells were spread on sterile LB- Agar plates to estimate the number of colony forming units in each of these wells under varying [Cr] and [Au] at different cell dilutions.
Confocal Raman Imaging and spectroscopic measurements
A SENTERRA confocal Raman system (Bruker Optics, Billerica, MA) fitted with a 785 nm laser, and a 100× air objective (N.A. 0.9) was employed for micro-spectroscopic measurements. An integration time of 8 sec and a laser power of 10 mW were used to examine the Raman shift corresponding to Cr(VI), Cr(III), and bacterial components. A 6 × 6 μm2 grid (area) was chosen around the target cell and the number of grids was selected to be 1600 resulting in a 40 × 40 grid on the cell and a step size of 125 nm with an individual grid size of 0.0156 μm2. A significant overlap (∼97.75%) of grids was removed by image processing to attain the required resolution (using OPUS 6.5 software) of the Raman intensity maps.
Confocal Fluorescence Lifetime Imaging Instrumentation
Fluorescence Lifetime measurements were performed with a time-resolved scanning confocal microscope (Microtime 200, Picoquant GmbH, Berlin, Germany); with a 465 nm (40 MHz pico second) pulse laser to excite the YFP expressing S. oneidensis MR-1. The laser beam was focused onto the sample through an apochromatic 60×, 1.2 NA water immersion objective, and the emitted fluorescence was acquired using the same objective and the excitation beam was subtracted using a dual band dichroic (z467/638rpc, Chroma). A 50 μm pinhole was used to reject the off-focus photons from the excitation volume, and the overall fluorescence was collected and separated accordingly using a dichroic beam splitter (600 dcxr, AHF, Chroma) and filtered by emission filters before being detected by two single photon avalanche photodiodes (SPAD) (SPCM-AQR, PerkinElmer Inc.). Fluorescence spectra were measured using a Cary Eclipse Fluorescence spectrophotometer (Varian Inc, Palo Alto, CA) with a 488 nm excitation followed by fluorescence intensity measurement acquisition from 500 – 600 nm. A 500μl bacterial suspension incubated with Cr(VI) was washed, rinsed and resuspended in PBS buffer for the Fluorescence intensity measurements.
ICP-MS / Chromate Quantification
Inductively Coupled Plasma – Mass Spectrometer (ICP-MS) measurements were performed using a quadrupole ELAN DRC-e spectrometer (PerkinElmer SCIEX, Ontario, Canada), equipped with a Dynamic Reaction Cell (DRC) to estimate the initial concentration of Cr(VI) and the reduced Cr(III). The sample delivery system consisted of a PerkinElmer auto sampler model AS-93 Plus tray, peristaltic pump and a cross-flow nebulizer with a double pass spray chamber. The same instrumental conditions were used for quantification of both total Chromium (Cr(VI) + Cr(III)) and Cr(III). Chromabond NH2/3 mL/500 mg columns (i.e. Aminopropyl phase with a 3 mL volume and 500 mg of sorbent) were obtained from Macherey-Nagel (Duren, Germany). These columns were employed for speciation of Cr(III) from Cr(VI) both in the cells and the supernatant.
Supplementary Material
Acknowledgments
Funding for this research was provided by NIH-NIEHS R01 ES017066-02 award. We acknowledge Chia-ping Huang and Dr. Debbie Sherman for their assistance with TEM imaging. Plasmids p18 and p19 used for developing GFP expressing S. oneidensis MR-1 were kind gifts from Dr. Jennifer Morrell-Falvey at the Oak Ridge National Laboratory. We thank Dr. Jiji Chen for his assistance with FLIM experiments. We are thankful to Dr. Linda Lee and Stephen Sassman from the Biological Sciences Department at Purdue for their assistance with ICP-MS experiments. We thank Dr. Nathan Mosier and Elizabeth Casey for their assistance in anaerobic bioreactor studies used for gold reduction experiments.
Footnotes
Supporting Information Available: Toxicity Assay and Viability studies, Confocal Raman mapping images for control samples, Confocal Fluorescence lifetime calculations, Chromium induced fluorescence quenching, TEM images of intracellularly trapped gold nanoislands, tentative band assignment for SERS spectra acquired from S. oneidensis MR-1 and spectral characterization of chemical controls are presented. This material is available free of charge via the internet at http://pubs.acs.org.
Contributor Information
Sandeep P. Ravindranath, Email: psandeep@purdue.edu.
Kristene L. Henne, Email: khenne@anl.gov.
Dorothea K. Thompson, Email: dthomps4@utk.edu.
Joseph Irudayaraj, Email: josephi@purdue.edu.
References
- 1.Virgin HW. In Vivo Veritas: Pathogenesis of Infection as It Actually Happens. Nat Immunol. 2007;8:1143–1147. doi: 10.1038/ni1529. [DOI] [PubMed] [Google Scholar]
- 2.Woolhouse MEJ, Webster JP, Domingo E, Charlesworth B, Levin BR. Biological and Biomedical Implications of the Co-Evolution of Pathogens and Their Hosts. Nat Genet. 2002;32:569–577. doi: 10.1038/ng1202-569. [DOI] [PubMed] [Google Scholar]
- 3.Salzman NH, Underwood MA, Bevins CL. Paneth Cells, Defensins, and the Commensal Microbiota: A Hypothesis on Intimate Interplay at the Intestinal Mucosa. Sem Immunol. 2007;19:70–83. doi: 10.1016/j.smim.2007.04.002. [DOI] [PubMed] [Google Scholar]
- 4.Methé BA, Nelson KE, Eisen JA, Paulsen IT, Nelson W, Heidelberg JF, Wu D, Wu M, Ward N, Beanan MJ, et al. Genome of Geobacter sulfurreducens: Metal Reduction in Subsurface Environments. Science. 2003;302:1967–1969. doi: 10.1126/science.1088727. [DOI] [PubMed] [Google Scholar]
- 5.White O, Eisen JA, Heidelberg JF, Hickey EK, Peterson JD, Dodson RJ, Haft DH, Gwinn ML, Nelson WC, Richardson DL, et al. Genome Sequence of the Radioresistant Bacterium Deinococcus radiodurans R1. Science. 1999;286:1571–1577. doi: 10.1126/science.286.5444.1571. [DOI] [PMC free article] [PubMed] [Google Scholar]
- 6.Heidelberg JF, Paulsen IT, Nelson KE, Gaidos EJ, Nelson WC, Read TD, Eisen JA, Seshadri R, Ward N, Methe B, et al. Genome Sequence of the Dissimilatory Metal Ion-Reducing Bacterium Shewanella oneidensis. Nat Biotechnol. 2002;20:1118–1123. doi: 10.1038/nbt749. [DOI] [PubMed] [Google Scholar]
- 7.Murray CA, Allara DL, Rhinewine M. Silver-Molecule Separation Dependence of Surface-Enhanced Raman Scattering. Phys Rev Lett. 1981;46:57–60. [Google Scholar]
- 8.Tian ZQ, Ren B, Li JF, Yang ZL. Expanding Generality of Surface-Enhanced Raman Spectroscopy with Borrowing SERS Activity Strategy. Chem Commun. 2007:3514–3534. doi: 10.1039/b616986d. [DOI] [PubMed] [Google Scholar]
- 9.Shachaf CM, Elchuri SV, Koh AL, Zhu J, Nguyen LN, Mitchell DJ, Zhang J, Swartz KB, Sun L, Chan S, et al. A Novel Method for Detection of Phosphorylation in Single Cells by Surface Enhanced Raman Scattering (SERS) Using Composite Organic-Inorganic Nanoparticles (Coins) PLoS ONE. 2009;4:e5206. doi: 10.1371/journal.pone.0005206. [DOI] [PMC free article] [PubMed] [Google Scholar]
- 10.van Manen HJ, Kraan YM, Roos D, Otto C. Single-Cell Raman and Fluorescence Microscopy Reveal the Association of Lipid Bodies with Phagosomes in Leukocytes. Proc Natl Acad Sci USA. 2005;102:10159–10164. doi: 10.1073/pnas.0502746102. [DOI] [PMC free article] [PubMed] [Google Scholar]
- 11.Huang X, El-Sayed IH, Qian W, El-Sayed MA. Cancer Cells Assemble and Align Gold Nanorods Conjugated to Antibodies to Produce Highly Enhanced, Sharp, and Polarized Surface Raman Spectra: A Potential Cancer Diagnostic Marker. Nano Lett. 2007;7:1591–1597. doi: 10.1021/nl070472c. [DOI] [PubMed] [Google Scholar]
- 12.Kim JH, Kim JS, Choi H, Lee SM, Jun BH, Yu KN, Kuk E, Kim YK, Jeong DH, Cho MH, et al. Nanoparticle Probes with Surface Enhanced Raman Spectroscopic Tags for Cellular Cancer Targeting. Anal Chem. 2006;78:6967–6973. doi: 10.1021/ac0607663. [DOI] [PubMed] [Google Scholar]
- 13.Kneipp K, Haka AS, Kneipp H, Badizadegan K, Yoshizawa N, Boone C, Shafer-Peltier KE, Motz JT, Dasari RR, Feld MS. Surface-Enhanced Raman Spectroscopy in Single Living Cells Using Gold Nanoparticles. Appl Spectrosc. 2002;56:150–154. [Google Scholar]
- 14.Rojas-Chapana JA, Correa-Duarte MA, Ren Z, Kempa K, Giersig M. Enhanced Introduction of Gold Nanoparticles into Vital Acidothiobacillus Ferrooxidans by Carbon Nanotube-Based Microwave Electroporation. Nano Lett. 2004;4:985–988. [Google Scholar]
- 15.Jarvis RM, Law N, Shadi IT, O'Brien P, Lloyd JR, Goodacre R. Surface-Enhanced Raman Scattering from Intracellular and Extracellular Bacterial Locations. Anal Chem. 2008;80:6741–6746. doi: 10.1021/ac800838v. [DOI] [PubMed] [Google Scholar]
- 16.Ravindranath SP, Henne KL, Thompson DK, Irudayaraj J. Surface-Enhanced Raman Imaging of Intracellular Bioreduction of Chromate in Shewanella oneidensis. PLoS ONE. 2011;6:e16634. doi: 10.1371/journal.pone.0016634. [DOI] [PMC free article] [PubMed] [Google Scholar]
- 17.Konishi Y, Tsukiyama T, Ohno K, Saitoh N, Nomura T, Nagamine S. Intracellular Recovery of Gold by Microbial Reduction of Aucl4- Ions Using the Anaerobic Bacterium Shewanella algae. Hydrometallurgy. 2006;81:24–29. [Google Scholar]
- 18.Shamsaie A, Jonczyk M, Sturgis J, Robinson JP, Irudayaraj J. Intracellularly Grown Gold Nanoparticles as Potential Surface-Enhanced Raman Scattering Probes. J Biomed Opt. 2007;12:0205021–0205023. doi: 10.1117/1.2717549. [DOI] [PubMed] [Google Scholar]
- 19.Efrima S, Bronk BV. Silver Colloids Impregnating or Coating Bacteria. J Phys Chem B. 1998;102:5947–5950. [Google Scholar]
- 20.Weckhuysen BM, Wachs IE, Schoonheydt RA. Surface Chemistry and Spectroscopy of Chromium in Inorganic Oxides. Chem Rev. 1996;96:3327–3350. doi: 10.1021/cr940044o. [DOI] [PubMed] [Google Scholar]
- 21.Weckhuysen BM, Wachs IE. In Situ Raman Spectroscopy of Supported Chromium Oxide Catalysts: 18O2–16O2 Isotopic Labeling Studies. J Phys Chem B. 1997;101:2793–2796. [Google Scholar]
- 22.Mosier-Boss PA, Lieberman SH. Surface-Enhanced Raman Spectroscopy (SERS) and Molecular Modeling of the Chromate Interaction with 4-(2-Mercaptoethyl)Pyridinium. Langmuir. 2003;19:6826–6836. [Google Scholar]
- 23.Michel G, Cahay R. Raman Spectroscopic Investigations on the Chromium(Vi) Equilibria Part 2—Species Present, Influence of Ionic Strength and CrO42− - Cr2O72− Equilibrium Constant. J Raman Spectrosc. 1986;17:79–82. [Google Scholar]
- 24.Sun L, Irudayaraj J. Quantitative Surface-Enhanced Raman for Gene Expression Estimation. Biophys J. 2009;96:4709–4716. doi: 10.1016/j.bpj.2009.03.021. [DOI] [PMC free article] [PubMed] [Google Scholar]
- 25.Shamsaie A, Heim J, Yanik AA, Irudayaraj J. Intracellular Quantification by Surface Enhanced Raman Spectroscopy. Chem Phys Lett. 2008;461:131–135. [Google Scholar]
- 26.Weitz DA, Gramila TJ, Genack AZ, Gersten JI. Anomalous Low-Frequency Raman Scattering from Rough Metal Surfaces and the Origin of Surface-Enhanced Raman Scattering. Phys Rev Lett. 1980;45:355. [Google Scholar]
- 27.Kröger J. Phonons and Electrons at Metal Surfaces. Appl Phys A: Mater Sci Process. 2007;87:345–350. [Google Scholar]
- 28.Sridhar V, Brent MP, William AA, James NP. Chromate/Nitrite Interactions in Shewanella oneidensis MR-1: Evidence for Multiple Hexavalent Chromium [Cr(VI)] Reduction Mechanisms Dependent on Physiological Growth Conditions. Biotechnol Bioeng. 2002;78:770–778. doi: 10.1002/bit.10261. [DOI] [PubMed] [Google Scholar]
- 29.Brown SD, Thompson MR, VerBerkmoes NC, Chourey K, Shah M, Zhou J, Hettich RL, Thompson DK. Molecular Dynamics of the Shewanella oneidensis Response to Chromate Stress. Mol Cell Proteomics. 2006;5:1054–1071. doi: 10.1074/mcp.M500394-MCP200. [DOI] [PubMed] [Google Scholar]
- 30.Tang YJ, Laidlaw D, Gani K, Keasling JD. Evaluation of the Effects of Various Culture Conditions on Cr(VI) Reduction by Shewanella oneidensis MR-1 in a Novel High-Throughput Mini-Bioreactor. Biotechnol Bioeng. 2006;95:176–184. doi: 10.1002/bit.21002. [DOI] [PubMed] [Google Scholar]
- 31.Ambushe AA, McCrindle RI, McCrindle CME. Speciation of Chromium in Cow's Milk by Solid-Phase Extraction/Dynamic Reaction Cell Inductively Coupled Plasma Mass Spectrometry (DRC-ICP-MS) J Anal At Spectrom. 2009;24:502–507. [Google Scholar]
- 32.Pelletier DA, Hurst GB, Foote LJ, Lankford PK, McKeown CK, Lu TY, Schmoyer DD, Shah MB, Hervey WJ, McDonald WH, et al. A General System for Studying Protein-Protein Interactions in Gram-Negative Bacteria. J Proteome Res. 2008;7:3319–3328. doi: 10.1021/pr8001832. [DOI] [PubMed] [Google Scholar]
Associated Data
This section collects any data citations, data availability statements, or supplementary materials included in this article.