

Abstract
Force–distance measurements have been used to examine differences in the interaction of the dendritic cell glycan-binding receptor DC-SIGN and the closely related endothelial cell receptor DC-SIGNR (L-SIGN) with membranes bearing glycan ligands. The results demonstrate that upon binding to membrane-anchored ligand, DC-SIGNR undergoes a conformational change similar to that previously observed for DC-SIGN. The results also validate a model for the extracellular domain of DC-SIGNR derived from crystallographic studies. Force measurements were performed with DC-SIGNR variants that differ in the length of the neck that result from genetic polymorphisms, which encode different numbers of the 23-amino acid repeat sequences that constitute the neck. The findings are consistent with an elongated, relatively rigid structure of the neck repeat observed in crystals. In addition, differences in the lengths of DC-SIGN and DC-SIGNR extracellular domains with equivalent numbers of neck repeats support a model in which the different dispositions of the carbohydrate-recognition domains in DC-SIGN and DC-SIGNR result from variations in the sequences of the necks.
The human glycan-binding receptors DC-SIGN (dendritic-cell-specific intercellular adhesion molecule 1-grabbing nonintegrin; CD209) and DC-SIGNR (DC-SIGN-related receptor, also designated as L-SIGN, CD209L, and CD299) share overall sequence identity of 77% and arose by a relatively recent gene duplication within the primate lineage. DC-SIGN is expressed on dendritic cells and some macrophages, while DC-SIGNR is expressed on endothelial cells in the liver and lymph node sinusoids and in cells lining placental capillaries.1−3 Expression of these receptors on distinct cell types suggests that they have potentially different functions. Both bind to the T-cell surface receptor ICAM-31,2 in order to facilitate infection of T cells by human immunodeficiency virus (HIV(4)) and act as primary receptors that mediate entry of Ebola virus into cells.4,5 However, they bind differentially to other pathogens.(6) For example, DC-SIGN plays a critical role in modulating the host response to schistosomal parasites, and it interacts with Helicobacter pylori, while DC-SIGNR facilitates infection of hepatocytes, by presenting hepatitis C virus on liver endothelial cells.(7) DC-SIGNR also promotes transmission of human immunodeficiency virus across the placenta.(8)
These differences in the biological properties of DC-SIGN and DC-SIGNR are mirrored by differences in their molecular properties. For example, although both receptors bind to high-mannose oligosaccharides, these are the only glycans that are detected in glycan array analysis of DC-SIGNR, while the presence of key residues in the carbohydrate-recognition domain (CRD) of DC-SIGN, particularly Val351, supports binding to fucosylated Lewis-type oligosaccharide structures as well.(9) Such differences probably explain why DC-SIGN binds to parasites that are rich in such structures, while DC-SIGNR does not.10,11
In addition to these differences in the ligand-binding domains of DC-SIGN and DC-SIGNR, there appear to be significant but less well understood differences in their overall architectures (Figure 1A,B). In both receptors, the carbohydrate-recognition domains are projected from the cell surface by a neck domain comprising multiple copies of a 23-amino acid repeat sequence, but the number of copies of the repeat is largely fixed fixed at 7.5 in DC-SIGN, while polymorphisms in the gene for DC-SIGNR result in variant forms of the neck containing between 4.5 and 9.5 repeats.12,13 The allele frequency of the 7.5-repeat variant is over 50% in the human population, but the frequencies of the 6.5- and 5.5-repeat variants are 12–16% and 26–37%, respectively. Different neck-length genotypes have been associated with variations in susceptibility to certain viral infections. The 7.5-repeat form is more common in HIV-infected individuals than in uninfected individuals.(14) However, this correlation with HIV susceptibility has not been observed in all cases.(12) The presence of 4.5-repeat and 9.5-repeat variants correlates with decreased viral load in hepatitis C virus infection.(15) The shorter necks are also associated with diminished rates of SARS coronavirus infection.(16)
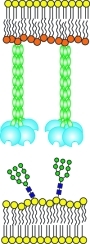
Figure 1.

Organization of the extracellular domain of DC-SIGNR. (A) Length variants of DC-SIGNR (left) and corresponding truncated, His6-tagged proteins used for force–distance measurements (right). (B) Comparison of proposed organization of DC-SIGN and DC-SIGNR based on crystal structures of DC-SIGNR fragments.(17) (C) Configuration of DC-SIGNR and neoglycolipid in force measurements. D is the absolute separation between the bilayer surfaces.
It is also noteworthy that the neck repeat adjacent to the CRD of DC-SIGNR differs significantly in sequence from the corresponding sequence in DC-SIGN. Recent structural analysis of a truncated form of the neck domain of DC-SIGNR, combined with a structure of the final neck repeat attached to the CRD, has indicated that a phenylalanine in the final neck repeat of DC-SIGNR causes the polypeptides forming the necks to splay apart at this point.(17) In DC-SIGN, the presence of a valine residue at this position suggests that the neck could remain packed as they are in the other neck repeats, thereby placing the CRDs closer to each other. Thus, differences in the neck regions of DC-SIGN and DC-SIGNR may also contribute to differences in their interactions with pathogens.
Force–distance measurements have provided a means of looking at interactions of the intact extracellular domain of DC-SIGN with ligands.(18) In these experiments, an N-terminal histidine tag was used to anchor the protein and project the extracellular domain of DC-SIGN from the surface of one membrane, which was apposed to a second membrane bearing a neoglycolipid with a high-mannose oligosaccharide headgroup (Figure 1C). Measurement of the distance dependence of the interaction force between the membranes demonstrated that DC-SIGN undergoes a conformational change driven by engagement with ligand. This change reflects flexibility in the linkage between the neck and the CRD.
In the experiments described here, force–distance measurements have been used to demonstrate that DC-SIGNR undergoes a conformational change, similar to that observed for DC-SIGN. Distinct from the prior studies, here we further investigated how differences in the final neck repeat as well as the genetic polymorphisms affect both the projected distance of the CRDs from the membrane surface and the magnitude of adhesion.
Materials and Methods
Materials
1,2-Dipalmitoyl-sn-glycero-3 phosphoethanolamine (DPPE) and 1,2-ditridecanoyl-sn-glycero-3-phosphocholine (DTPC) were from Avanti Polar Lipids (Alabaster, AL). 6-[9-[2,3-Bis(dodecyloxy)propyl]-3,6,9-trioxanonyl-1-oxycarboxylamino]-2-[di(carboxymethyl)amino]hexanoic acid (NTA-TRIG-DLGE) was custom synthesized by Neuftech Chemicals (Vancouver, BC). HEPES was purchased from Fisher Bioreagents (Fair Lawn, NJ), and all other high-purity salts were from Aldrich (St. Louis, MO). The neoglycolipid Man9GlcNAc2-DPPE was synthesized according to described procedures.(18)
DC-SIGNR Expression and Purification
Restriction fragments from vectors used for bacterial expression of the extracellular domains of three variants of human DC-SIGNR(19) were moved into a vector encoding an N-terminal His6 tag previously designed for use with DC-SIGN.(18) The vector encodes the sequence Met-Ala-His-His-His-His-His-His-Gly-Glu-Leu, which begins at residue 101 of the full-length DC-SIGNR protein, and corresponds to the middle of the first 23-amino acid repeat in the extracellular domain. The tagged protein was purified by affinity chromatography on mannose–Sepharose following the protocol used for the untagged extracellular domain.(20) The affinity purification confirms that the CRDs are folded and active.
DC-SIGNR Immobilization on Planar Lipid Bilayers
The recombinant proteins with hexahistidine tags at the N-termini of the extracellular segments of DC-SIGNR were immobilized on asymmetric, planar lipid bilayers, which were supported on mica sheets affixed to hemicylindrical silica disks with 1–2 cm radii of curvature.(18) The first layer is a gel phase DPPE monolayer that was transferred at a surface pressure of 38 mN/m by Langmuir–Blodgett deposition onto the mica. DPPE was transferred from a pure water subphase at 21 °C. At this temperature and pressure, the area per lipid is 43 Å2. The outer leaflet is a 100% NTA-TRIG-DLGE monolayer deposited onto the DPPE monolayer at 65 Å2 per lipid, from a subphase of buffer A (20 mM HEPES, 50 mM NaNO3, 3 mM Ca(NO3)2, and 50 μM NiSO4 at pH 7.8) at 21 °C. The deposition surface pressure was 35 mN/m, and the NTA-TRIG-DLGE monolayer is in the fluid phase at 21 °C. The resulting supported bilayer was kept under buffer A at all times. It was then incubated for 1.5 h with 0.5 μM of either of the hexahistidine-tagged 7-, 6-, or 5-repeat DC-SIGNR variants in buffer A. Nonspecifically adsorbed protein was removed by rinsing the bilayer with buffer A.
Determination of the Surface Coverage of Immobilized 7-, 6-, and 5-Repeat Forms of DC-SIGNR
The amount of DC-SIGNR immobilized on the supported NTA-TRIG-DLGE monolayers was quantified by surface plasmon resonance.(21) For these measurements, the Langmuir–Blodgett monolayer of NTA-TRIG-DLGE (65 Å2/lipid) was supported on a monolayer of 1-octadecanethiol that was self-assembled on a gold-coated glass slide. The sample was then assembled in the surface plasmon resonance cell, while maintaining it under solution at all times.
DC-SIGNR adsorption was quantified from the change in the plasmon resonance angle measured after incubating the NTA-TRIG-DLGE monolayer with 0.5 μM of either of the 7-, 6-, or 5-repeat DC-SIGNR for 1.5 h at room temperature. The 1.5 h incubation time was also used to prepare samples for all surface force measurements in this study. The total protein adsorbed was determined from the change in the resonance angle and use of the 5-phase Fresnel calculation program (R. Corn, University of California, Irvine). The DC-SIGNR surface coverage was calculated from the effective refractive index of the protein monolayer neff. This value is obtained from the measured optical thickness (product of the refractive index and layer thickness, neff × DT). This measurement and the thicknesses DT determined from surface force measurements were used to obtain the effective refractive index neff. Assuming a linear dependence of the refractive index on surface concentration, the surface coverage Γ (molecules/m2) of the different DC-SIGNR variants was calculated from the refractive indices and use of a refractive index increment dn/dc of 0.187, where c is the surface concentration in mg/m2.22,23 The error in protein densities determined from refractive index measurements is ∼20%.22,23 This analysis differs slightly from that used previously (see Supporting Information).(18) The protein (tetramer) densities of the 7-repeat and 6-repeat forms are determined by dividing the monomer density by four. A similar calculation for the 5-repeat form is more complicated because it is expressed as a mixture of interconverting dimers and tetramers, with a solution dissociation constant of 0.14 μM, as determined by equilibrium analytical ultracentrifugation.(11) Whether this distribution persists on the membrane, particularly under applied force, cannot be easily determined. Nevertheless, the measured jumps into contact presented here indicate the presence of folded tetramers on the membrane.
Man9GlcNAc2-DPPE/DTPC Model Membrane Preparation
Asymmetric bilayers displaying Man9GlcNAc2-DPPE were supported on a gel phase DPPE monolayer (43 Å2 per lipid). The DPPE was in turn supported on a mica sheet that was affixed to a hemicylindrical, silica disk. The outer layer contains 5 mol % of Man9GlcNAc2-DPPE mixed with DTPC (fluid, Tm < 21 °C) (Figure 1C) and was transferred by Langmuir–Blodgett deposition from a subphase of buffer A at 21 °C at 65.4 ± 0.8 Å2 per DTPC. These neoglycolipid/DTPC monolayers are in the fluid state at 21 °C. The molar concentrations of DPPE, DTPC, and Man9GlcNAc2-DPPE in stock solutions were determined with the Bartlett phosphorus assay.(24) At 5 mol % Man9GlcNAc2-DPPE in the outer leaflet, the average area per neoglycolipid is 7.7 × 10¹⁶ glycolipid/m2.
The silica disks supporting the DC-SIGNR and the 5 mol % Man9GlcNAc2-DPPE bilayers were maintained under buffer A and transferred into the chamber surface force apparatus, which was filled with buffer A. All measurements were performed at 21 ± 0.2 °C.
Surface Force Measurements
Surface force measurements were carried out with a Mark III instrument, and the spring constant used was 205 N/m. In surface force measurements between oriented monolayers of DC-SIGNR and 5 mol % Man9GlcNAc2 containing lipid monolayers (Figure 1C), the separation distance D between the lipid bilayers can be determined within ±0.1 nm by interferometry.(25) The difference in the total thickness, T, of the molecular assembly relative to contact between supporting DPPE monolayers was measured after the deposition of the outer lipid layers. The absolute membrane separation distance is D = T – (TNTA-TRIG-DLGE + TDTPC),(26) where TNTA-TRIG-DLGE is the thickness of the NTA-TRIG-DLGE monolayer(27) and TDTPC is the thickness of the DTPC on the neoglycolipid-containing membrane. The DTPC layer thickness does not include the thickness of the Man9GlcNAc2 headgroup, such that D = 0 is defined as contact between the NTA-TRIG-DLGE and bare DTPC membranes.
The normalized intersurface force (Fc/R) was measured when first bringing the protein and ligand surfaces into contact and again upon separating them. The normalized force Fc/R is determined as a function of the separation distance D. The adhesion was then measured during surface separation. In these measurements, adhesion was measured after 8 min in contact. Prior studies of DC-SIGN showed that adhesion to fluid neoglycolipid membranes increases with time up to a limiting value, due to the lateral diffusion of glycan ligands and corresponding increase in number of CRD–glycan bonds.(18) Because the lateral lipid diffusion and lipid density are identical for all samples in this study and in the prior measurements, differences in adhesion energies measured at identical contact times would therefore reflect functional differences between the different length variants.
The adhesion energy per unit area (EAdh, mJ/m2) measured between receptor and ligand monolayers is quantified from the pull-off force required to separate the adherent sample surfaces (Fpo)(28) and use of the Derjaguin–Müller–Toporov model for adhesion between undeformed surfaces: Ea = Fpo/2πR. Here, R is the geometric average radius of the two discs: R =(R1R2)1/2. Further normalizing the adhesion energy per area by the protein surface coverage (number of proteins/area) accounts for differences in protein densities across experiments.
Because the pull-off forces can depend on the rate of separation, preliminary measurements were done at different separation rates to establish conditions where the pull-off forces were rate independent and would therefore report the equilibrium adhesion energy per area. In the present study, at typical separation rates of ∼20–40 Å/min, the pull-off forces were in the rate-independent regime.
Statistical Analyses of Distance Measurements
The determined initial contact position DC, equilibrium separation Deq, position of maximum adhesion DAdh, and thickness in the absence of ligand DT are averages of 7–20 measurements from 2–3 independent experiments. Standard deviations are the pooled standard deviations from separate sets of measurements. Averages were compared using the student’s t test, and p-values <0.05 indicate a statistically significant difference, at the 95% confidence level. The standard deviation of the difference between pairs of values was determined by propagation of errors.
Results and Discussion
The surface densities of the immobilized proteins, as determined from surface plasmon resonance (SPR) measurements, were 2.9, 1.2, and 0.72 mg/m2 for the 7-, 6-, and 5-repeat forms, respectively. In the absence of Ni2+ there was no detectable nonspecific protein adsorption, indicating that all proteins bound selectively by their histidine tags. The molecular weights of the monomers of the length variants are 35 344 Da (7-repeat), 32 718 Da (6-repeat), and 30 119 Da (5-repeat), so that the calculated monomer surface densities were Γ7 = 4.9 × 10¹⁶, Γ6 = 2.1 × 10¹⁶, and Γ5 = 1.4 × 10¹⁶ monomers/m2.
In the absence of ligand, the normalized force versus distance curves obtained with the surface force apparatus were reversible and exhibited intersurface repulsion due to steric interactions between the protein and bare lipid monolayers (Figure S1). The thickness of the unbound protein DT was determined from the distance at which the repulsive force exceeded the measurement standard deviation of ±0.03 mN/m. Thicknesses of 31.5 ± 0.5, 27.6 ± 0.5, and 22.4 ± 0.5 nm were thus obtained for the 7-, 6-, and 5-repeat DC-SIGNR monolayers, respectively.
Instead of increasing the range of the intersurface repulsion, the presence of the bulky neoglycolipid on the target membrane resulted in the protein monolayers jumping into contact with the membranes, at distances that were smaller than the thickness of unbound protein, DT. Figure 2 shows the force–distance curve measured between the 6-repeat form of DC-SIGNR and a 5 mol % Man9GlcNAc2-DPPE monolayer. The surfaces jump into adhesive contact (left pointing arrow) from membrane separations DJ. In force measurements, surfaces jump to contact when the gradient of the intersurface potential exceeds the spring constant.(26) The jump-in distance DJ, trajectory, and final resting position at contact DC are determined by the spring constant, which was 205 N/m in these measurements. Here, the normalized force at DC is slightly negative (∼−0.1 mN/m). The equilibrium separation Deq is at F = 0 where the attractive and repulsive forces balance.
Figure 2.

Normalized force (Fc/R) as a function of the distance, D, between monolayers of immobilized DC-SIGNR and bilayers containing 5 mol % Man9GlcNAc2-DPPE. (A) The force normalized by the substrate radius Fc/R was measured as a function of distance between the ligand-containing membrane and the 6-repeat form of DC-SIGNR. The filled squares and circles represent two successive measurements at the same sample position. Samples were in buffer maintained at 21.0 ± 0.2 °C. At DJ, the surfaces jump in to contact at the separation DC, indicated by the vertical dashed line. At D < DC, the force increases to the equilibrium separation Deq at F/R = 0 (vertical dashed line). At D < Deq the force then increases more steeply due to steric repulsion between the protein and opposed membrane. (B) Normalized force curve measured with the 6-repeat variant in (A), during approach and separation. The black circles and squares are as in (A). During separation (open circles), the surfaces jump out of contact at DAdh (right pointing arrow).
The DC-SIGNR length variants with 7-, 6-, and 5-neck repeats jumped to contact with the neoglycolipid layers from distances of respectively DJ, 7 = 30.6 ± 1.6 nm, DJ, 6 = 29 ± 1 nm, and DJ, 5 = 23 ± 1 nm to final respective resting positions of DC = 26.6 ± 0.3, 22.4 ± 0.8, and 19.0 ± 0.6 nm (Table 1, Figure 2B, and Figure 3). The jump-in distances are statistically similar to the steric thicknesses of the different length variants, i.e. DJ ∼ DT. Measured values for Deq are 24.8 ± 1.2, 20.4 ± 0.8, and 15.8 ± 1.1 nm for the 7-, 6-, and 5-repeat proteins. The greater uncertainty in determinations of Deq is due to the low force values relative to the measurement uncertainty of ±0.03 and the shallow slopes near Deq, especially with the 5-repeat variant (cf. Figure 3C). In these measurements, the average value of Deq is less than DC by 2.1 ± 0.5 nm (Table 1) due to the relatively soft repulsion at D < Deq. In the majority of the measurements, at D < DC the force curve is nearly flat for ∼1.5 nm (Figure 2), before increasing more steeply.
Table 1. Interaction Distances (nm) between Membranes Displaying Man9GlcNAc2 and DC-SIGNR or DC-SIGNa.
| protein | Dc | Deq | DT | DT – Deq | DAdh |
|---|---|---|---|---|---|
| DC-SIGNR 7 repeat | 26.6 ± 0.8 | 25 ± 1 | 31.5 ± 0.3 | 4.9 ± 0.8 | 28.0 ± 0.4 |
| DC-SIGNR 6 repeat | 22.3 ± 0.7 | 20 ± 1 | 27.6 ± 0.4 | 5.2 ± 0.7 | 24.0 ± 0.7 |
| DC-SIGNR 5 repeat | 18.8 ± 0.7 | 16 ± 1 | 22.4 ± 0.3 | 3.6 ± 0.7 | 19.4 ± 0.5 |
| DC-SIGNb | 28 ± 1 | 26.2 ± 0.8 | 32.8 ± 0.8 | 4.8 ± 1.3 | 30.5 ± 1.5 |
Man9GlcNAc2 was present at 5 mol %. The equilibrium length of the complex is Deq, and the position of bond failure is DAdh. The thickness of unbound DC-SIGNR or DC-SIGN measured in the absence of neoglycolipid is DT.
Values from ref (18).
Figure 3.

Details of advancing, normalized force curves and adhesion measured with the different DC-SIGNR variants. The glycolipid ligand was present at 5 mol %, and separation curves were measured after 8 min of contact. (A) Force–distance profile measured with the 7-repeat variant. Open diamonds were measured during approach, and the filled diamond shows the location and magnitude of the pull-off force at DAdh. (B) Force profile measured with the 6-repeat form of DC-SIGNR. Filled squares indicate forces during approach, and the open square shows the position and magnitude of the pull-off force. (C) Force profile measured with the 5-repeat form of DC-SIGNR. The open triangles were measured during approach and the black triangle shows the force at DAdh. The vertical, dashed lines show the positions of Deq in each case.
This jump-to-contact is evidence of functionally active protein because the mechanical instability, which underlies the jump-in requires an attractive force between the ligand and protein monolayers. Protein inactivation would ablate the attraction. All three DC-SIGNR variants exhibit this jump-to-contact behavior, which was also observed in comparable experiments with DC-SIGN.(18) Furthermore, the observation that both DC and Deq are significantly less than DT, despite the presence of the bulky glycan on the target membrane, is attributed to flexibility in the DC-SIGN structure that enables the proteins to undergo a conformational change upon binding the target neoglycolipid.(18) Such protein flexibility would increase the reaction cross section of the CRDs and hence the range of interaction of the CRDs as well as their ability to bind ligands at different, lateral spatial distributions on target surfaces. Both DC-SIGN and all three DC-SIGNR variants exhibit this flexibility, although it is less apparent with the 5-repeat form of DC-SIGNR, due to the weaker attraction.
Elasticity in the DC-SIGNR/glycolipid complex is also apparent from comparisons of approaching and receding force–distance curves between the various forms of DC-SIGNR and Man9GlcNAc2 membranes. During separation, the bonds fail and the surfaces pull out of contact at the position of the maximum adhesion (DAdh) (Figure 2B, right pointing arrow). For the 7- and 6-repeat forms of DC-SIGNR, DAdh exceeds Deq by 3.5 nm (Table 1, Figures 2B and 3A,B). This difference must result from stretching of the DC-SIGNR/Man9GlcNAc2 complex such that, upon separation, the complexes extend relative to their equilibrium thickness Deq. This may be due, in part, to the reorientation of the carbohydrate ligand. Protein flexibility, which enables the DC-SIGNR variants to jump to contact at DC < DT, would also play a role in this force-dependent stretching.
Comparison of the DC or Deq values for the 7-repeat DC-SIGNR with an exactly equivalent construct for the extracellular domain of DC-SIGN(18) reveals that the average difference of 1.3 nm is larger for DC-SIGN than for DC-SIGNR (p < 0.05, DF = 13; Table 1). In pairwise comparisons, a p value less than 0.05 signifies a statistically significant difference at the 95% confidence level. As noted in Figure 1, differences in the sequence of the neck repeat adjacent to the CRD in DC-SIGNR are postulated to result in the splaying apart of this repeat and the CRDs compared to DC-SIGN (Figure 1B), which would make the bound thickness of DC-SIGN slightly longer than DC-SIGNR.(17) Thus, the force–distance measurements provide experimental evidence to support this model of the differences in the arrangement of the distal portion of the DC-SIGN and DC-SIGNR extracellular domains (Figure 1B).
At D < Deq, the repulsive force increases with decreasing membrane separation (Figures 2 and 3), and the slope reflects the rigidity of the protein–ligand complexes. The slopes of the curves obtained with the 6-repeat and 7-repeat forms, as well as with DC-SIGN,(18) are indicative of relatively rigid protein layers and hence relatively rigid necks (Figure 3A,B). By contrast, the force–distance curve measured with the 5-repeat form at D < Deq is much shallower and does not increase steeply until D < 4–5 nm (Figure 3C), which is the approximate diameter of a folded CRD.(29) The force–distance profile at D > 4 nm is similar to flexible polymers(30) and suggests that the neck region is unstructured in a significant population of the immobilized 5-repeat protein. The difference between the 5-repeat and other forms of DC-SIGNR and DC-SIGN is attributed to the loss of rigidity conferred by the tetramer. Tetramer dissociation into dimers could also lead to greater protein inactivation under applied force. This exception, relative to the behavior of the stable 6- and 7-repeat tetramers, provides evidence that the rigid neck region and relatively steep force profiles at D < Deq (Figure 3A,B) requires stable tetramers.
The adhesion energy per area between DC-SIGNR and 5 mol % Man9GlcNAc2-DPPE monolayers is determined from the pull-off force Fpo at the minimum in the force–distance curve DAdh (Figure 2B) and the Derjaguin–Müller–Toporov model.(28) At the position of bond rupture (Figure 2B, DAdh), the surfaces jump out of contact (Figures 2 and 3, right pointing arrows). There is no evidence of irreversible damage to the membranes due to, for example, lipid pull-out or the rupture of the NTA–hexahistidine linkage. This would be evident in altered force curves measured at the same position after membrane separation, as documented previously.(31) In these studies, upon reapproach after detachment, the measured force curve, DJ, and DC were unchanged (Figure 2). When separating the surfaces, DAdh and the pull-off force were similar within experimental error, even after as many as seven successive measurements at the same contact site. The average time between successive measurements was 10–15 min, which is too short for damaged membranes to heal(31) but more than sufficient to allow re-equilibration, as evidenced by the reversibility of the measurements. The reversibility is expected because this is a multivalent (number of bonds = 4) interaction, and the affinity of individual monomer–glycan bonds is relatively low. Leckband et al.(31) showed that lipid pull-out occurs at receptor–ligand bond energies >∼15kT, which is much higher than the energies of the individual monomer–glycan bonds. Each tetramer is also anchored to the membranes via four hexahistidine anchors.
The adhesion energies per area measured with the 7-repeat and 6-repeat variants are respectively 0.32 ± 0.04 and 0.13 ± 0.03 mJ/m2 (Table 2). When normalized by the protein density on the membranes, the estimated adhesion energies per tetramer are EAdh,7 = 8.0 ± 1.3 kT/molecule and EAdh,6 = 6.9 ± 2.1kT/molecule, respectively (Table 2). Estimating the adhesion energy per DC-SIGNR molecule for the 5-repeat form is not feasible because of the decreased tetramer stability caused by the truncation associated with the addition of the histidine tag employed in these force measurements.(19)
Table 2. Adhesion Energies of DC-SIGN and DC-SIGNR Variants.
| protein | Fpo/R, mN/m | EAdh, mJ/m2 | EAdh, kT/molecule | EAdh, kT/monomer |
|---|---|---|---|---|
| DC-SIGNR 7 repeat | –2.0 ± 0.3 | 0.32 ± 0.04 | 8.0 ± 1.3 | 2.0 ± 0.3 |
| DC-SIGNR 6 repeat | –0.8 ± 0.2 | 0.13 ± 0.03 | 6.9 ± 2.1 | 1.7 ± 0.5 |
| DC-SIGNa | –2.0 ± 0.4 | 0.39 ± 0.05 | 8.2 ± 1.4 | 2.0 ± 0.4 |
Values from ref (18).
Comparing the estimated, population-averaged adhesion energy per monomer (Figure 4A) may provide a better basis for comparison of adhesion by the different DC-SIGNR forms. The calculated energies per monomer for the 7-repeat and 6-repeat forms are 2.0 ± 0.2 and 1.7 ± 0.4 kT/monomer, respectively. These values are statistically similar (p value = 0.7, DF = 12). They are also similar to the adhesion energy per DC-SIGN monomer of 2.0 ± 0.3 kT/monomer (p value = 0.3, DF = 18) after 8 min of contact.(18) However, the calculated adhesion energy per monomer for the 5-repeat DC-SIGNR is 0.2 ± 0.1 kT/monomer.
Figure 4.

Dependence of DC-SIGNR and DC-SIGN thickness and adhesion on the number of neck repeats. (A) Population-averaged adhesion energy per monomer as a function of the number of neck repeats in DC-SIGNR. The open circles indicate the adhesion energy per DC-SIGNR monomer and the black square represents the adhesion energy per DC-SIGN monomer, measured after 8 min of contact with the ligand surface. Adhesion data are from Table 2. (B) Thickness of the DC-SIGNR–glycan complex as a function of the number of neck repeats in DC-SIGNR. Least-squares analysis of the data from Table 1 (N = 23) yields a slope of 3.87 ± 0.23 nm/repeat.
The much lower adhesion mediated by the 5-repeat DC-SIGNR might at first be unexpected, since the CRDs fold autonomously and appear to be fully functional based on solution binding data and on affinity purification.(20) Hydrodynamic measurements show that this protein forms mixture of interconverting dimers and tetramers. However, some of the 5-repeat DC-SIGNR proteins may not be optimally oriented for binding, and it is possible that the dimers are more prone to unfolding under an applied force. Both factors would reduce the adhesion. The softer repulsion (shallow, repulsive force at D < DC) is also attributed to the mixture of dimers and tetramers.
The 5-repeat DC-SIGNR shows completely different behavior in the force measurements relative to the 6- and 7-repeat forms. Viewed in this way, these findings provide important confirmation that the force measurements with the longer versions of DC-SIGNR reflect the interactions of rigid, stable tetramers that orient perpendicular to the membrane.
The force–distance measurements quantify the molecular dimensions of the DC-SIGNR-Man9GlcNAc2 complex and thus provide direct evidence for an extended configuration of the extracellular domain of DC-SIGNR. At initial contact, the length of the 7-repeat form of DC-SIGNR complexed with the glycan is DC = 26.6 ± 0.8 nm (Table 1). Modeling of the structure of the extracellular domain of DC-SIGNR bound to a Man9GlcNAc2 oligosaccharide(17) suggests that the overall length of the ligand complex of the DC-SIGNR fragment used in the force–distance measurements would be 26.5–27.0 nm, which agrees quite well with the measurements reported here. The crystallographic and force–distance measurements also agree well with hydrodynamic measurement on the extracellular domains and the isolated neck domains.19,32 The equilibrium thickness is smaller at ∼25 nm but still comparable to the model prediction.
The slope of the line relating the distances at initial contact DC and the number of neck repeats gives a value of 3.87 ± 0.23 nm/repeat (N = 22) (Figure 3B), which matches almost exactly the length of 3.7 nm for a single repeat determined from the crystallographic analysis of the isolated neck region.(17) A similar plot of Deq versus the number of repeats is shifted slightly, but the calculated slope is 3.6 ± 1.4 (N = 22). The larger error in the latter reflects the greater uncertainty in the estimated value of Deq, as discussed above. However, the comparative length measurements presented here provide exceptionally important direct experimental evidence that the neck repeat structure, which is observed essentially as a fragment out of context in the crystal structure, is an accurate reflection of the conformation of the neck in the intact molecule.
Conclusions
The force measurements show that, in the 6- and 7-repeat versions of DC-SIGNR, stable tetramers form a rigid neck region that projects the CRDs away from the membrane, ensuring strong, multivalent adhesion to the target membrane. These variants have comparable adhesion energies and solution binding affinities. However, disruption of the tetramer in the 5-repeat variant both produces a more flexible/compressible molecule and substantially reduces the adhesion. Further, loss of neck repeats in this variant reduces the extension of the CRDs from the membrane surface—a feature that could reduce access to pathogens.
The close correspondence between the measured 3.7 nm length of individual repeats in the neck domains obtained from the crystallographic and force–distance measurements strongly reinforces proposed models for the organization of the extracellular domain with extended neck regions.(17) Hydrodynamic measurements and crystal structures of fragments of the extracellular portions of DC-SIGN and DC-SIGNR generated predictions that the CRDs in these two receptors would be positioned differently, in part due to differences within the final neck repeat adjacent to the CRD that would lead to splaying apart of the CRDs in DC-SIGNR.17,19,32,33 The force–distance measurements provide experimental evidence that, although these receptors are very similar, they differ in overall length and thus in the disposition of the CRDs.
Glossary
Abbreviations
- HIV
human immunodeficiency virus
- CRD
carbohydrate-recognition domain
- DPPE
1,2-dipalmitoyl-sn-glycero-3 phosphoethanolamine
- DTPC
1,2-ditridecanoyl-sn-glycero-3-phosphocholine
- NTA-TRIG-DLGE
6-[9-[2,3-Bis(dodecyloxy)propyl]-3,6,9-trioxanonyl-1-oxycarboxylamino]-2-[di(carboxymethyl)amino]hexanoic acid.
Supporting Information Available
Details of the protein surface coverage determinations from SPR data and the force–distance measurements between protein monolayers and bare lipid membranes without neoglycolipid. This material is available free of charge via the Internet at http://pubs.acs.org.
This work was supported by the Reid T. Milner Professorship (D.E.L.) and by Wellcome Trust Grant 075565 (K.D. and M.E.T.).
Author Present Address
∥ Department of Physical Chemistry, Klingelbergstrasse 80, University of Basel, 4056 Basel, Switzerland.
Author Present Address
⊥ Merck Sharp & Dohme Research Laboratories, Rahway, NJ 07065.
Supplementary Material
References
- Bashirova A.; Geijtenbeek T.; van Duijnhoven G.; van Vliet S.; Eilering J.; Martin M.; Wu L.; Martin T.; Viebig N.; Knolle P.; KewalRamani V.; van Kooyk Y.; Carrington M. (2001) A dendritic cell-specific intercellular adhesion molecule 3-grabbing nonintegrin (DC-SIGN)-related protein is highly expressed on human liver sinusoidal endothelial cells and promotes HIV-1 infection. J. Exp. Med. 193, 671–678. [DOI] [PMC free article] [PubMed] [Google Scholar]
- Pohlmann S.; Soilleux E. J.; Baribaud F.; Leslie G. J.; Morris L. S.; Trowsdale J.; Lee B.; Coleman N.; Doms R. W. (2001) DC-SIGNR, a DC-SIGN homologue expressed in endothelial cells, binds to human and simian immunodeficiency viruses and activates infection in trans. Proc. Natl. Acad. Sci. U. S. A. 98, 2670–2675. [DOI] [PMC free article] [PubMed] [Google Scholar]
- Soilleux E. J.; Morris L. S.; Rushbrook S.; Lee B.; Coleman N. (2002) Expression of human immunodeficiency virus (HIV)-binding lectin DC-SIGNR: Consequences for HIV infection and immunity. Hum. Pathol. 33, 652–659. [DOI] [PubMed] [Google Scholar]
- Simmons G.; Reeves J.; Grogan C.; Vandenberghe L.; Baribaud F.; Whitbeck J.; Burke E.; Buchmeier M.; Soilleux E.; Riley J.; Doms R.; Bates P.; Pohlmann S. (2003) DC-SIGN and DC-SIGNR bind Ebola glycoproteins and enhance infection of macrophages and endothelial cells. Virology 305, 115–123. [DOI] [PubMed] [Google Scholar]
- Davis C. W.; Nguyen H. Y.; Hanna S. L.; Sanchez M. D.; Doms R. W.; Pierson T. C. (2006) West Nile virus discriminates between DC-SIGN and DC-SIGNR for cellular attachment and infection. J. Virol. 80, 1290–1301. [DOI] [PMC free article] [PubMed] [Google Scholar]
- Khoo U. S.; Chan K. Y.; Chan V. S.; Lin C. L. (2008) DC-SIGN and L-SIGN: the SIGNs for infection. J. Mol. Med. 86, 861–874. [DOI] [PMC free article] [PubMed] [Google Scholar]
- Gardner J. P.; Durso R. J.; Arrigale R. R.; Donovan G. P.; Maddon P. J.; Dragic T.; Olson W. C. (2003) L-SIGN (CD 209L) is a liver-specific capture receptor for hepatitis C virus. Proc. Natl. Acad. Sci. U. S. A. 100, 4498–4503. [DOI] [PMC free article] [PubMed] [Google Scholar]
- Soilleux E. J. (2003) DC-SIGN (dendritic cell-specific ICAM-grabbing non-integrin) and DC-SIGN-related (DC-SIGNR): friend or foe?. Clin. Sci. 104, 437–446. [DOI] [PubMed] [Google Scholar]
- Guo Y.; Feinberg H.; Conroy E.; Mitchell D.; Alvarez R.; Blixt O.; Taylor M.; Weis W.; Drickamer K. (2004) Structural basis for distinct ligand-binding and targeting properties of the receptors DC-SIGN and DC-SIGNR. Nat. Struct. Mol. Biol. 11, 591–598. [DOI] [PubMed] [Google Scholar]
- Meyer S.; van Liempt E.; Imberty A.; van Kooyk Y.; Geyer H.; Geyer R.; van Die I. (2005) DC-SIGN mediates binding of dendritic cells to authentic pseudo-LewisY glycolipids of Schistosoma mansoni cercariae, the first parasite-specific ligand of DC-SIGN. J. Biol. Chem. 280, 37349–37359. [DOI] [PubMed] [Google Scholar]
- Meyer S.; Tefsen B.; Imberty A.; Geyer R.; van Die I. (2007) The C-type lectin L-SIGN differentially recognizes glycan antigens on egg glycosphingolipids and soluble egg glycoproteins from Schistosoma mansoni. Glycobiology 17, 1104–1119. [DOI] [PMC free article] [PubMed] [Google Scholar]
- Lichterfeld M.; Nischalke H. D.; van Lunzen J.; Sohne J.; Schmeisser N.; Woitas R.; Sauerbruch T.; Rockstroh J. K.; Spengler U. (2003) The tandem-repeat polymorphism of the DC-SIGNR gene does not affect the susceptibility to HIV infection and the progression to AIDS. Clin. Immunol. 107, 55–59. [DOI] [PubMed] [Google Scholar]
- Liu H.; Carrington M.; Wang C.; Holte S.; Lee J.; Greene B.; Hladik F.; Koelle D. M.; Wald A.; Kurosawa K.; Rinaldo C. R.; Celum C.; Detels R.; Corey L.; McElrath M. J.; Zhu T. (2006) Repeat-region polymorphisms in the gene for the dendritic cell-specific intercellular adhesion molecule-3-grabbing nonintegrin-related molecule: effects on HIV-1 susceptibility. J. Infect. Dis 193, 698–702. [DOI] [PubMed] [Google Scholar]
- Liu Y.; Chai W.; Childs R. A.; Feizi T. (2006) Preparation of neoglycolipids with ring-closed cores via chemoselective oxime-ligation for microarray analysis of carbohydrate-protein interactions. Methods Enzymol. 415, 326–340. [DOI] [PubMed] [Google Scholar]
- Nattermann J.; Ahlenstiel G.; Berg T.; Feldmann G.; Nischalke H. D.; Muller T.; Rockstroh J.; Woitas R.; Sauerbruch T.; Spengler U. (2006) The tandem-repeat polymorphism of the DC-SIGNR gene in HCV infection. J. Viral Hepat. 13, 42–46. [DOI] [PubMed] [Google Scholar]
- Chan V. S.; Chan K. Y.; Chen Y.; Poon L. L.; Cheung A. N.; Zheng B.; Chan K. H.; Mak W.; Ngan H. Y.; Xu X.; Screaton G.; Tam P. K.; Austyn J. M.; Chan L. C.; Yip S. P.; Peiris M.; Khoo U. S.; Lin C. L. (2006) Homozygous L-SIGN (CLEC4M) plays a protective role in SARS coronavirus infection. Nature Genet. 38, 38–46. [DOI] [PMC free article] [PubMed] [Google Scholar]
- Feinberg H.; Tso C. K.; Taylor M. E.; Drickamer K.; Weis W. I. (2009) Segmented helical structure of the neck region of the glycan-binding receptor DC-SIGNR. J. Mol. Biol. 394, 613–620. [DOI] [PMC free article] [PubMed] [Google Scholar]
- Menon S.; Rosenberg K.; Graham S. A.; Ward E. M.; Taylor M. E.; Drickamer K.; Leckband D. E. (2009) Binding-site geometry and flexibility in DC-SIGN demonstrated with surface force measurements. Proc. Natl. Acad. Sci. U. S. A. 106, 11524–11529. [DOI] [PMC free article] [PubMed] [Google Scholar]
- Guo Y.; Atkinson C. E.; Taylor M. E.; Drickamer K. (2006) All but the shortest polymorphic forms of the viral receptor DC-SIGNR assemble into stable homo- and heterotetramers. J. Biol. Chem. 281, 16794–16798. [DOI] [PubMed] [Google Scholar]
- Mitchell D. A.; Fadden A. J.; Drickamer K. (2001) A novel mechanism of carbohydrate recognition by the C-type lectins DC-SIGN and DC-SIGNR. Subunit organization and binding to multivalent ligands. J. Biol. Chem. 276, 28939–28945. [DOI] [PubMed] [Google Scholar]
- Lavrik N.; Leckband D. (2000) Optical and direct force measurements of the interaction between monolayers of aromatic macrocycles on surfactant monolayers. Langmuir 16, 1842–1851. [Google Scholar]
- Ball V.; Ramsden J. J. (1998) Influence of D(-) and L(+) tartaric acid on lysozyme adsorption onto a Si(Ti)-O2 surface. Naturwissenschaften 85, 87–89. [DOI] [PubMed] [Google Scholar]
- Voros J. (2004) The density and refractive index of adsorbing protein layers. Biophys. J. 57, 553–561. [DOI] [PMC free article] [PubMed] [Google Scholar]
- Bartlett G. (1959) Phosphorus assay in column chromatography. J. Biol. Chem. 234, 466–468. [PubMed] [Google Scholar]
- Israelachvili J. (1973) Thin film studies using multiple-beam interferometry. J. Colloid Interface Sci. 44, 259–272. [Google Scholar]
- Marra J.; Israelachvili J. (1985) Direct measurements of forces between phosphatidylcholine and phosphatidylethanolamine bilayers in aqueous electrolyte solutions. Biochemistry 24, 4608–4618. [DOI] [PubMed] [Google Scholar]
- Martel L.; Johnson C.; Boutet S.; al-Kurdi R.; Konavalov O.; Robinson I.; Leckband D.; Legrand J. (2002) X-ray reflectivity investigations of two-dimensional assemblies of C-cadherins: First steps in structural and functional studies. J. Phys. IV 12, 365–377. [Google Scholar]
- Israelachvili J. (1992) Intermolecular and Surface Forces, 2nd ed., Academic Press, New York. [Google Scholar]
- Weis W. I.; Kahn R.; Fourme R.; Drickamer K.; Hendrickson W. A. (1991) Structure of the calcium-dependent lectin domain from a rat mannose-binding protein determined by MAD phasing. Science 254, 1608–1615. [DOI] [PubMed] [Google Scholar]
- Wong J.; Kuhl T.; Israelachvili J.; Mullah N.; Zalipsky S. (1997) Direct measurement of a tethered ligand-receptor interaction potential. Science 275, 820–822. [DOI] [PubMed] [Google Scholar]
- Leckband D.; Muller W.; Schmitt F. J.; Ringsdorf H. (1995) Molecular mechanisms determining the strength of receptor-mediated intermembrane adhesion. Biophys. J. 69, 1162–1169. [DOI] [PMC free article] [PubMed] [Google Scholar]
- Yu Q. D.; Oldring A. P.; Powlesland A. S.; Tso C. K.; Yang C.; Drickamer K.; Taylor M. E. (2009) Autonomous tetramerization domains in the glycan-binding receptors DC-SIGN and DC-SIGNR. J. Mol. Biol. 387, 1075–1080. [DOI] [PMC free article] [PubMed] [Google Scholar]
- Feinberg H.; Guo Y.; Mitchell D.; Drickamer K.; Weis W. (2005) Extended neck regions stabilize tetramers of the receptors DC-SIGN and DC-SIGNR. J. Biol. Chem. 280, 1327–1335. [DOI] [PubMed] [Google Scholar]
Associated Data
This section collects any data citations, data availability statements, or supplementary materials included in this article.