

Abstract
Summary: YADA can deisotope and decharge high-resolution mass spectra from large peptide molecules, link the precursor monoisotopic peak information to the corresponding tandem mass spectrum, and account for different co-fragmenting ion species (multiplexed spectra). We describe how YADA enables a pipeline consisting of ProLuCID and DTASelect for analyzing large-scale middle-down proteomics data.
Availability: http://fields.scripps.edu/yada
Contact: paulo@pcarvalho.com
Supplementary information: Supplementary data are available at Bioinformatics online.
1 INTRODUCTION
High-resolution, high-mass-accuracy (<10 p.p.m. error) mass spectrometry allows highly charged peptide isotopic peaks to be distinguished from one another, thus enabling the calculation of their precise charge states and monoisotopic masses. This is crucial for confident protein identification, especially when dealing with large molecules, such as the ones usually obtained from transmembrane protein digests. Other key advantages when analyzing large molecules include an increased identification coverage and the possibility of assessing relationships among multiple modifications in the same molecule (e.g. histone; Chi et al., 2007). These motivations have given rise to a new proteomics platform, termed middle-down (MD) proteomics, which focuses on large molecules usually obtained through proteases other than trypsin or by modifying the digestion protocols (e.g. short-time trypsin digests; Forbes et al., 2001).
Traditional protein identification search engines [e.g. SEQUEST (Eng et al., 1994) and Mascot (Perkins et al., 1999)] cannot take full advantage of high-resolution mass spectra, especially those of large molecules, mainly because of three reasons: (i) The specific peak in an isotopic envelope being selected for fragmentation can have a significant difference in mass as compared with its monoisotope; this can lead the search engine astray. (ii) Fragmenting highly charged precursors results in highly charged daughter ions. If the charge states of the latter are unknown, all charge state hypotheses should be considered for protein identification, resulting in a combinatorial explosion that can burden the search engine severely and decrease chances of a successful identification. (iii) Approximately 10% of all tandem spectra from complex mixtures are composed of different ion species that are co-fragmenting; only one of these ion species is searched (Carvalho et al., 2009).
In order to overcome these limitations, we introduce YADA, a tool that can deconvolute (i.e. deisotope and decharge) high-resolution spectral data of peptide ions having charges up to +18 or masses up to 20 kDa. Because deconvolution entails the assignment of a charge state and the recalculation of the m/z's as if the charge were +1 (decharging), the combinatorial explosion problem mentioned above is automatically eliminated. YADA can also update the MS2 to reflect the fragmented precursor monoisotopic mass by locating its corresponding isotopic envelope in the MS1 and replacing its m/z with the monoisotopic m/z. Accordingly, multiple precursors can be considered when peaks from different isotopic envelopes are found within the precursor isolation bounds; this enables the accounting for multiplexed spectra. As far as we know, no other freely available deisotoping and decharging tools offer both features.
We describe a freely available pipeline to address large-scale MD studies consisting of YADA; ProLuCID, a protein identification search engine that is ready to efficiently handle deconvoluted spectra (Xu et al., 2006); and DTASelect, which controls and estimates the false discovery rates (Cociorva et al., 2007). Again, we are aware of no freely available solution for such in the context of MD. Our pipeline is evaluated on a short-time trypsin digest of a yeast lysate. The results are compared with those obtained by replacing YADA with Xtract (Thermo, San Jose, CA, USA), a software for decharging based on the THRASH algorithm (Horn et al., 2000), which is also present in a commercial solution for MD analysis [Thermo's ProsightPC v2.0 (Boyne et al., 2009)].
2 ALGORITHM
2.1 Peak filtering
YADA filters noise peaks and peaks that can be eliminated without compromising isotopic envelope recognition. Filtering increases speed (by up to 40%), reduces RAM requirements and improves charge assignment (by ∼5%; data not shown). It is accomplished in two steps, as follows.
The first step eliminates peaks that fall below an intensity threshold. The threshold can by default be a user-specified hard cutoff, or else be automatically determined for each spectrum (recommended for top-down datasets). The latter is accomplished by treating each mass spectrum as a two-component probability mixture model. The premises are that the noise peaks have intensities that follow a normal distribution; and that peptide-derived peaks have considerably higher intensities which, though to a lesser extent than the noise peaks, can also be assumed to follow a normal distribution. Given these, the well-established expectation–maximization (EM) algorithm is employed to maximize the likelihood of the observed intensity histogram under the assumed bimodal normal distribution. The two EM seeds (starting points) are chosen by sorting the intensities of all peaks and choosing the ones that, globally, rank at 10% and 90%. Given the two normal distributions provided by EM, the threshold is equal to that of the optimal Bayesian classifier.
The second step discards peaks that do not contribute to charge determination. The premise in this case is that the intensities of peaks derived from a peptide ion isotope will monotonically increase until a local maximum is achieved, at which point they will monotonically decrease. The algorithm proceeds as follows. Mass spectral peaks are sorted by increasing m/z and an empty result array is created. Then, for every peak, if its intensity is greater than that of the previous peak and the two differ in m/z by less than a given p.p.m. tolerance (e.g. 30 p.p.m.), then the current peak replaces the latest peak included in the result array; otherwise the peak is simply included in the result array. Then the spectral peaks are sorted by decreasing m/z and the process is repeated.
2.2 Detecting and decharging an isotopic envelope
All peaks are candidate seeds for an isotopic envelope. Briefly, for a given peak, first a peak-finding algorithm is employed to integrate peak intensities by stepping a distance of 1.0024 divided by a charge state hypothesis, for several charge state hypotheses (e.g. +1 through +21). Second, only the charge state hypothesis to have found the greatest number of sequential peaks and having the greatest accumulated intensity is retained. The observed profile is normalized to 1 and its dot product with a normalized averagine theoretical profile for the estimated mass (obtained using a kernel regressor) is computed. If the dot product is above a given threshold, the envelope is stored. The candidate envelope is discarded if verified to be part of an existing envelope of the same charge or one that would produce an overlapping envelope (e.g. +4 and +2). The algorithm is not subtractive and is capable of identifying overlapping envelopes.
2.3 Decharging, clustering and accounting for multiplexed spectra
It is common to observe the same peptide ion species with different charge states in the same spectrum. After deconvolution, these peptides yield peaks that are very close (e.g. <0.2 Da apart for a given resolution) to one another. YADA automatically coalesces them by averaging their masses and summing their intensities.
Also, in complex samples, it is common to have more than one ion species in the same isolation window to be fragmented when generating a tandem mass spectrum. YADA uses isotopic envelope information from the preceding MS1 to assign a monoisotopic precursor mass to the MS2 spectrum and to consider multiple ion species within the isolation window bounds (multiplexed spectra).
3 RESULTS
A 30 min trypsin digest of a yeast lysate was analyzed with a 2 h LC-MS run, acquiring one high-resolution MS1 (60 000 resolution at 400 m/z) followed by three high-resolution ETD-MS2 scans on the Orbitrap (Makarov, 2000) in data-dependent mode (10 071 spectra). The spectra were extracted using RawExtract (McDonald et al., 2004) and processed by YADA (with and without monoisotopic correction and multiplexing), ProLuCID (protein identification) and DTASelect. The latter ensures a peptide false discovery rate <1% against a decoy database. An example of a multiplexed spectrum solved by YADA (Supplementary Fig. S1) and further details regarding the search parameters and false discovery rate estimation are presented in the Supplementary Material. For evaluation purposes, an in-house script was created to use Xtract to deconvolute the data and replace YADA in our pipeline. The results are presented in Table 1. YADA turned out to be ∼600% faster than the commercial software during deconvolution (YADA: 6′ 31″; Xtract: 42′ 24″; both on a 1 GHz Athlon with 1 GB RAM).
Table 1.
Results
| Xtract | Y | Y with Corr | |
|---|---|---|---|
| Number of identified spectra | 898 | 996 | 1071 |
| Fraction of identified spectra with non-monoisotopic precursor assigned (%) | 74 | 75 | 1 |
Y stands for YADA, Corr for monoisotopic correction and multiplexing.
4 FINAL CONSIDERATIONS
While previous tools (Chen and Yap, 2008; Horn et al., 2000) are devoted solely to deconvolution, YADA's hallmark is its ability to maximize the results of large-scale experiments by quickly deconvoluting highly charged MD MS2 spectra and accounting for multiple precursors (multiplexed spectra).
We also note that, although it has been shown that assigning monoisotopic precursor masses to MS2's increases protein identification confidence (Mayampurath et al., 2008), MD poses a new challenge. This is so because large molecules (>12 kDa) often have the monoisotopic peak intensity below the detection sensitivity. Previous strategies have relied only on detected peaks, but YADA can predict a large molecule's undetected monoisotopic peak by considering its three most intense envelope peaks and estimating the monoisotopic mass according to an averagine model.
We have also described a freely available pipeline for analyzing high-resolution tandem mass spectra of large peptide molecules. The pipeline can be used for datasets containing high-resolution MS1 and MS2 spectra, or only a high-resolution MS1. In the case of the later, the MS2 cannot be deconvoluted; however, identification results can still be improved by assigning monoisotopic masses. The key steps are listed in Figure 1.
Fig. 1.
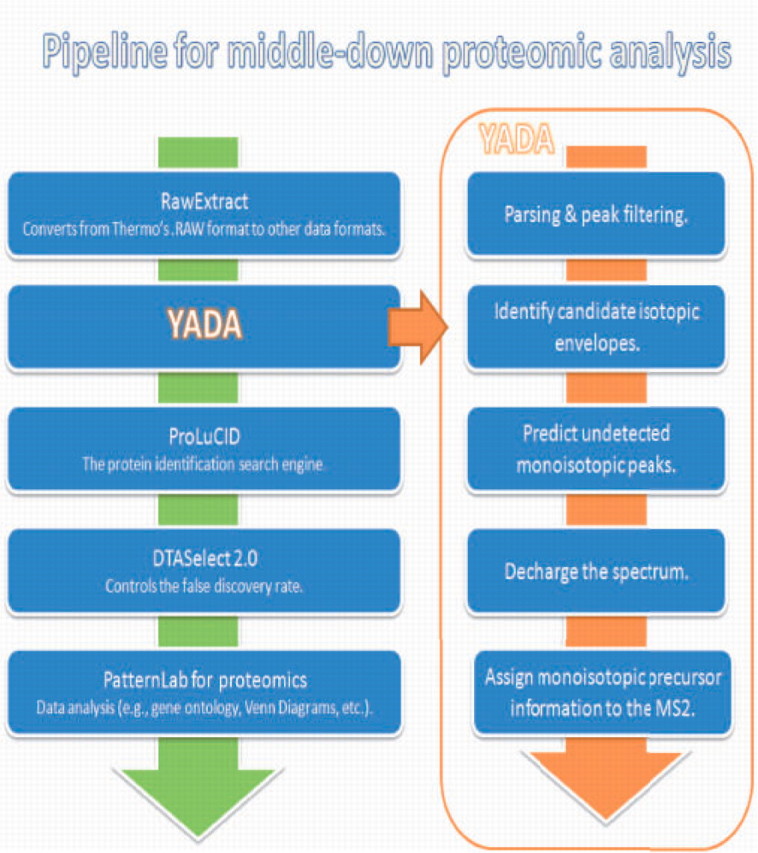
The key steps of the proposed pipeline for middle-down proteomic analysis.
YADA is coded in C# and requires a PC with Windows XP SP2 or later and .NET 3.5. It installs under the directory PatternLab for proteomics (Carvalho et al., 2008). The windows version can be downloaded at our web site (http://fields.scripps.edu). A command-line version (requires MONO; http://mono-project.com), executable on Windows or Linux, is available upon request.
YADA's current version is not recommended for the analysis of isotopically labeled datasets, since in these cases the isotopic distribution patterns may differ from the theoretically predicted.
Funding: This work was supported by Coordenação de Aperfeiçoamento de Pessoal de Nível Superior (CAPES), Conselho Nacional de Desenvolvimento Científico e Tecnológico (CNPq), Fundação Carlos Chagas Filho de Amparo à Pesquisa do Estado do Rio de Janeiro (a FAPERJ BBP grant), and the National Institutes of Health [P41RR011823, ROI MH06880].
Conflict of Interest: none declared.
Supplementary Material
REFERENCES
- Boyne MT, et al. Tandem mass spectrometry with ultrahigh mass accuracy clarifies peptide identification by database retrieval. J. Proteome Res. 2009;8:374–379. doi: 10.1021/pr800635m. [DOI] [PMC free article] [PubMed] [Google Scholar]
- Carvalho PC, et al. Charge prediction machine: tool for inferring precursor charge states of electron transfer dissociation tandem mass spectra. Anal. Chem. 2009;81:1996–2003. doi: 10.1021/ac8025288. [DOI] [PMC free article] [PubMed] [Google Scholar]
- Carvalho PC, et al. PatternLab for proteomics: a tool for differential shotgun proteomics. BMC Bioinformatics. 2008;9:316. doi: 10.1186/1471-2105-9-316. [DOI] [PMC free article] [PubMed] [Google Scholar]
- Chen L, Yap YL. Automated charge state determination of complex isotope-resolved mass spectra by peak-target Fourier transform. J. Am. Soc. Mass Spectrom. 2008;19:46–54. doi: 10.1016/j.jasms.2007.10.015. [DOI] [PubMed] [Google Scholar]
- Chi A, et al. Analysis of phosphorylation sites on proteins from Saccharomyces cerevisiae by electron transfer dissociation (ETD) mass spectrometry. Proc. Natl Acad. Sci. USA. 2007;104:2193–2198. doi: 10.1073/pnas.0607084104. [DOI] [PMC free article] [PubMed] [Google Scholar]
- Cociorva D, et al. Validation of tandem mass spectrometry database search results using DTASelect. Curr. Protoc. Bioinformatics. 2007 doi: 10.1002/0471250953.bi1304s16. Chapter 13, Unit 13.4. [DOI] [PubMed] [Google Scholar]
- Eng JK, et al. An approach to correlate tandem mass spectral data of peptides with amino acid sequences in a protein database. J. Am. Soc. Mass Spectrom. 1994;5:976–989. doi: 10.1016/1044-0305(94)80016-2. [DOI] [PubMed] [Google Scholar]
- Forbes AJ, et al. Toward efficient analysis of >70 kDa proteins with 100% sequence coverage. Proteomics. 2001;1:927–933. doi: 10.1002/1615-9861(200108)1:8<927::AID-PROT927>3.0.CO;2-T. [DOI] [PubMed] [Google Scholar]
- Horn DM, et al. Automated reduction and interpretation of high resolution electrospray mass spectra of large molecules. J. Am. Soc. Mass Spectrom. 2000;11:320–332. doi: 10.1016/s1044-0305(99)00157-9. [DOI] [PubMed] [Google Scholar]
- Makarov A. Electrostatic axially harmonic orbital trapping: a high-performance technique of mass analysis. Anal. Chem. 2000;72:1156–1162. doi: 10.1021/ac991131p. [DOI] [PubMed] [Google Scholar]
- Mayampurath AM, et al. DeconMSn: a software tool for accurate parent ion monoisotopic mass determination for tandem mass spectra. Bioinformatics. 2008;24:1021–1023. doi: 10.1093/bioinformatics/btn063. [DOI] [PMC free article] [PubMed] [Google Scholar]
- McDonald WH, et al. MS1, MS2, and SQT-three unified, compact, and easily parsed file formats for the storage of shotgun proteomic spectra and identifications. Rapid Commun. Mass Spectrom. 2004;18:2162–2168. doi: 10.1002/rcm.1603. [DOI] [PubMed] [Google Scholar]
- Perkins DN, et al. Probability-based protein identification by searching sequence databases using mass spectrometry data. Electrophoresis. 1999;20:3551–3567. doi: 10.1002/(SICI)1522-2683(19991201)20:18<3551::AID-ELPS3551>3.0.CO;2-2. [DOI] [PubMed] [Google Scholar]
- Xu T, et al. ProLuCID, a fast and sensitive tandem mass spectra-based protein identification program. Mol. Cell. Proteomics. 2006;5:S174. [Google Scholar]
Associated Data
This section collects any data citations, data availability statements, or supplementary materials included in this article.