

Abstract
Impaired axonal transport may play a key role in Parkinson's disease. To test this notion, a microchamber system was adapted to segregate axons from cell bodies using green fluorescent protein-labeled mouse dopamine (DA) neurons. Transport was examined in axons challenged with the DA neurotoxin, 1-methyl-4-phenylpyridinium ion (MPP+). MPP+ rapidly reduced overall mitochondrial motility in DA axons; among motile mitochondria, anterograde transport was slower yet retrograde transport was increased. Transport effects were specific for DA mitochondria, which were smaller and transported more slowly than their non-DA counterparts. MPP+ did not affect synaptophysin-tagged vesicles or any other measureable moving particle. Toxin effects on DA mitochondria were not dependent upon ATP, calcium, free radical species, JNK, or caspase3/PKC pathways but were completely blocked by the thiol-anti-oxidant N-acetyl-cysteine or membrane-permeable glutathione. Since these drugs also rescued processes from degeneration, these findings emphasize the need to develop therapeutics aimed at axons as well as cell bodies to preserve “normal” circuitry and function as long as possible.
Introduction
Impaired axonal transport plays an important role in a variety of neurodegenerative disorders, including Parkinson disease (PD) (De Vos et al., 2008). Postmortem studies on PD patients show widespread axonal pathology that appears to precede the loss of cell bodies (Orimo et al., 2008), supporting the notion that nigral neurons degenerate through a “dying back” axonopathy (Raff et al., 2002). Animal models of PD-linked genes also point to axonal impairment as being a critical factor. For example, transgenic mice expressing the PD-linked R1441G LRRK2 mutation exhibit decreased dopamine (DA) terminal fields together with increased dystrophic processes and abnormal axonal swellings, findings consistent with DA axonopathy (Li et al., 2009). Reduced axonal transport is also seen with α-synuclein mutants, which accumulate in the cell soma when overexpressed in cortical neurons (Saha et al., 2004). Moreover, vesicle-associated α-synuclein binds to microtubule motor proteins like kinesin and dynein, underscoring a potential role in microtubule-dependent axonal transport (Yang et al., 2010). In addition, genetic mutations in Parkin, an E3 ligase, and PINK1, a mitochondrially targeted kinase, lead to impaired mitochondrial dynamics, resulting in altered transport and distribution of mitochondria as well as loss of synaptic function (Bueler, 2009). PINK1 can also form a complex with Miro and Milton (Weihofen et al., 2009), proteins known to recruit kinesin to the mitochondria and promote motility along microtubule tracks (Reis et al., 2009). Thus, these PD-linked mutations are consistent with the idea that axonal dysfunction plays an early and significant role in the disorder.
Environmental toxins mimicking PD such as N-methyl-4-phenyl-1,2,3,6-tetrahydropyridine (MPTP) or its active derivative, 1-methyl-4-phenylpyridinium ion (MPP+), also disrupt axonal function. MPTP-treated monkeys (Meissner et al., 2003) or mice (Serra et al., 2002) first lose DA terminal fields and then exhibit cell body loss. Moreover, Wallerian degeneration slow (WldS) mutant mice rescue DA projections in MPTP-treated animals but not cell bodies, emphasizing the independence of cell body function versus axon specialization (Hasbani and O'Malley, 2006). In addition, MPP+ can directly inhibit axon transport in the squid axoplasm (Morfini et al., 2007). Although the mechanisms underlying the latter response are unclear, in vertebrate models MPP+ depolymerizes microtubules, leading to axon fragmentation and decreased synaptic function (Cappelletti et al., 2005; Cartelli et al., 2010).
Difficulty in assessing real-time changes in DA axons has precluded testing models of structural or trafficking impairment. Although much can be learned from the squid giant axon, this system as well as studies in vertebrate peripheral, cortical, or other non-DA cell types (Cartelli et al., 2010), may be unrepresentative of a bona fide DA neuron. Recently, we have adapted a microchamber system in which axons are segregated to one side, leaving cell bodies and dendrites on the other. When used with GFP-labeled DA neurons derived from genetically engineered mice, DA axons can be examined using targeted fluorescent markers and time lapse imaging. Using these chambers, here we show that MPP+ specifically decreases mitochondrial movement in DA axons. We also explore potential mechanisms underlying the effect of MPP+ on mitochondrial transport in DA axons.
Materials and Methods
Cell culture and microchamber devices.
Murine mesencephalic cultures were prepared, treated with toxin for indicated time periods, then fixed and stained for tyrosine hydroxylase (TH) as described previously (Lotharius et al., 1999). TH-positive cell bodies and neurites were counted using Stereo Investigator (MBF Bioscience). DA/GFP cultures were prepared from embryonic day 14 Tg(TH-EGFP)DJ76GSAT transgenic mice (Gene Expression Nervous System Atlas, National Institutes of Health, Bethesda, MD). Typically DA/GFP males were mated with wild-type females. Brains isolated from the resulting embryos were screened for GFP fluorescence before midbrain dissection. GFP-positive tissue was pooled and plated. Microchamber devices were modified from Ivins et al. (1998). Briefly, 20 mm glass bottom culture dishes (MatTek) were coated with 100 μg/ml Matrigel (BD Bioscience), rinsed with DMEM/F-12, and dried. A polytetrafluoroethylene Teflon tubing [17 (outside diameter) × 13 (inside diameter) × 2 (wall thickness) × 5 mm (length)] was cut in half and attached to the bottom of the dish using sterile vacuum grease. A rectangular glass coverslip (9 × 18 mm) was sandwiched between both pieces of Teflon and sealed in place with a Matrigel/collagen complex (1 mg/ml collagen type I, 3 mg/ml Matrigel, DMEM). Isolated neurons (250,000 cells/cm2) were plated on one side of the chamber in DMEM/F-12, 5% FBS, supplemented with B-27 (Invitrogen) and penicillin/streptomycin. Axonal chambers were supplemented with 300 μg/ml NetrinI (R&D Systems) to direct axonal outgrowth under the coverslip. Transport was assessed between days in vitro (DIV) 12 and 14.
Determination of cell viability.
To determine DA cell viability following MPP+ treatment both in cell bodies and neurites, mesencephalic cultures were processed for TH immunoreactivity and counted using Stereo Investigator (MBF Bioscience). Briefly, 50 fields were assayed per dish leading to the quantification of 200–300 TH neurons and 2000–5000 neurites/dish. Experiments were repeated 3–5 times using cultures isolated from independent dissections.
Quantification of tubulin.
The Tubulin-mCherry construct was prepared by replacing the EGFP sequence of pEGFP-tubulin (Invitrogen) with mCherry (Dr. Mike Nonet, Washington University, St Louis, MO). Neurons were transfected using Lipofectamine 2000 (Invitrogen) at DIV5-6 and imaged 1 d later. Live images were taken at 1, 3, 6, and 24 h after MPP+ treatment. Tubulin integrity was also measured by immunostaining with antibodies against tyrosine hydroxylase (Pel-Freez Biologicals) and acetylated tubulin (AcTub; Sigma) on the axonal side of microchamber devices. TH-positive axons with at least three AcTub breaks per 40 μm of axon were considered damaged and calculated as the percentage total of all TH-positive axons.
Autophagy.
Cells were transfected with a GFP-tagged LC3 expression vector (kindly provided by Dr. Chris Weihl, Washington University) at DIV5-6 as previously reported (Kuma et al., 2007). A day later, cells were treated with 2 μm MPP+ for the indicated time, fixed, and immunostained with a rabbit anti-TH antibody (Pel-Freez Biologicals). Cy3-conjugated secondary antibodies (Jackson ImmunoResearch Laboratories) were used for visualization. TH-positive neurons with LC3-GFP granules were counted using Stereo Investigator (MBF Bioscience).
Optical imaging.
At DIV12–14, mitochondria on the axonal chamber side were labeled with 25 nm MitoTracker Red (MTR; Invitrogen). Plasmids containing mitochondrially targeted Dendra2 and synaptophysin fused in frame with cerulean (Syn-Cer) were provided by Evrogen and Dr. Rachel Wong (University of Washington, Seattle, WA), respectively. Subsequently, mitochondrially targeted Dendra2 and Syn-Cer were inserted into the FUGW lentiviral expression vector provided by Dr. Jeffrey Milbrandt (Washington University). Lentiviral preparations were generated using HEK 293T cells as described previously (Araki et al., 2004). DA/GFP cultures were inoculated with virus at DIV2 for 4–6 h and imaged at DIV12–13. Images were taken using a Zeiss LSM510 Meta NLO Multiphoton System (Carl Zeiss) on Axiovert 200M inverted microscope with 40× water objective [C-Apochromat 40×/1.2W Corr.1.2 numerical aperture, collar correction (0.14–0.18)] equipped with a 5% CO2/37°C controlled chamber. Filter sets used for visualizing a given fluorescent marker included 488 nm argon laser and 505 long pass emission filter (GFP and Dendra2), 543 nm HeNe laser and 560 long pass emission filter [MTR, tetramethylrhodamine ethyl ester (TMRE), or tubulin-mCherry), and 458 nm argon laser and 466–514 meta emission filter (Syn-Cer). Sixty images at 5 s intervals were acquired before addition of toxin and then again 30 min after 2 μm MPP+ treatment.
Image analysis.
Kymographs were created using ImageJ/Multiple Kymograph (NIH, Bethesda, MD). In all cases, direction was determined by identifying the axonal terminal from tile scanned images. To calculate particle speed in each direction, the following approach was adopted. Diagonal lines were drawn for each moving particle on a kymograph. Angle and length information were collected for each particle's diagonal line. Distance and time were calculated using the following equations in which 112.5 μm was the frame length, 512 the pixel size, and 5 s the interval of time-lapse images:
 |
Total numbers of particles were obtained using particle analysis with a threshold image. Only particles moving a minimum of 5 μm in length for at least 15 s within the imaging time were counted. Particle size was assessed using ImageJ/Particle analysis. Anterograde movements are expressed as positive integers whereas retrograde movement is expressed by negative integers.
[3H]Dopamine release. DA release on the microchamber devices was measured as described previously (Lotharius and O'Malley, 2000). Briefly, cells were loaded in both somal and axonal sides with 2.4 μCi/ml [3H]DA/Krebs–Ringer solution for 20 min at 37°C and washed 3 times for 3 min. Radioactive counts from a wash sample were measured using a Beckman scintillation counter and used as a control for basal levels of [3H]DA release. Cells were then treated with MPP+ for 10 min, and the amount of [3H]DA released during this time period was counted. Cultures were then washed extensively and maintained in [3H]DA-free Krebs–Ringer solution. Following medium collection, cells were lysed in 0.1 N perchloric acid by freeze thawing, and residual, intracellular [3H]DA was measured. Total counts and percentages were calculated.
Mitochondrial membrane potential and size.
Cells were loaded with either 50 nm TMRE (Invitrogen) or MTR for 15 min and medium was subsequently added for a final concentration of 25 nm. Mitochondrial potential was assessed based on changes in TMRE fluorescence before and after toxin treatment as described by Ward (2010). The cross area of axonal mitochondria was estimated by MTR fluorescence using ImageJ/particle analysis.
Statistical analysis.
One-way ANOVA and unpaired two-tailed Student's t test were used for statistical analysis (SAS, GraphPad Software).
Results
MPP+ causes neuritic degeneration and autophagy before cell body loss
Because MPP+ serves as a substrate for the plasma membrane DA transporter (Storch et al., 2004), its toxic effects are highly selective for DA neurons versus the non-DA interneurons that predominate dissociated mesencephalic cultures. Consistent with in vivo results showing that loss of DA terminal fields occurs earlier and is more pronounced than cell body loss (Serra et al., 2002; Meissner et al., 2003), MPP+ leads to a significant loss of neurites in dissociated DA cultures before cell bodies are affected. As early as 12 h post-MPP+ treatment, neurite loss was apparent (Fig. 1A). It should be noted that most of the “neurites” measured here have morphological features of proximal dendrites in that they exhibit a wide diameter that tapers away from the cell body. When compartmentalized axons (Fig. 2A,B) were assessed for fragmentation at 12 h, significantly more fragmentation was observed (70.3 ± 8.9% nontreated axon control versus 50.4 ± 8.4% nontreated dendritic control, p = 0.05). These data suggest that axons are more vulnerable than dendrites in the presence of MPP+. In contrast, TH-positive cell bodies were not significantly reduced until 24 h later and then by only ∼40% (Fig. 1B). Because DA uptake sites vary among DA neurons from the substantia nigra pars compacta (SNpc) and ventral tegmental area (VTA) (Storch et al., 2004) and that the described dissociated DA cultures would contain neurons from both populations, some variability among MPP+ effects is to be expected. Thus, a 40% death level might represent all of the DA SNpc neurons, yet only a small fraction of DA neurons arising from the VTA.
Figure 1.
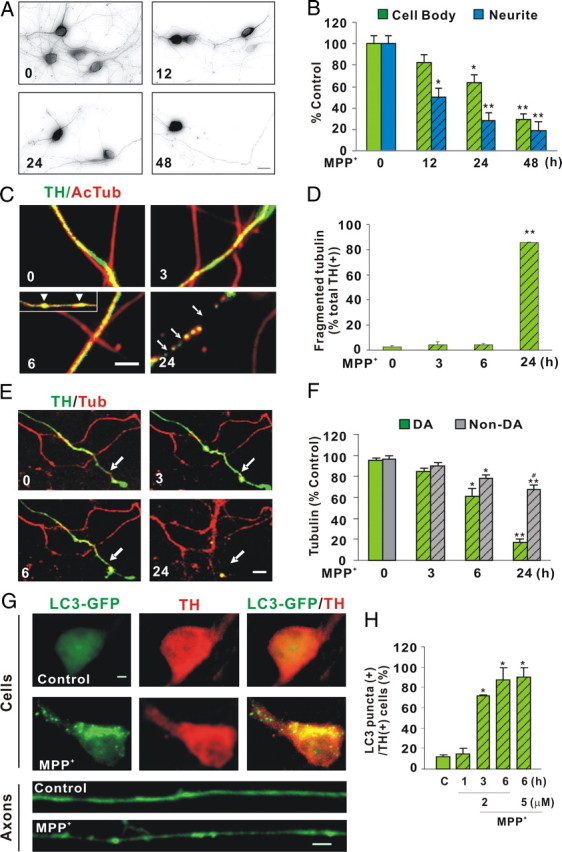
Neurite degeneration, microtubule disruption, and autophagy precede DA cell death following MPP+ treatment. A, Dissociated DA neurons were treated with 1 μm MPP+ for indicated times and then fixed and immunostained with rabbit polyclonal anti-TH antibody. B, Quantification of TH-positive cell bodies and neurites remaining after toxin treatment. Numbers of TH-positive cell bodies and neurites were counted using Stereo Investigator. Neurites were significantly reduced after 12 h of treatment, whereas the number of cell bodies did not significantly change until 24 h. Data denote the mean ± SEM of representative determinations made in three independent experiments. C, Integrity of microtubule tracks was assessed by measuring tubulin fragmentation before and after MPP+ treatment. Compartmented axons (described below) were fixed after 3, 6, and 24 h of MPP+ treatment and stained with antibodies directed against AcTub and TH. Beading is seen as early as 6 h (insert, arrowheads) and fragmentation at 24 h (arrow). D, TH-positive axons with fragmented acetylated tubulin were quantified. One hundred to three hundred TH-positive axons were counted per dish and three dishes were counted per group. E, Integrity of microtubule tracks was also assessed by transfecting tubulin-mCherry into DA/GFP cultures at DIV6. Following the addition of 2 μm MPP+, live images were acquired at the indicated times. F, Tubulin intensity was expressed as percentage control. Mean ± SEM made in three independent experiments, *p < 0.05, **p < 0.001, compared to 0 h; #p < 0.05, compared to DA at 24 h. G, Autophagy was assessed by introducing a GFP-tagged LC3 expression clone at DIV6 and treating DA neurons 1 d later with 2 μm MPP+. The formation of LC3-positive granules was measured as indicated by immunostaining. Lower panels show LC3 fluorescence within TH-positive axons before (top) and after (bottom) toxin treatment. For clarity, only LC3 fluorescence in axons is shown. H, The number of TH-positive neurons with at least three LC3-GFP granules was counted and expressed as percentage of all neurons that were both TH positive and LC3-GFP positive, regardless of whether the LC3-GFP signal in these neurons was diffuse or punctuate. Scale bars: A, C, E, 10 μm, G, 1 μm. H, Mean ± SEM in three independent experiments, *p < 0.05. In all bar graphs, hatching indicates toxin treatment.
Figure 2.
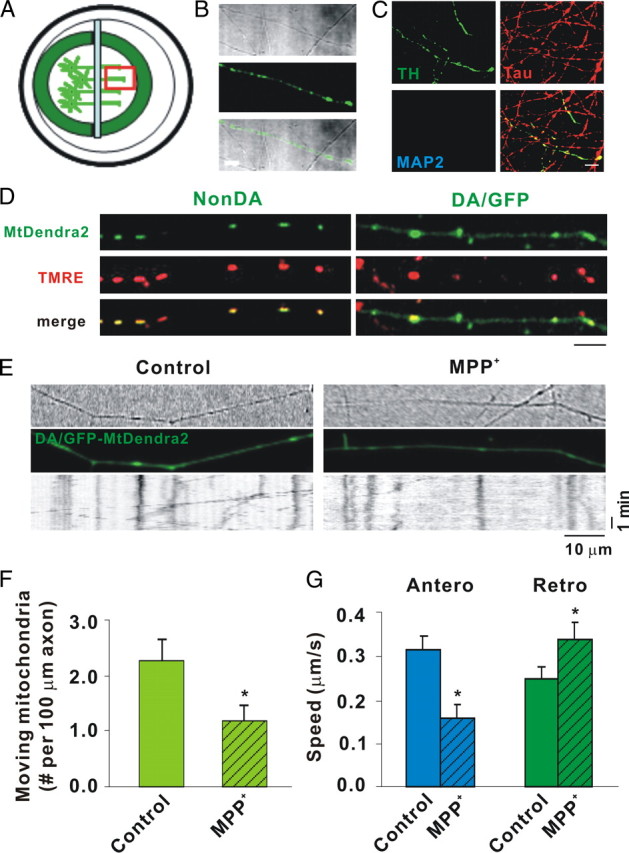
MPP+ rapidly decreases mitochondrial movement in DA axons as shown by mtDendra2. A, Diagram of microchamber device. B, Transmitted light image of segregated axons derived from DIV12 DA/GFP cultures in the top panel, GFP fluorescence in the middle panel, and the merged image in the bottom panel showing TH-positive and TH-negative axons in same field. C, Immunostaining of the axonal side with TH, the axonal marker Tau, and the dendritic marker MAP2. Tau but not MAP2-positive processes is present on axonal side. Scale bar, 10 μm. D, mtDendra2 colocalizes with TMRE. Despite presence of nonconverted mtDendra2, DA axon is easily identified. E, Axonal movement of mitochondria. Mitochondria labeled with mtDendra2 were imaged for 5 min at 5 s intervals after 30 min incubation with and without 2 μm MPP+. For consistency, mitochondrial measurements were assessed near the axon terminal at least 2 mm away from the cell bodies. Resulting kymographs are shown below. F, Number of moving mitochondria per 100 μm length of axon was calculated. G, Speed was calculated as described in Materials and Methods. F, G, Mean ± SEM, *p < 0.05, total of 17 (control) and 14 (MPP+-treated) axons derived from at least 7 dishes in 3 independent experiments. The anterograde speed (Antero) was decreased and the retrograde speed (Retro) increased as early as 30 min after MPP+ treatment. Scale bars: B–D, 10 μm. Hatching indicates toxin treatment.
Since MPP+ is thought to depolymerize microtubules (Cappelletti et al., 2005), we stained DA/GFP cultures with antibodies directed against acetylated α-tubulin, a marker of stable microtubules, and examined DA axons for the presence of beading and/or fragmentation. “Beading” was first observed by 6 h (Fig. 1C, arrowheads), although no significant fragmentation was observed at this time point (Fig. 1D). To confirm and extend this result, the integrity of tubulin was also assessed by introducing a tubulin-mCherry construct into dissociated DA cultures. The mCherry-positive axons were examined for breaks in DA (GFP+) and non-DA (GFP−) processes at various time points following MPP+ treatment. Consistent with MPP+ effects on acetylated α-tubulin, significant axonal disintegration in DA neurons was not seen until 6 h post-treatment, which exceeded 80% by 24 h (Fig. 1E,F). Together, these data indicate that MPP+ affects one important component of axonal structure, namely the microtubule tracks, 12–18 h before significant cell body loss is observed.
MPP+ has been shown to induce autophagy, a catabolic system to degrade and recycle damaged proteins and/or organelles (Yang and Klionsky, 2010) within 24 h in DA neurons (Zhu et al., 2007). To determine whether the disruption of microtubule tracks preceded the induction of autophagic markers such as LC3 (microtubule-associated protein 1, light chain 3; also known as ATG8) (Kadowaki and Karim, 2009), we transfected an LC3-GFP clone into DA cultures and measured the appearance of autophagic granules. Under normal conditions, LC3-GFP fluorescence exhibits a diffuse cytoplasmic distribution (Fig. 1G). As early as 3 h after toxin treatment, LC3 takes on a punctated appearance as it localizes to the inner membrane of forming autophagosomes (Fig. 1G,H). This observation confirms and accelerates the timeframe reported by Zhu et al. (2007). Moreover, these results suggest that even before damaged microtubules are apparent, other toxin-induced molecular events induce hallmarks of autophagy.
MPP+ disrupts mitochondrial axonal transport
MPP+ also inhibits complex I, leading to mitochondrial dysfunction (Murphy et al., 1995). To analyze mitochondrial movement, size, and membrane potential (ΔΨm) in DA processes, we initially used a microfluidic strategy (Taylor et al., 2005). However, DA neurons attached poorly and were highly susceptible to shear stress resulting from plating, media changes, and/or toxin addition. Using a simplified chamber design (Ivins et al., 1998), we established compartmented cultures such that: (1) axons were segregated from cell bodies and dendrites; (2) transport direction was easily discerned, imaged, and quantified; and (3) cell bodies or axons could be independently exposed to drugs, toxins, DNA, etc. (Fig. 2A). When we used dissociated cultures from DA/GFP mice, DA axon terminals could be identified via GFP fluorescence (Fig. 2B). Immunostaining with the dendritic marker MAP2 (microtubule-associated protein 2) or axon-preferring tau verified that processes that grew under the glass coverslip were axons, not dendrites (Fig. 2C). To avoid overlapping fluorescent emissions in analyzing mitochondrial movement, we considered several approaches. These included: (1) lipid-based transfections with mitochondrially targeted DsRed2 (mtDsRed2) and/or the photoactivatable fluorescent protein Dendra2 (mtDendra2); (2) transductions with the same constructs packaged as lentiviral particles; and (3) mitochondrial dyes such as MTR and TMRE. In the first scenario, finding fluorescently labeled mitochondria in DA/GFP axons for live imaging is hampered by the low numbers of DA neurons typically isolated (2–5% of the total) and low transfection efficiencies in these cultures (<5%). The second scenario, lentiviral transduction of fluorescent proteins targeted to the mitochondria (mtDsRed2; mtDendra2), was more efficient and, at least with mtDendra2, provided the option of following particles after photoconversion. Caveats associated with the third scenario include the notion that mitochondrial dyes might interfere with mobility (Buckman et al., 2001; Wang and Schwarz, 2009). Thus we started these studies using a targeted mtDendra2 lentivirus. Although Dendra normally emits at the same wavelength as GFP before excitation, it is easy to discern mitochondrially targeted Dendra in DA axons because the latter typically exhibit a smooth, homogenous pattern of GFP expression distinct from the tubulovesicular appearance of mtDendra2 (Fig. 2D). That these structures represent mitochondria can be shown by colocalization with the fluorescent lipophilic cation TMRE, which rapidly accumulates in mitochondria (Fig. 2D). Unfortunately, in our system mtDendra2 did not photoconvert with the efficiency or at the wavelength originally claimed (Gurskaya et al., 2006); nonetheless, analysis of nonconverted mtDendra2 particles showed that MPP+ decreased total numbers of moving mitochondria (Fig. 2E,F). Moreover, MPP+ treatment decreased mitochondrial speeds in the anterograde direction but increased them in the retrograde direction (Fig. 2G).
Despite the usefulness of mtDendra2, the small number of DA neurons and variability associated with transduction still made acquiring sufficient data in multiple experimental paradigms logistically challenging. In contrast, mitochondrial dyes have the benefit of labeling all mitochondria within a chamber, ensuring adequate numbers for analysis despite potential limitations such as diffusion of fluorescence, quenching, and interference with bioenergetic states (Buckman et al., 2001). At least some of these limitations can be overcome when low concentrations (<50 nm) of MitoTrackers such as MTR are used (Buckman et al., 2001; Rui et al., 2006; Konzack et al., 2007; Trimmer et al., 2009). In our studies, excellent loading and labeling of mitochondria was achieved using even lower concentrations of MTR (25 nm). At this concentration, MTR labeled exactly the same structures that TMRE did (data not shown). More importantly, when an identical experimental protocol was used to measure MTR-labeled mitochondria, essentially the same results as those for mtDendra2 were produced (Fig. 3). In either case, we observed that like other neurons (Kang et al., 2008), >70% of all axonal mitochondria were stationary (Kang et al., 2008). Of those mitochondria that were moving, over 50% had stopped after only 30 min of MPP+ treatment (Figs. 2F, 3B). Moreover, the number of moving mitochondria was reduced in either the anterograde or retrograde direction (Figs. 2G, 3C). In agreement with previously published values (Brown, 2003), motile DA mitochondria moved with an average speed of 0.32 μm/s in the anterograde direction, whereas a slower rate was observed in the retrograde direction (0.26 μm/s) (Figs. 2G; 3C). Following MPP+ treatment these rates were reversed: anterograde velocity was reduced whereas retrograde speed was accelerated (Figs. 2G, 3C). Thus, MPP+ rapidly affects both the fraction of motile DA mitochondria and the speed at which they travel. These data suggest that in this cell system and at this concentration MTR is a reliable measure of mitochondrial mobility. Importantly, using two different approaches essentially the same results were observed: MPP+ rapidly reduced overall mitochondrial motility in DA axons; among motile mitochondria, anterograde transport was slower yet retrograde transport was increased.
Figure 3.

MPP+ rapidly decreases mitochondrial movement in DA axons as shown by MitoTracker Red. A, Axonal movement of mitochondria. Mitochondria were labeled with 25 nm MTR and imaged for 5 min at 5 s intervals after 30 min of incubation with and without 2 μm MPP+. Mitochondrial measurements were assessed as described in Figure 2. Resulting kymographs are shown below. B, Total and moving mitochondria were counted and the rate of motile mitochondria was calculated. C, Speed was calculated as described in Materials and Methods. B, C, Mean ± SEM, *p < 0.05, total of 114 (control) and 175 (MPP+-treated) axons from 15 and 28 dishes in 13 independent experiments. Total length of control and MPP+-treated axons sampled were 10,716 and 16,732 μm, respectively, and the total numbers of mitochondria examined were 1762 and 2632, respectively. The anterograde speed (Antero) was decreased and the retrograde speed (Retro) increased as early as 30 min after MPP+ treatment. Hatching indicates toxin treatment.
MPP+ does not affect vesicular transport
To determine whether MPP+ affects all cargo movement or just that of mitochondria, DA/GFP cultures in microchamber devices were transduced with a lentivirus expressing Syn-Cer (Fig. 4A,B). As shown by others (Nakata et al., 1998), the synaptophysin sequence targets small, rapidly moving particles that do not colocalize with MTR (Fig. 4A). Despite inhibiting mitochondrial movement within 30 min, MPP+ did not affect the number or speed of synaptophysin-tagged particles moving in either direction (Fig. 3B–D). Since numerous studies have also shown that MPP+ is taken up into vesicular compartments where it rapidly (<10 min) leads to the displacement of DA (Lotharius and O'Malley, 2000), which was reproduced in our microchamber devices (Fig. 5), these results emphasize that the presence of a neurotransmitter is not a requirement for transport. As synaptophysin labels only synaptic vesicles, we also examined all moving particles using transmitted light images. After subtracting out mitochondria from MTR-colabeled axons, the remaining particles showed no significant difference in movement following toxin treatment (data not shown). These data underscore the specificity of the MPP+ effect on mitochondria versus general axonal cargos and also rule out damaged microtubules as a contributing factor in decreased mitochondrial motility.
Figure 4.

MPP+ does not affect axonal movement of synaptic vesicles. Dissociated DA/GFP cultures were transduced with Syn-Cer lentivirus at DIV2. Vesicular movement was assessed on DIV12–13 before and after toxin treatment. A, Although some vesicles were clumped and appeared to overlap mitochondria, individual vesicles labeled with Syn-Cer (arrows) were also visualized adjacent to mitochondria labeled with MTR (arrowheads). B, Vesicular movement was observed for 5 min before and after 30 min of incubation with and without 2 μm MPP+. Because of the smaller size of vesicular particles and the relative “dimness” of the cerulean emission, tracks of moving particles are shown below for clarity. C, D, Quantification of moving particles (C) and speed (D) were determined as described in Materials and Methods. Scale bar: 10 μm. Mean ± SEM, ns, nonsignificant, total of 25 (control) and 38 (MPP+-treated) axons from 4 and 5 dishes in 4 independent experiments. Total lengths of control and MPP+-treated axons sampled were 2247 and 3497 μm, respectively. Hatching indicates toxin treatment.
Figure 5.
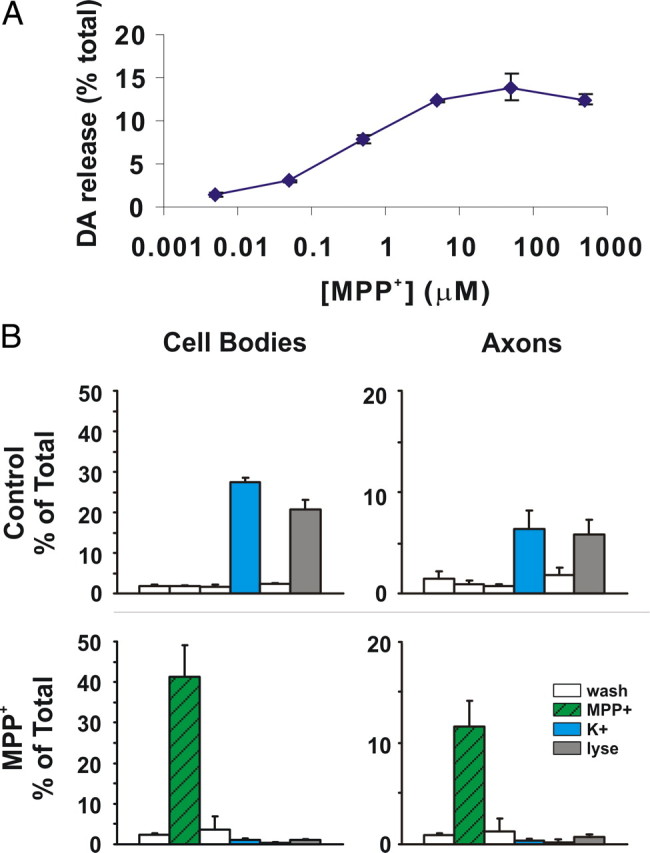
MPP+ rapidly leads to DA efflux. [3H]DA release assays were performed exactly as we have described previously except that 10 min treatment windows were used instead of 6 min (Lotharius and O'Malley, 2000). A, MPP+ dose–response curve; EC50 for DA release is 0.42 ± 0.04 μm (mean ± SEM). B, MPP+-mediated DA release can also be assessed in segregated axons. Each chamber was briefly incubated with [3H]DA, washed extensively with PBS, and then treated with or without 1 μm MPP+ for 10 min. Chambers were washed and then treated with 60 mm K+ to release vesicular contents and finally lysed to assess remaining DA levels (Lotharius and O'Malley, 2000). In the top panels, high K+ releases 50–60% of intracellular DA levels in control cell bodies (left) and axons (right) whereas, 1 μm MPP+ releases >95% (bottom panels). Axon-only chamber represented about 25% of transmitter levels in cell body chamber.
MPP+ rapidly depolarizes axonal mitochondria
MPP+ inhibition of complex I leads to ROS, loss of ΔΨm, and eventually loss of ATP (Ali et al., 1994). Previously we showed that MPP+-induced ROS changes occurred within 15 min in DA cell bodies using dihydrorhodamine and dihydroethidium (Lotharius et al., 1999; Lotharius and O'Malley, 2001). Although we could confirm our cell body results, we could not quantitate ROS changes in DA axons with these reagents (data not shown). To determine whether ΔΨm was altered over the same time period that movement was reduced, segregated DA/GFP axons were labeled with the sensitive ΔΨm indicator TMRE before acquiring baseline images. After 30 min of toxin treatment, ΔΨm was significantly reduced in DA (79.8 ± 7.23% decrease in TMRE fluorescence) (Fig. 6B) but not non-DA axonal mitochondria (≤ 12.9 ± 7.34% TMRE fluorescent decrease) (Fig. 6B), highlighting the DA-specific nature of the MPP+ effects. Because bioenergetic declines are thought to shift fusion/fission dynamics toward fission, resulting in smaller mitochondria (Benard et al., 2007), we measured mitochondrial size. Although TMRE-labeled mitochondria appeared to undergo a decrease in size (Fig. 6A), this was due to the loss of TMRE fluorescence since MPP+ treatment did not decrease the size of MTR-labeled axonal mitochondria (Fig. 6C). Thus, MPP+ rapidly depolarized DA mitochondria but did not reduce their size, at least in the time frame tested. Collectively, these results are consistent with recent work in hippocampal neurons showing that depolarized mitochondria travel more rapidly in a retrograde direction (Gerencser and Nicholls, 2008).
Figure 6.

MPP+ rapidly depolarizes DA mitochondria. A, Mitochondria in axons from DA/GFP cultures were labeled with 25 nm TMRE and then assessed before and 30 min after MPP+ treatment. Scale bar: 5 μm B, MPP+ led to significant differences in ΔΨm as measured in arbitrary units (AU; arrows). C, Cross sectional areas of mitochondria labeled with MTR were measured before and after toxin treatment using ImageJ particle analysis. Hatching indicates toxin treatment. B, C, Mean ± SEM of representative determinations from three independent experiments, **p < 0.001.
Thiol-based reagents rescue disrupted transport, neurites, and cells
What are the underlying mechanisms associated with MPP+-mediated alterations in transport? Conceivably, MPP+-compromised mitochondria block transport due to the ATP dependency of the molecular motors. In the squid axoplasm preparation, however, MPP+ effects on fast axonal transport were independent of ATP production. Rather, MPP+ treatment led to axonal activation of caspase-3, which in turn cleaved PKCδ into its catalytically active fragment (Morfini et al., 2007). Like the squid preparation, increasing ATP levels in bona fide DA axons via glucose preincubation (ATP levels increased from 3.93 ± 0.20 × 10⁻¹² to 4.88 ± 0.11 × 10⁻¹² mole/μg of protein, p-value = 0.002) did not rescue MPP+ effects on mitochondrial motility (Table 1). One caveat to this finding is that there are no methodologies to measure ATP levels in situ. Thus, we cannot rule out the possibility that regional variations in ATP levels might underlie the loss of mitochondrial movement. Unlike the invertebrate preparation, neither the PKC (Gö6976) nor the caspase inhibitor Csp3I-II blocked MPP+ effects in DA axons (Table 1) although both inhibitors significantly blocked 6-OHDA-induced DA cell death (Gö6976: 45.94 ± 11.48% and Csp3I-II: 50.70 ± 11.58% protection). We also tested whether Ca2+ chelators would affect mitochondrial transport since Ca2+ plays a role in axonal loss (Stirling and Stys, 2010) and is also implicated in DA neurodegeneration (Surmeier, 2007). Neither EGTA nor BAPTA-AM prevented MPP+-disrupted mitochondrial transport at concentrations showing intracellular Ca2+ changes in axons using Oregon Green (data not shown). Because axonal injury induces activation of the c-Jun N-terminal kinase (JNK) family in the peripheral nervous system (Abe and Cavalli, 2008), we examined whether the general JNK inhibitor SP600125 could rescue toxin-blocked mitochondrial motility in segregated DA axons. SP600125 did not affect mitochondrial trafficking (Table 1) nor did it prevent MPP+-mediated DA cell death at a concentration that was effective for blocking t-butylhydroperoxide-induced DA cell death (64.08 ± 2.18% protection).
Table 1.
Effects of substrates, inhibitors, and anti-oxidants on MPP+-disrupted mitochondrial axonal transport
| Motile mitochondria (%) | |
|---|---|
| Control | 18.41 ± 3.62 |
| MPP+ | 8.25 ± 1.34a |
| + Glucose | 6.19 ± 1.26 |
| + Csp3I- II | 10.96 ± 2.58 |
| + Gö6976 | 6.16 ± 3.42 |
| + EGTA | 4.80 ± 2.70 |
| + SP600125 | 4.63 ± 0.63 |
| + MnTBAP | 9.49 ± 1.51 |
| + NAC | 18.62 ± 3.53b |
| + GSHEE | 15.49 ± 3.10b |
Numbers are mean ± SEM.
ap < 0.05 compared to control.
bp < 0.05 compared to MPP+. Concentrations: MPP+, 2 μm; glucose, 20 mm; Csp3I-II (caspase-3 inhibitor II), 5 μm; Gö6976, 500 nm; EGTA, 2.5 mm; SP600125, 10 μm; MnTBAP, 100 μm; NAC (N-acetylcysteine),2.5 mm; GSHEE, 5 mm.
Given that MPP+ generates ROS via inhibition of complex I or via release of vesicular DA followed by its cytoplasmic oxidation (Lotharius et al., 1999; Lotharius and Brundin, 2002), we tested N-acetylcysteine (NAC; precursor of glutathione), Mn(III)tetrakis(4-benzoic acid) porphyrin (MnTBAP, a superoxide dismutase mimetic), and glutathione monoethyl ester (GSHEE; membrane-permeable GSH) as axonal protectants. Remarkably, pretreatment with the redox-sensitive neuroprotectants NAC and GSHEE completely rescued MPP+-induced changes in numbers of motile mitochondria, whereas the anti-oxidant, MnTBAP was ineffective at a concentration of 100 μm (Table 1). Moreover, NAC pretreatment not only rescued mitochondrial motility but also MPP+-induced neurite and cell body loss (Fig. 7). Thus, NAC or similar drugs can potentially be useful therapeutic tools. Although these differences may simply reflect extruded axoplasm responses versus an intact axon, they may also reflect clear differences between vertebrate and invertebrate mitochondrial trafficking systems and indicate that redox equilibria may play a critical role in at least the mammalian processes.
Figure 7.
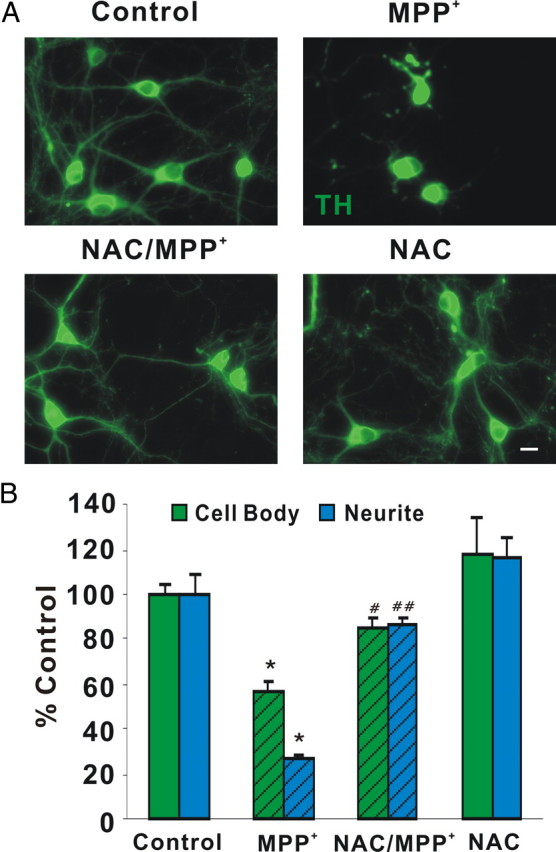
NAC protects DA cell bodies and neurites from MPP+-induced degeneration. A, Dissociated DA neurons were pretreated with 2.5 mm NAC for 18 h, treated with 2 μm MPP+ for 24 h, and then fixed and immunostained with rabbit polyclonal anti-TH antibody. Scale bar: 10 μm B, Quantification of TH-positive cell bodies and neurites. Cell bodies and neurites were significantly protected by NAC. Mean ± SEM from three independent experiments, *p < 0.05, compared to control, #p < 0.05, ##p < 0.001, compared to MPP+.
DA mitochondria are smaller and slower than non-DA mitochondria
Recent studies show that nigral DA neurons have lower numbers of mitochondria in their cell bodies and dendrites than non-DA neurons (Liang et al., 2007). To determine whether differences exist in organelle size or movement between DA and non-DA axons, we measured various critical attributes of axonal mitochondria and synaptophysin-tagged vesicles (Table 2). Consistent with the in vivo study (Liang et al., 2007), DA mitochondria are about half the size of non-DA mitochondria and are transported almost three times slower. Although the density of mitochondria along the axon is the same, there are fewer moving mitochondria in DA versus non-DA axons. Mitochondrial membrane potential is the same. Similarly, the number of moving vesicles per unit length axon is reduced in DA versus non-DA axons, but their speed is not (Table 2). No difference was found in other general moving particles. Importantly, non-DA mitochondria were not affected by MPP+ in terms of size, mobility, or speed (Table 3). Given that these data were acquired from the same experiments in which DA axons were analyzed, they serve as useful internal controls showing that the loss of signal or change in parameter is not due to bleaching caused by imaging or other non-specific effects. Together, these data suggest that DA axons may be more susceptible to dysfunction than non-DA axons due to innate differences in axonal mitochondrial characteristics.
Table 2.
DA axons exhibit unique mitochondrial and vesicular characteristics
| DA | Non-DA | |
|---|---|---|
| Density‡ | 8.89 ± 0.86 | 9.50 ± 0.82 |
| Moving particles‡ | 1.93 ± 0.22 | 2.49 ± 0.24* |
| Speed (μm/s) | ||
| MTR | 0.28 ± 0.05 | 0.79 ± 0.07** |
| mtDendra2 | 0.30 ± 0.02 | 0.61 ± 0.11** |
| Cross area (μm2) | ||
| MTR | 1.07 ± 0.12 | 2.52 ± 0.11** |
| mtDendra2 | 0.94 ± 0.06 | 2.17 ± 0.47* |
| Ψm (AU) | 58.5 ± 3.22 | 65.2 ± 4.08 |
| Synaptic vesicles | ||
| Moving particles‡ | 3.93 ± 0.30 | 5.71 ± 0.63* |
| Speed (μm/s) | 0.56 ± 0.05 | 0.52 ± 0.03 |
| All particles | ||
| Moving particles‡ | 6.35 ± 1.22 | 6.79 ± 0.48 |
| Speed (μm/s) | 0.12 ± 0.01 | 0.14 ± 0.01 |
‡Number/100 μm. Numbers are mean ± SEM,
*p < 0.05,
**p < 0.001, compared to DA neurons. For MTR studies, 33 dishes from 11 independent experiments were evaluated; for mtDendra2 studies, eight dishes from four independent experiments were assessed. For synaptic vesicles, three dishes from three independent experiments were assessed. When measuring all particles, seven dishes from seven independent experiments were measured. In all cases 3–5 axons per dish were analyzed.
Table 3.
MPP+ did not affect mitochondrial number, speed, or size in non-DA axons
| Control | MPP+ | |
|---|---|---|
| Moving particles (number/100 μm) | ||
| MTR | 2.49 ± 0.24 | 2.01 ± 0.23 |
| mtDendra2 | 1.92 ± 0.61 | 2.48 ± 0.14 |
| Speed (μm/s) | ||
| MTR | 0.79 ± 0.07 | 0.71 ± 0.09 |
| mtDendra2 | 0.61 ± 0.11 | 0.65 ± 0.19 |
| Cross area (μm2) | ||
| MTR | 2.52 ± 0.11 | 2.36 ± 0.19 |
| mtDendra2 | 2.17 ± 0.47 | 2.57 ± 0.46 |
Numbers are mean ± SEM. For MTR studies, 33 dishes from 11 independent experiments were evaluated; for mtDendra2 studies, eight dishes from four independent experiments were assessed. In all cases 3–5 axons per dish were analyzed.
Discussion
Mounting evidence suggests that axonal dysfunction precedes the death of cell bodies in many neurodegenerative disorders, especially PD. The present study uses cellular, optical, and pharmacological techniques to provide new insights into the biological changes underlying toxin-mediated DA axonal impairment. Results demonstrate: (1) that the PD-mimetic MPP+ affects DA neuritic processes and microtubule tracks 12–18 h before cell bodies appear altered, and neuritic autophagic puncta are visible by 3 h; (2) MPP+ halts mitochondrial trafficking in DA but not non-DA axons within 30 min, an event which precedes autophagy and loss of microtubules; (3) remaining motile mitochondria exhibit decreased anterograde movement but increased retrograde trafficking; (4) MPP+ effects are specific for mitochondria, as synaptophysin-tagged vesicles and other detectable moving particles continue normal movements in either direction; (5) decreased mitochondrial trafficking is accompanied by a loss of ΔΨm; (6) loss of mitochondrial movement is not associated with ATP loss but rather redox changes; (7) DA mitochondria are smaller and slower than non-DA organelles, suggesting cell type-specific differences exist for axonal mitochondria.
Although widely used as an animal model of PD, the mechanism by which MPP+ kills DA neurons remains equivocal. Previously we have shown that MPP+ induces a protein synthesis-dependent yet caspase-independent cell death in DA neurons that is partially mediated by ROS (Lotharius et al., 1999). In those studies and this one, DA cell bodies die over a period of 48 h following toxin treatment, although early loss of neurites is consistently observed (Lotharius et al., 1999) (Fig. 1). Increased free radical species such as mitochondrial superoxide have been proposed as an important mechanism underlying the neurotoxicity of MPP+ (Jackson-Lewis and Smeyne, 2005). Previously, however, we have shown that MPP+-induced ROS are primarily derived from toxin-released vesicular DA (Lotharius and O'Malley, 2000) (Fig. 5). Since redistributed, cytoplasmic DA is thought to form a number of oxidized toxic metabolites, including DA quinones (Hastings, 2009), it is perhaps not surprising that MnTBAP, a cell-permeable SOD mimetic, did not show a protective effect. Conceivably, other types of ROS, including hydroxyl radicals and/or nitric oxide (Jackson-Lewis and Smeyne, 2005; Obata, 2006; Yokoyama et al., 2008), might also play a role in MPP+-mediated neurotoxicity. What role, if any, these factors play in axonal transport awaits future study.
Recently, Cartelli et al. (2010) also reported that MPP+ affects mitochondrial trafficking in the pheochromocytoma cell line PC12. In this study, however, MPP+ led to microtubule impairment before transport dysfunction. In contrast, the present findings show that mitochondrial dysfunction (30 min) (Figs. 2, 3, 6) precedes microtubule fragmentation in DA axons (Fig. 1). Although microtubule polymerization is a GTP-dependent process (Carlier and Pantaloni, 1981), it is also controlled by ATP-dependent pathways. For example, the energy-sensing AMP-activated protein kinase is required for microtubule stabilization (Nakano et al., 2010). Conceivably, MPP+-mediated energy deprivation over the course of 6 h may underlie microtubule fragmentation (Fig. 1).
A direct effect of MPP+ on axonal transport was first seen in the isolated squid axoplasm (Morfini et al., 2007). Despite the evolutionary distance between the squid and mouse, in both cases MPP+ decreased anterograde trafficking while increasing retrograde movement. However, in the squid axoplasm, MPP+ affected all organelles and vesicles moving via fast axonal transport, whereas in bona fide DA neurons, toxin-mediated effects were specific for mitochondria. Although model preparations such as the squid axoplasm and/or the noradrenergic peripheral tumor cell line can yield valuable insights, our results underscore the uniqueness of a midbrain DA neuron. Indeed, the rapidity and specificity of MPP+ actions on DA axons are striking: toxin effects on mitochondria occur hours before microtubule tracks fall apart and before cell bodies are lost (Fig. 1). Moreover, neither non-DA mitochondria nor any other detectable type of moving particle is affected by toxin treatment, confirming the integrity of the microtubule tracks (Table 2).Together, these data point to an early and profound toxin-mediated block of mitochondrial trafficking that results in mitochondrial redistribution away from the synapse back to the soma. Conceivably, damaged mitochondria moving toward the soma could deliver signals from the axon to the cell body, leading to the initiation of cell death.
Mitochondria undergo complex yet continual processes of fusion and fission that are critical for the exchange of organelle contents, repolarization, or degradation by autophagy (Chen and Chan, 2009). Two PD-linked genes that are ubiquitously expressed have also been implicated in this process. Current data indicate that PINK1 is selectively stabilized on depolarized mitochondrial membranes (Matsuda et al., 2010). This in turn acts as a signal for Parkin recruitment, which tags Pink-positive depolarized mitochondria for destruction via autophagy (Narendra et al., 2008, 2010; Matsuda et al., 2010). The latter studies would predict that following MPP+ treatment and bioenergetic declines, PINK1 will be stabilized and Parkin will then be recruited to the PINK-tagged organelles before the appearance of autophagic puncta in DA axons. One caveat to this model, however, is that the previous studies were conducted in cell lines. A recent report examining PINK1 recruitment of Parkin in bona fide neurons did not see depolarization-mediated Parkin recruitment or autophagy (Van Laar et al., 2011). Thus, other mechanisms may also contribute to the induction of these processes in neurons.
In addition to its role in monitoring mitochondrial dynamics (Bueler, 2009), PINK1 might directly affect mitochondrial motility since it also forms a complex with Miro and Milton (Weihofen et al., 2009). The latter proteins are known to recruit kinesin to the mitochondria and promote motility along microtubule tracks (Reis et al., 2009). Recently, an ROS-independent, redox-dependent protein termed HUMMR (hypoxia-upregulated mitochondrial movement regulator) was discovered that also interacts with Milton and Miro to influence mitochondrial movement and direction (Li et al., 2009). Knockdown of HUMMR decreased anterograde movement of mitochondria and increased retrograde movement (Li et al., 2009). Given that MPP+-disrupted mitochondria exhibited decreased anterograde and increased retrograde movement and that only the redox protectants NAC and GSHEE prevented these axonal effects, it may be possible that HUMMR, in conjunction with PINK1/Milton and Miro, plays a role in this process. Although MPP+-decreased ΔΨm may be sufficient to reduce and alter mitochondrial movement, whether these or other transport-associated proteins play ancillary roles awaits future studies.
A recent study suggests that somal and dendritic DA mitochondria occupy only 40% of the area of non-DA mitochondria. (Liang et al., 2007). Our cross-sectional measurements of mitochondria in DA axons versus non-DA axons mirror these results, with DA mitochondria being only 40% of the size of their non-DA counterparts (Table 2). Most importantly, axonal DA mitochondria exhibit an instantaneous velocity that is almost three times slower than non-DA mitochondria (Table 2). The validity of these observations is underscored by the use of two different mechanisms to measure mitochondrial properties (MTR and mtDendra2) (Table 2) with essentially the same results. Moreover, since all measurements were taken from within the same axonal fields, even if absolute numbers were affected by experimental conditions, the actual results are relative to each other. Presumably, this reflects inherent differences in DA axonal mitochondria themselves; perhaps a unique outer membrane protein interacts with a scaffolding protein that, in turn, binds to a slower motor. Alternatively, DA axons might be slightly narrower, slowing larger organelles and potentially contributing to their smaller size. Thus, in addition to producing a transmitter prone to oxidation (Hastings, 2009) and reliance upon L-type Ca2+ channels that appear to drain ATP resources (Chan et al., 2010), DA neurons might also be less effective at delivering mitochondria to sites of high energy usage such as synapses.
Redistribution of mitochondria away from sites of high ATP usage would lead to axonal impairment, loss of synaptic connectivity, and hence loss of function. Although mitochondrial redistribution may not be the sole trigger of axonal dysfunction, it occurs early and is consistent with increased mitochondrial staining in the cell body (data not shown). This study, together with the large amount of evidence suggesting that PD is associated with axonal “dying-back,” underscores the necessity of developing therapeutics aimed at axons as well as cell bodies so as to preserve circuitry and function. Because NAC pretreatment not only prevented mitochondrial dysfunction but also preserved neurites and cell bodies, NAC or drugs like it may serve a future therapeutic role.
Notes
Supplemental material for this article (movies) is available at http://thalamus.wustl.edu/faculty.php?id=4. This material has not been peer reviewed.
Footnotes
This work was supported by National Institutes of Health Grants NS39084 (K.L.O.) and National Institutes of Health Neuroscience Blueprint Core Grant NS057105 to Washington University. This work was also supported by the Bakewell Family Foundation. We thank Steven K. Harmon and Scott Elman for technical support and data analysis and Drs. Mike Nonet, Rachel Wong, Jeffrey Milbrandt, and Chris Weihl for plasmid constructs. We also thank Drs. Paul Bridgman and Valeria Cavalli for helpful discussions.
References
- Abe N, Cavalli V. Nerve injury signaling. Curr Opin Neurobiol. 2008;18:276–283. doi: 10.1016/j.conb.2008.06.005. [DOI] [PMC free article] [PubMed] [Google Scholar]
- Ali SF, David SN, Newport GD, Cadet JL, Slikker W., Jr MPTP-induced oxidative stress and neurotoxicity are age-dependent: evidence from measures of reactive oxygen species and striatal dopamine levels. Synapse. 1994;18:27–34. doi: 10.1002/syn.890180105. [DOI] [PubMed] [Google Scholar]
- Araki T, Sasaki Y, Milbrandt J. Increased nuclear NAD biosynthesis and SIRT1 activation prevent axonal degeneration. Science. 2004;305:1010–1013. doi: 10.1126/science.1098014. [DOI] [PubMed] [Google Scholar]
- Benard G, Bellance N, James D, Parrone P, Fernandez H, Letellier T, Rossignol R. Mitochondrial bioenergetics and structural network organization. J Cell Sci. 2007;120:838–848. doi: 10.1242/jcs.03381. [DOI] [PubMed] [Google Scholar]
- Brown A. Axonal transport of membranous and nonmembranous cargoes: a unified perspective. J Cell Biol. 2003;160:817–821. doi: 10.1083/jcb.200212017. [DOI] [PMC free article] [PubMed] [Google Scholar]
- Buckman JF, Hernández H, Kress GJ, Votyakova TV, Pal S, Reynolds IJ. MitoTracker labeling in primary neuronal and astrocytic cultures: influence of mitochondrial membrane potential and oxidants. J Neurosci Methods. 2001;104:165–176. doi: 10.1016/s0165-0270(00)00340-x. [DOI] [PubMed] [Google Scholar]
- Büeler H. Impaired mitochondrial dynamics and function in the pathogenesis of Parkinson's disease. Exp Neurol. 2009;218:235–246. doi: 10.1016/j.expneurol.2009.03.006. [DOI] [PubMed] [Google Scholar]
- Cappelletti G, Surrey T, Maci R. The parkinsonism producing neurotoxin MPP+ affects microtubule dynamics by acting as a destabilising factor. FEBS Lett. 2005;579:4781–4786. doi: 10.1016/j.febslet.2005.07.058. [DOI] [PubMed] [Google Scholar]
- Carlier MF, Pantaloni D. Kinetic analysis of guanosine 5′-triphosphate hydrolysis associated with tubulin polymerization. Biochemistry. 1981;20:1918–1924. doi: 10.1021/bi00510a030. [DOI] [PubMed] [Google Scholar]
- Cartelli D, Ronchi C, Maggioni MG, Rodighiero S, Giavini E, Cappelletti G. Microtubule dysfunction precedes transport impairment and mitochondria damage in Mpp-induced neurodegeneration. J Neurochem. 2010;115:247–258. doi: 10.1111/j.1471-4159.2010.06924.x. [DOI] [PubMed] [Google Scholar]
- Chan CS, Gertler TS, Surmeier DJ. A molecular basis for the increased vulnerability of substantia nigra dopamine neurons in aging and Parkinson's disease. Mov Disord. 2010;25(Suppl 1):S63–S70. doi: 10.1002/mds.22801. [DOI] [PubMed] [Google Scholar]
- Chen H, Chan DC. Mitochondrial dynamics–fusion, fission, movement, and mitophagy–in neurodegenerative diseases. Hum Mol Genet. 2009;18:R169–R176. doi: 10.1093/hmg/ddp326. [DOI] [PMC free article] [PubMed] [Google Scholar]
- De Vos KJ, Grierson AJ, Ackerley S, Miller CC. Role of axonal transport in neurodegenerative diseases. Annu Rev Neurosci. 2008;31:151–173. doi: 10.1146/annurev.neuro.31.061307.090711. [DOI] [PubMed] [Google Scholar]
- Gerencser AA, Nicholls DG. Measurement of instantaneous velocity vectors of organelle transport: mitochondrial transport and bioenergetics in hippocampal neurons. Biophys J. 2008;95:3079–3099. doi: 10.1529/biophysj.108.135657. [DOI] [PMC free article] [PubMed] [Google Scholar]
- Gurskaya NG, Verkhusha VV, Shcheglov AS, Staroverov DB, Chepurnykh TV, Fradkov AF, Lukyanov S, Lukyanov KA. Engineering of a monomeric green-to-red photoactivatable fluorescent protein induced by blue light. Nat Biotechnol. 2006;24:461–465. doi: 10.1038/nbt1191. [DOI] [PubMed] [Google Scholar]
- Hasbani DM, O'Malley KL. Wld(S) mice are protected against the Parkinsonian mimetic MPTP. Exp Neurol. 2006;202:93–99. doi: 10.1016/j.expneurol.2006.05.017. [DOI] [PubMed] [Google Scholar]
- Hastings TG. The role of dopamine oxidation in mitochondrial dysfunction: implications for Parkinson's disease. J Bioenerg Biomembr. 2009;41:469–472. doi: 10.1007/s10863-009-9257-z. [DOI] [PubMed] [Google Scholar]
- Ivins KJ, Bui ET, Cotman CW. Beta-amyloid induces local neurite degeneration in cultured hippocampal neurons: evidence for neuritic apoptosis. Neurobiol Dis. 1998;5:365–378. doi: 10.1006/nbdi.1998.0228. [DOI] [PubMed] [Google Scholar]
- Jackson-Lewis V, Smeyne RJ. MPTP and SNpc DA neuronal vulnerability: role of dopamine, superoxide and nitric oxide in neurotoxicity. Minireview. Neurotox Res. 2005;7:193–202. doi: 10.1007/BF03036449. [DOI] [PubMed] [Google Scholar]
- Kadowaki M, Karim MR. Cytosolic LC3 ratio as a quantitative index of macroautophagy. Methods Enzymol. 2009;452:199–213. doi: 10.1016/S0076-6879(08)03613-6. [DOI] [PubMed] [Google Scholar]
- Kang JS, Tian JH, Pan PY, Zald P, Li C, Deng C, Sheng ZH. Docking of axonal mitochondria by syntaphilin controls their mobility and affects short-term facilitation. Cell. 2008;132:137–148. doi: 10.1016/j.cell.2007.11.024. [DOI] [PMC free article] [PubMed] [Google Scholar]
- Konzack S, Thies E, Marx A, Mandelkow EM, Mandelkow E. Swimming against the tide: mobility of the microtubule-associated protein tau in neurons. J Neurosci. 2007;27:9916–9927. doi: 10.1523/JNEUROSCI.0927-07.2007. [DOI] [PMC free article] [PubMed] [Google Scholar]
- Kuma A, Matsui M, Mizushima N. LC3, an autophagosome marker, can be incorporated into protein aggregates independent of autophagy: caution in the interpretation of LC3 localization. Autophagy. 2007;3:323–328. doi: 10.4161/auto.4012. [DOI] [PubMed] [Google Scholar]
- Li Y, Lim S, Hoffman D, Aspenstrom P, Federoff HJ, Rempe DA. HUMMR, a hypoxia- and HIF-1alpha-inducible protein, alters mitochondrial distribution and transport. J Cell Biol. 2009;185:1065–1081. doi: 10.1083/jcb.200811033. [DOI] [PMC free article] [PubMed] [Google Scholar]
- Liang CL, Wang TT, Luby-Phelps K, German DC. Mitochondria mass is low in mouse substantia nigra dopamine neurons: implications for Parkinson's disease. Exp Neurol. 2007;203:370–380. doi: 10.1016/j.expneurol.2006.08.015. [DOI] [PubMed] [Google Scholar]
- Lotharius J, Brundin P. Impaired dopamine storage resulting from alpha-synuclein mutations may contribute to the pathogenesis of Parkinson's disease. Hum Mol Genet. 2002;11:2395–2407. doi: 10.1093/hmg/11.20.2395. [DOI] [PubMed] [Google Scholar]
- Lotharius J, O'Malley KL. The parkinsonism-inducing drug 1-methyl-4-phenylpyridinium triggers intracellular dopamine oxidation. A novel mechanism of toxicity. J Biol Chem. 2000;275:38581–38588. doi: 10.1074/jbc.M005385200. [DOI] [PubMed] [Google Scholar]
- Lotharius J, O'Malley KL. Role of mitochondrial dysfunction and dopamine-dependent oxidative stress in amphetamine-induced toxicity. Ann Neurol. 2001;49:79–89. doi: 10.1002/1531-8249(200101)49:1<79::aid-ana11>3.0.co;2-d. [DOI] [PubMed] [Google Scholar]
- Lotharius J, Dugan LL, O'Malley KL. Distinct mechanisms underlie neurotoxin-mediated cell death in cultured dopaminergic neurons. J Neurosci. 1999;19:1284–1293. doi: 10.1523/JNEUROSCI.19-04-01284.1999. [DOI] [PMC free article] [PubMed] [Google Scholar]
- Matsuda N, Sato S, Shiba K, Okatsu K, Saisho K, Gautier CA, Sou YS, Saiki S, Kawajiri S, Sato F, Kimura M, Komatsu M, Hattori N, Tanaka K. PINK1 stabilized by mitochondrial depolarization recruits Parkin to damaged mitochondria and activates latent Parkin for mitophagy. J Cell Biol. 2010;189:211–221. doi: 10.1083/jcb.200910140. [DOI] [PMC free article] [PubMed] [Google Scholar]
- Meissner W, Prunier C, Guilloteau D, Chalon S, Gross CE, Bezard E. Time-course of nigrostriatal degeneration in a progressive MPTP-lesioned macaque model of Parkinson's disease. Mol Neurobiol. 2003;28:209–218. doi: 10.1385/MN:28:3:209. [DOI] [PubMed] [Google Scholar]
- Morfini G, Pigino G, Opalach K, Serulle Y, Moreira JE, Sugimori M, Llinás RR, Brady ST. 1-Methyl-4-phenylpyridinium affects fast axonal transport by activation of caspase and protein kinase C. Proc Natl Acad Sci U S A. 2007;104:2442–2447. doi: 10.1073/pnas.0611231104. [DOI] [PMC free article] [PubMed] [Google Scholar]
- Murphy MP, Krueger MJ, Sablin SO, Ramsay RR, Singer TP. Inhibition of complex I by hydrophobic analogues of N-methyl-4-phenylpyridinium (MPP+) and the use of an ion-selective electrode to measure their accumulation by mitochondria and electron-transport particles. Biochem J. 1995;306:359–365. doi: 10.1042/bj3060359. [DOI] [PMC free article] [PubMed] [Google Scholar]
- Nakano A, Kato H, Watanabe T, Min KD, Yamazaki S, Asano Y, Seguchi O, Higo S, Shintani Y, Asanuma H, Asakura M, Minamino T, Kaibuchi K, Mochizuki N, Kitakaze M, Takashima S. AMPK controls the speed of microtubule polymerization and directional cell migration through CLIP-170 phosphorylation. Nat Cell Biol. 2010;12:583–590. doi: 10.1038/ncb2060. [DOI] [PubMed] [Google Scholar]
- Nakata T, Terada S, Hirokawa N. Visualization of the dynamics of synaptic vesicle and plasma membrane proteins in living axons. J Cell Biol. 1998;140:659–674. doi: 10.1083/jcb.140.3.659. [DOI] [PMC free article] [PubMed] [Google Scholar]
- Narendra D, Tanaka A, Suen DF, Youle RJ. Parkin is recruited selectively to impaired mitochondria and promotes their autophagy. J Cell Biol. 2008;183:795–803. doi: 10.1083/jcb.200809125. [DOI] [PMC free article] [PubMed] [Google Scholar]
- Narendra DP, Jin SM, Tanaka A, Suen DF, Gautier CA, Shen J, Cookson MR, Youle RJ. PINK1 is selectively stabilized on impaired mitochondria to activate Parkin. PLoS Biol. 2010;8:e1000298. doi: 10.1371/journal.pbio.1000298. [DOI] [PMC free article] [PubMed] [Google Scholar]
- Obata T. Nitric oxide and MPP+-induced hydroxyl radical generation. J Neural Transm. 2006;113:1131–1144. doi: 10.1007/s00702-005-0415-0. [DOI] [PubMed] [Google Scholar]
- Orimo S, Uchihara T, Nakamura A, Mori F, Ikeuchi T, Onodera O, Nishizawa M, Ishikawa A, Kakita A, Wakabayashi K, Takahashi H. Cardiac sympathetic denervation in Parkinson's disease linked to SNCA duplication. Acta Neuropathol. 2008;116:575–577. doi: 10.1007/s00401-008-0428-5. [DOI] [PubMed] [Google Scholar]
- Raff MC, Whitmore AV, Finn JT. Axonal self-destruction and neurodegeneration. Science. 2002;296:868–871. doi: 10.1126/science.1068613. [DOI] [PubMed] [Google Scholar]
- Reis K, Fransson A, Aspenström P. The Miro GTPases: at the heart of the mitochondrial transport machinery. FEBS Lett. 2009;583:1391–1398. doi: 10.1016/j.febslet.2009.04.015. [DOI] [PubMed] [Google Scholar]
- Rui Y, Tiwari P, Xie Z, Zheng JQ. Acute impairment of mitochondrial trafficking by beta-amyloid peptides in hippocampal neurons. J Neurosci. 2006;26:10480–10487. doi: 10.1523/JNEUROSCI.3231-06.2006. [DOI] [PMC free article] [PubMed] [Google Scholar]
- Saha AR, Hill J, Utton MA, Asuni AA, Ackerley S, Grierson AJ, Miller CC, Davies AM, Buchman VL, Anderton BH, Hanger DP. Parkinson's disease alpha-synuclein mutations exhibit defective axonal transport in cultured neurons. J Cell Sci. 2004;117:1017–1024. doi: 10.1242/jcs.00967. [DOI] [PubMed] [Google Scholar]
- Serra PA, Sciola L, Delogu MR, Spano A, Monaco G, Miele E, Rocchitta G, Miele M, Migheli R, Desole MS. The neurotoxin 1-methyl-4-phenyl-1,2,3,6-tetrahydropyridine induces apoptosis in mouse nigrostriatal glia: relevance to nigral neuronal death and striatal neurochemical changes. J Biol Chem. 2002;277:34451–34461. doi: 10.1074/jbc.M202099200. [DOI] [PubMed] [Google Scholar]
- Stirling DP, Stys PK. Mechanisms of axonal injury: internodal nanocomplexes and calcium deregulation. Trends Mol Med. 2010;16:160–170. doi: 10.1016/j.molmed.2010.02.002. [DOI] [PMC free article] [PubMed] [Google Scholar]
- Storch A, Ludolph AC, Schwarz J. Dopamine transporter: involvement in selective dopaminergic neurotoxicity and degeneration. J Neural Transm. 2004;111:1267–1286. doi: 10.1007/s00702-004-0203-2. [DOI] [PubMed] [Google Scholar]
- Surmeier DJ. Calcium, ageing, and neuronal vulnerability in Parkinson's disease. Lancet Neurol. 2007;6:933–938. doi: 10.1016/S1474-4422(07)70246-6. [DOI] [PubMed] [Google Scholar]
- Taylor AM, Blurton-Jones M, Rhee SW, Cribbs DH, Cotman CW, Jeon NL. A microfluidic culture platform for CNS axonal injury, regeneration and transport. Nat Methods. 2005;2:599–605. doi: 10.1038/nmeth777. [DOI] [PMC free article] [PubMed] [Google Scholar]
- Trimmer PA, Schwartz KM, Borland MK, De Taboada L, Streeter J, Oron U. Reduced axonal transport in Parkinson's disease cybrid neurites is restored by light therapy. Mol Neurodegener. 2009;4:26. doi: 10.1186/1750-1326-4-26. [DOI] [PMC free article] [PubMed] [Google Scholar]
- Van Laar VS, Arnold B, Cassady SJ, Chu CT, Burton EA, Berman SB. Bioenergetics of neurons inhibit the translocation response of Parkin following rapid mitochondrial depolarization. Hum Mol Genet. 2011;20:927–940. doi: 10.1093/hmg/ddq531. [DOI] [PMC free article] [PubMed] [Google Scholar]
- Wang X, Schwarz TL. Imaging axonal transport of mitochondria. Methods Enzymol. 2009;457:319–333. doi: 10.1016/S0076-6879(09)05018-6. [DOI] [PMC free article] [PubMed] [Google Scholar]
- Ward MW. Quantitative analysis of membrane potentials. Methods Mol Biol. 2010;591:335–351. doi: 10.1007/978-1-60761-404-3_20. [DOI] [PubMed] [Google Scholar]
- Weihofen A, Thomas KJ, Ostaszewski BL, Cookson MR, Selkoe DJ. Pink1 forms a multiprotein complex with Miro and Milton, linking Pink1 function to mitochondrial trafficking. Biochemistry. 2009;48:2045–2052. doi: 10.1021/bi8019178. [DOI] [PMC free article] [PubMed] [Google Scholar]
- Yang ML, Hasadsri L, Woods WS, George JM. Dynamic transport and localization of alpha-synuclein in primary hippocampal neurons. Mol Neurodegener. 2010;5:9. doi: 10.1186/1750-1326-5-9. [DOI] [PMC free article] [PubMed] [Google Scholar]
- Yang Z, Klionsky DJ. Mammalian autophagy: core molecular machinery and signaling regulation. Curr Opin Cell Biol. 2010;22:124–131. doi: 10.1016/j.ceb.2009.11.014. [DOI] [PMC free article] [PubMed] [Google Scholar]
- Yokoyama H, Kuroiwa H, Yano R, Araki T. Targeting reactive oxygen species, reactive nitrogen species and inflammation in MPTP neurotoxicity and Parkinson's disease. Neurol Sci. 2008;29:293–301. doi: 10.1007/s10072-008-0986-2. [DOI] [PubMed] [Google Scholar]
- Zhu JH, Horbinski C, Guo F, Watkins S, Uchiyama Y, Chu CT. Regulation of autophagy by extracellular signal-regulated protein kinases during 1-methyl-4-phenylpyridinium-induced cell death. Am J Pathol. 2007;170:75–86. doi: 10.2353/ajpath.2007.060524. [DOI] [PMC free article] [PubMed] [Google Scholar]