Abstract
Matrix proteins play multiple roles both in early and late stages of the viral replication cycle. Their N-terminal myristoylation is important for interaction with the host cell membrane during virus budding. We used Escherichia coli, carrying N-myristoyltransferase gene, for the expression of the myristoylated His-tagged matrix protein of Mason-Pfizer monkey virus. An efficient, single-step purification procedure eliminating all contaminating proteins including, importantly, the non-myristoylated matrix protein was designed. The comparison of NMR spectra of matrix protein with its myristoylated form revealed substantial structural changes induced by this fatty acid modification.
Keywords: M-PMV, matrix protein, myristoylation, retrovirus, N-myristoyl transferase
Introduction
Mason-Pfizer monkey virus (M-PMV) belongs to the family of betaretroviruses which form immature virus-like particles (VLP) within the cytoplasm of infected cells. VLPs are then transported to the plasma membrane for budding. In contrast, the immature particles of lentiviruses (e.g. HIV-1) are assembled directly on the inner leaflet of the cell membrane instantly before budding[1]. Temporal and spatial separation of assembly and budding in M-PMV enables to study these processes independently.
Matrix protein (MA) is the N-terminal domain of the structural polyprotein precursor Gag of all retroviruses. During the late phase of virus life cycle it is involved in the transport of Gag protein to the site of assembly of VLPs and afterwards in the association of VLP with the plasma membrane (PM) prior to budding[2]. In betaretroviruses the MA domain controls also the transport of VLPs from the pericentriolar region to the plasma membrane[3].
Most retroviral MAs are N-terminally myristoylated. The attachment of C14 fatty acid to the N-terminal glycine is a common posttranslational modification of eukaryotic proteins and it is one of three already described N-terminal fatty acylation motifs which confer binding to the membrane[4]. In contrast to numerous structures of non-myristoylated retroviral MAs, only two of myristoylated retroviral MAs have been published up to date[5,6].
Significant role of the myristoylation has been proved in the transport of Gag to the assembly site. Myristate and surface patch of basic residues of the MA molecule are essential for the association of Gag with PM[7,8,9]. On one side, the binding of MA to the plasma membrane must be tight, but on the other side it has to be reversible to allow a release of the MA protein from the membrane upon infection[10]. To fulfill such requirement, the MA protein exists in two states, i.e. myr-exposed [myr(e)] and myr-sequestered [myr(s)] as it was demonstrated by Tang et al. [5]. Such change of the state is called “myristoyl switch”, which has been described also for other N-terminally myristoylated proteins like recoverin or ADB ribosylation factor[11,12]. While in cytoplasm, the myristic moiety is buried inside a hydrophobic cavity of MA in the myr(s) state and it becomes exposed when Gag (soluble or assembled in VLP) approaches the plasma membrane to mediate the protein-membrane interaction. Saad et al. reported that phosphatidylinositol-4,5-bisphosphate triggers the myristoyl switch in HIV MA[13]. Furthermore, Tang et al. also discovered that the MA domain forms trimers through the interaction of the exposed myristates[5]. Trimers are readily formed due to an increased concentration of Gag proteins in lipid raft domains which are part of the PM[10,14]. Therefore, it is the formation of trimers that triggers the myristoyl switch. When the concentration of MA drops upon infection of a new cell the trimers disintegrate, the myristate is buried and MA is released from the membrane.
Recently, we have reported that in contrast to the HIV-1 MA, the non-myristoylated M-PMV MA protein readily forms trimers upon increasing its concentration in solution[15]. The increased oligomerization capacity of M-PMV MA is probably related to the necessity to stabilize Gag within the capsid shell[15].
Here we report the production and isolation of N-terminally myristoylated matrix protein of M-PMV for structural and functional study by nuclear magnetic resonance spectroscopy (NMR) and mass spectrometry (MS). NMR spectroscopy requires highly concentrated protein sample uniformly labeled with 13C and 15N isotopes. Labeled proteins are usually produced in bacterial cells, because they can grow on relatively cheap minimal media and produce high yields of proteins.
Materials and Methods
Microorganism strains and media
Escherichia coli strain DH5α was used as a host for vector amplification while E. coli strain BL21 (DE3) was used for the production of the recombinant proteins. Cells were grown in Luria-Bertani medium (LB, 1% Tryptone, 1% NaCl, 0.5% yeast extract (w/w)) containing ampicillin (100 mg/l) and when using two-plasmid system also kanamycin (50mg/l). For the production of isotopically labeled proteins the cells were grown in the M9 minimal medium[16] containing the same amount of the antibiotics.
Construction of production vectors
The sequence encoding the matrix protein and downstream 18 amino acids of phosphoprotein (PP) was introduced to the pET22b vector (Novagen) using the NdeI and XhoI restriction sites. PCR product was generated using primers MA_Nde_fwd (GTCACTCATATGGGGCAAGAATTAAGCCAG) and MA_Xho_bwd (AGTGACCTCGAGGTCTGTTTGAGAATTAC) and proviral vector pSARM4[17] as a template. The product was cleaved by the appropriate restriction enzymes (New England Biolabs) and then ligated to the pET22b vector cleaved by the same enzymes to join the sequence encoding the His-tag (Fig. 1A). The resulting vector pEMAPPHis was verified by restriction cleavage and by sequencing.
Figure 1.
Schematic representation of vectors for expression of MAPPHis and NMT. (A) the plasmid based on the pET22b vector coding gene for MAPPHis used in the two-plasmid expression system, (B) the plasmid based on the pET29b vector coding gene for NMT used in the two-plasmid expression system, (C) the plasmid carrying both MAPPHis and NMT genes constructed on the basis of the pET19b and pET11b vectors used in the single-plasmid system.
The vector pETyNMT for the production of yeast N-myristoyltransferase was constructed by inserting the gene encoding the enzyme to the pET29b vector (Novagen) using the NdeI and XhoI restriction sites (Fig. 1B). The stop codon was introduced to the end of the gene.
The expression vector carrying both genes was constructed by inserting the gene encoding the matrix protein and 18 amino acids from phosphoprotein together with the His-tag (MAPPHis) in a plasmid containing a gene encoding the yeast N-myristoyltransferase. PCR product, containing a gene for MAPPHis was generated using primers MAyNMT_NcoI_fwd (AACGTACCATGGGGCAAGAATTAAGCCAGC) and MAPPHISyNMT_PstI_bwd (TCTTAGCTGCAGTTAGTGGTGGTGGTGGTGGTGC) and above described plasmid pEMAPPHis as a template. The acceptor vector was a kind gift of Prof. Michael Summers (Howard Hughes Medical Institute). This vector, based on the pET19b and pET11b vectors already harbors the gene encoding the yeast N-myristoyltransferase. The resulting PCR product was cleaved by restriction enzyme NcoI, the acceptor vector was cleaved by NcoI and XhoI enzymes (all from New England Biolabs). The XhoI site was then removed by the action of Mung Bean Nuclease (New England Biolabs). Semiblunt ligation was performed and the resulting vector pEMAPPHisyNMT was verified by sequencing (Fig. 1C).
In order to introduce both plasmids pEMAPPHis and pETyNMT, competent E. coli cells transformed by the pETyNMT vector were prepared by a standard protocol[16]. The plasmid pEMAPPHis was then introduced in bacteria and the positive transformants were selected on the LB agar containing ampicillin and kanamycin.
Production of recombinant myrMAPPHis
Transformed E. coli BL21(DE3) cells, containing the expression vector, were grown to OD590 0.5, then sodium myristate dissolved in water was added to the final concentration of 0.06 mM. Protein expression was induced 30 minutes later by adding isopropyl-β-D-thiogalactopyranoside (IPTG) to the concentration of 0.4 mM and the cells were then cultivated for 4 hours at 37 °C. The cells were pelleted by centrifugation at 12 000 × RCF for 10 minutes. Supernatants were discarded and pellets were resuspended in 30 ml of lysis buffer (50 mM phosphate, 300 mM NaCl, 10 mM imidazole, pH 8) and frozen at −20 °C.
Disruption of cells containing the recombinant protein
The cell suspension was thawed and combined with Complete inhibitor mix (Roche) and 30 mg of lysozyme. The mixture was shaken and incubated at room temperature for 30 minutes, followed by sonication with 50W for 1.5 minutes. To remove proteins bound on the cell membrane 0.1% (w/w) sodium deoxycholate was added and the lysate was incubated for 30 minutes at 4 °C. To decrease the viscosity of the cell lysate it was incubated for 30 minutes at 37 °C with DNase and RNase (10 µg/ml). Insoluble parts of the cells were pelleted by centrifugation at 30 000 RCF for 15 minutes. Pellets were resuspended in 30 ml lysis buffer (PE) and supernatant containing soluble myrMAPPHis (SU) was used for protein purification.
Purification of myrMAPPHis by metal- affinity chromatography
Following the centrifugation, 4ml of Ni-NTA agarose (Qiagen) were added to SU and the mixture was incubated for 1 hour at 4° C. The agarose was washed with 20 ml of lysis buffer and 20 ml of protease buffer (100mM phosphate, 900 mM NaCl, pH 6.25). Following the washing step, the agarose was resuspended in 4ml of protease buffer containing 0.2 mg of recombinant M-PMV protease (Pr13) prepared in our laboratory as described by Zabransky at al.[18]. MyrMAPPHis was cleaved for 1 hour at room temperature with shaking. The cleaved protein was separated and the intact myrMAPPHis was then eluted using imidazole buffer (1 hour, 50mM phosphate, 200 mM imidazole, pH 7, 4° C). Samples from purification and cell disruption were analyzed by Tris-Tricine SDS-PAGE stained by Coomassie blue.
Preparation of protein sample for MALDI-TOF measurements
Purified myrMAPPHis was exchanged to MS buffer (100 mM phosphate, 100 mM NaCl, 5 mM dithiothreitol, pH 6) using PD-10 desalting column (GE Healthcare). For peptide mapping experiments the protein sample was additionally purified using gel permeation chromatography on HiLoad 26/60 Superdex 75PG column (Amersham) with isocratic elution (100 mM phosphate, 100 mM NaCl, 0.01% mercaptoethanol (v/v), pH 6). The flow rate was 2.3 ml/min. and 4 ml fractions were collected. Chromatography was monitored by UV spectroscopy at 280 nm and the largest peak at 213 ml was collected.
Peptide mapping method
MyrMAPPHis was digested by trypsin and chymotrypsin in MS buffer at 37 °C for two hours. Enzyme to substrate ratio used for both enzymes was 1:20 (w/w). Protein cleavage was stopped by adding TFA to the final concentration of 0.5% (v/v). Solution of peptides was purified and concentrated by ZipTip C18 pipette tips (Millipore).
Mass spectrometry
Peptide and intact protein spectra were obtained using Biflex IV MALDI-TOF mass spectrometer (Bruker Daltonics, Germany), equipped with a UV nitrogen laser (337 nm) and a dual microchannel microplate detector. The spectra of intact proteins were acquired in positive linear mode within a mass range of 2,000 to 20,000 Da. The samples were prepared by mixing 1 µl of protein solution with 4 µl of freshly prepared matrix solution (10 mg/ml of 3,5-dimethoxy-4-hydroxycinnamic acid in 1:2 acetonitrile:0,1% TFA). Bruker protein calibration standard I (Bruker) was used for the calibration. The spectra of peptides were acquired in the positive reflector mode within a mass range of 500 to 4,000 Da. Samples of peptides were prepared by mixing 1 µl of peptide solution and 1 µl of freshly prepared matrix solution (20 mg/ml of 2,5-dihydroxybenzoic acid in 1:2 acetonitrile:0,1% TFA). Bruker peptide calibration standard I (Bruker) was used for the calibration. In both cases a total of 1 µl of mixture was placed on a stainless steel probe plate and allowed to dry at room temperature. To reduce spot to spot signal variation at least 300 of individual spectra were collected and averaged. Spectra were analyzed using mMass software[19].
Preparation of protein sample for NMR measurements
Purified myrMAPPHis was exchanged to NMR buffer (100 mM phosphate, 300 mM NaCl, 5 mM dithiothreitol, 5% D2O, pH 6) using PD-10 desalting column. The protein sample was then concentrated using Amicon Ultra – 15 Ultracel 5k (Millipore) to the final concentration of 0.5 mM. The concentration of the protein was determined by UV- spectroscopy at 280 nm using extinction coefficient 23590 M−1cm−1 determined by ProtParam[20].
NMR measurements
All NMR spectra were measured at 25°C on a Bruker Avance III 600 spectrometer equipped with a triple-resonance cryoprobe (Bruker BioSpin GmbH). The 1H-15N HSQC were acquired with a spectral width of 7003 Hz and 2048 complex points in the 1H dimension and with 1521 Hz and 180 complex points in the 15N dimension. The 1H-13C HSQC were acquired with a spectral width of 9615 Hz and 2048 complex points in 1H dimension and width 13582 Hz and 256 complex point in 13C dimension and all spectra were processed using TopSpin software (Bruker BioSpin GmbH, version 2.1) and NMRPipe[21] and analyzed using Sparky software[22].
Results and Discussion
Protein expression and purification
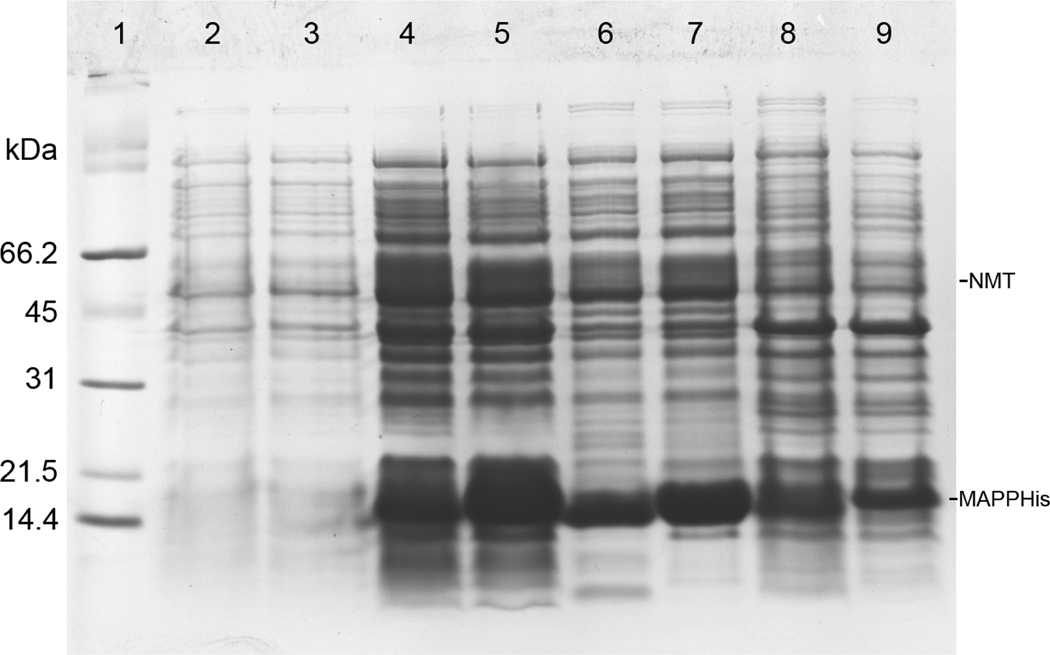
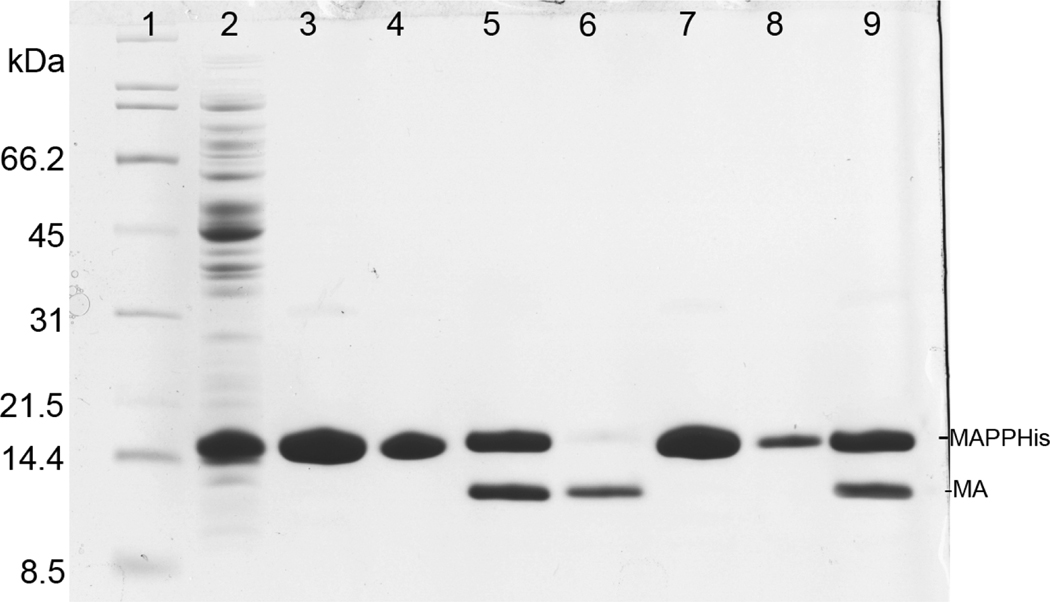
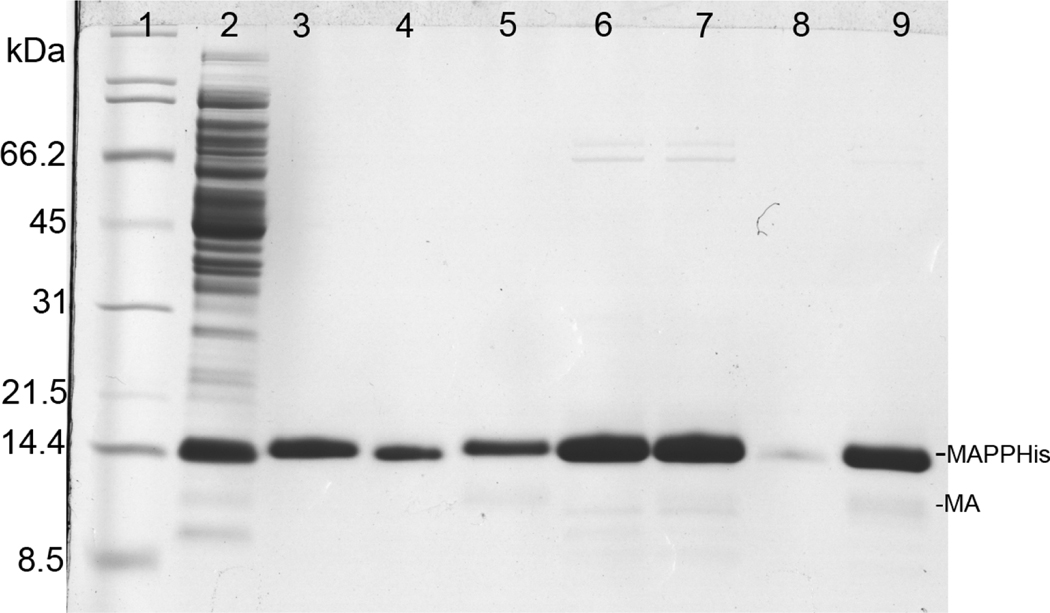
Both single- and two-plasmid vectors showed a strong expression of the recombinant protein as demonstrated in Fig. 2 (lanes 4, 5). However, the overall yield of the myristoylated protein was about 65% of the production of the non-myristoylated MA in both cases. Following the cell disruption and centrifugation most of the MA protein was soluble and could be found in supernatant (Fig. 2, lanes 6, 7). Only a small amount of myrMAPPHis remained in the pellet (Fig. 2, lanes 8, 9). The purification process of myrMAPPHis is illustrated on Figures 3 (single-plasmid system) and 4 (two-plasmid system). Initially we sought to prepare the myrMA without the His-tag and the N-terminal part of phosphoprotein by cleaving the myrMAPPHis product by recombinant M-PMV protease (Pr13) using similar protocol as for the non-myristoylated protein[23]. However, Pr13 cleaved myristoylated MAPPHis very poorly when compared to the non-myristoylated protein. This phenomenon was utilized in a new purification procedure when the non-myristoylated MA was proteolytically released from the immobilized PPHis, while the myristoylated MAPPHis remained attached to the Ni-NTA resin from where it was subsequently eluted by imidazole. To illustrate the efficiency of the process, the myrMAPPHis bound on the Ni-NTA resin was split into two aliquots that were loaded on the column and washed. The first one was then directly eluted with imidazole and analyzed (Fig. 3 and 4, lanes 3). The second aliquot was incubated with Pr13 for one hour at room temperature. The cleaved nonmyristoylated MA was collected (Fig. 3 and 4, lane 6) and the intact myrMAPPHis bound on the Ni-NTA was eluted by imidazole (Fig. 3 and 4, lane 7). To test whether the binding of myrMAPPHis to the Ni-NTA did not prevent the proteolytic cleavage, a small sample of the myrMAPPHis eluted from the column was exchanged to the protease buffer and incubated with Pr13 for one hour. From the comparison of lanes 5 and 9 on Figures 3 and 4, respectively, it is obvious that the proteolysis efficiency is comparable and therefore, it is not the binding of myrMAPPHis on the Ni-NTA column that prevents the cleavage.
Figure 2.
Coomassie stained SDS-PAGE gel illustrating the production of myrMAPPHis and cell lysis. Odd lanes show proteins produced from the two-plasmid system, even lanes show proteins produced in the single-plasmid system. Lanes: (1) broad range SDS-PAGE standard (Bio-Rad), (2, 3) cells before induction, (4, 5) cells 4h after induction, (6, 7) supernatant after cell lysis, (8, 9) pellet after cell lysis. MAPPHis is the large band with Mw 14.5 kDa, lanes 6–9 also contain lysozyme, which has similar mobility as MAPPHis. NMT has molecular weight of 55 kDa, but it can not be distinguished from other bacterial proteins.
Figure 3.
Coomassie stained SDS-PAGE gel illustrating purification of myrMAPPHis produced using the single-plasmid system. Lanes 3–5 show purification of the first aliquot directly eluted by imidazole buffer and lanes 6–9 show purification of the second aliquot which was cleaved on Ni-NTA and then eluted by imidazole. Lanes: (1) broad range SDS-PAGE standard (Bio-Rad), (2) flow-through after binding (14 kDa band is lysozyme), (3) protein eluted from column using imidazole buffer, (4) sample of Ni-NTA agarose after elution, (5) eluate (the same as in lane 3) cleaved by Pr13 for 1 hour, (6) protein cleaved from Ni-NTA by Pr13, (7) protein eluted from column using imidazole buffer after cleavage, (8) sample of Ni-NTA agarose after elution, (9) eluate (the same as in lane 7) cleaved by Pr13 for 1 hour
Figure 4.
Coomassie stained SDS-PAGE gel illustrating Ni-NTA purification of myrMAPPHis produced using the two-plasmid system. Lanes 3–5: purification of the first aliquot directly eluted by imidazole buffer and lanes 6–9: purification of the second aliquot, which was cleaved on Ni-NTA and then eluted by imidazole. Lanes: (1) broad range SDS-PAGE standard (Bio-Rad), (2) flow-through after binding (14 kDa band is lysozyme), (3) proteins eluted by imidazole buffer, (4) sample of Ni-NTA agarose after elution, (5) eluate (the same as in lane 3) cleaved by Pr13 for 1 hour, (6) protein cleaved from Ni-NTA by Pr13, (7) protein eluted from column using imidazole buffer after cleaving, (8) sample of Ni-NTA agarose after elution, (9) eluate (the same as in lane 7) cleaved by Pr13 for 1 hour
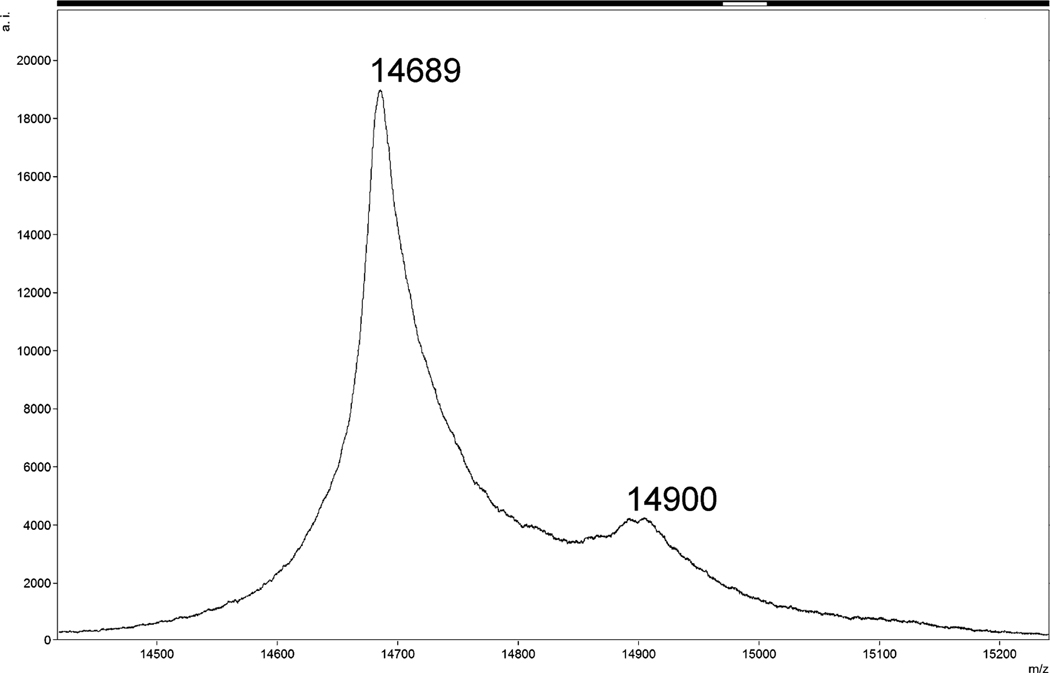
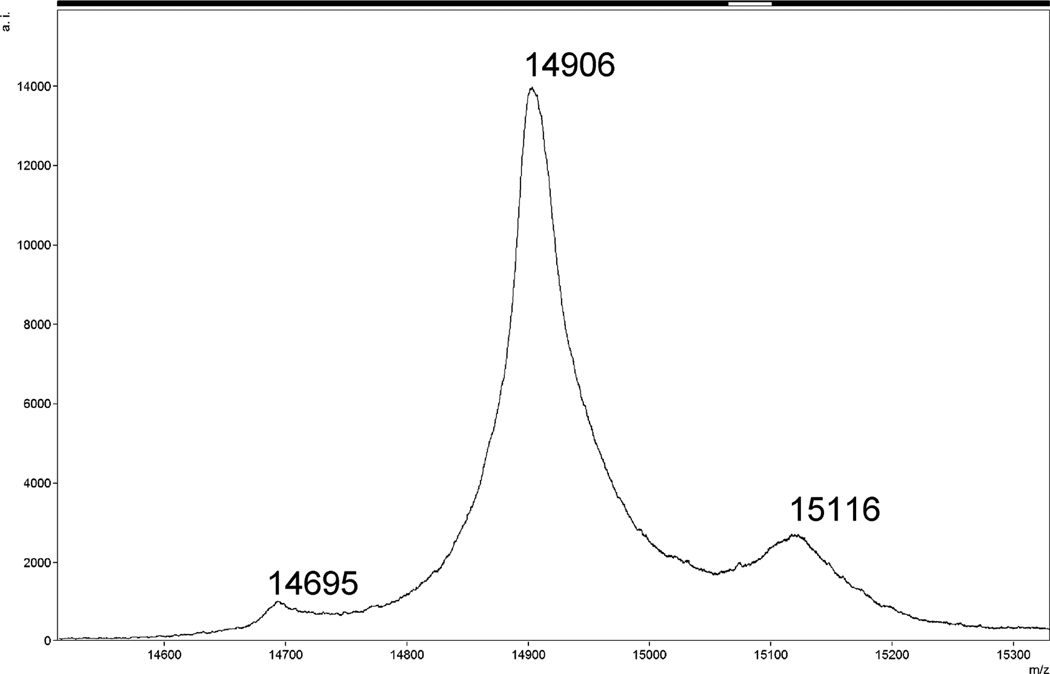
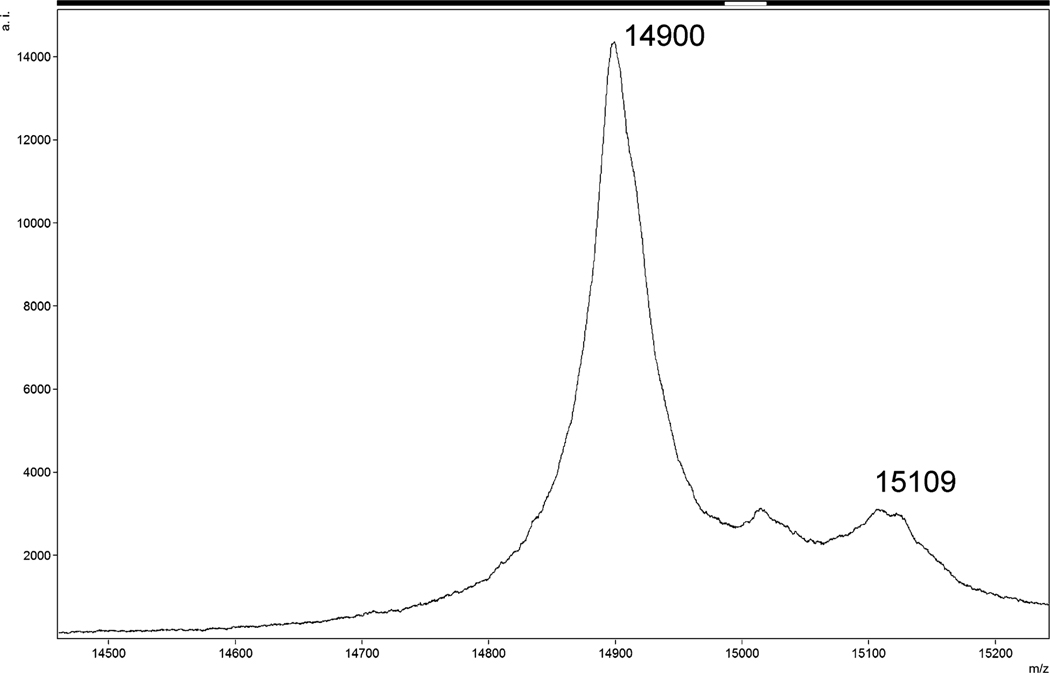
The single-plasmid system yielded insufficiently myristoylated protein (less than 25%) (Fig. 5). The content of the myristoylated MA in the sample was partially increased by removing the non-myristoylated MAPPHis by its cleavage on the Ni-NTA column. However, the complete cleavage of the non-myristoylated MAPPHis would require a higher amount of Pr13 and the yield of myrMAPPHis would still remain lower than 33%. Therefore, we focused our attention to the two-plasmid system. The degree of myristoylation increased to over 90% (Fig. 6) and after removing the non-myristoylated MAPPHis (some myrMAPPHis was eluted during the cleavage) we obtained a product containing over 95% of the required myristoylated protein (Fig. 7). The yield of the product (especially of the isotopically labeled MA) was increased by elution of residual traces of myrMAPPHis from the Ni-NTA resin during repeated washing with imidazole (at least twice).
Figure 5.
MALDI-TOF MS spectrum of purified myrMAPPHis obtained from the single-plasmid system (same sample as in Fig. 3 lane 7). The m/z ratio of larger peak corresponds to Mw of non-myristoylated MAPPHis.
Figure 6.
MALDI-TOF MS spectrum of myrMAPPHis obtained from the two-plasmid system without cleavage by Pr13 on Ni-NTA (same sample as in Fig. 4 lane 3). Mw The m/z ratio of larger peak corresponds to Mw of myristoylated MAPPHis. Peak with m/z ratio of 15116 is an adduct of myrMAPPHis and MS matrix.
Figure 7.
MALDI-TOF MS spectrum of purified myrMAPPHis obtained from the two-plasmid system (the same sample as in Fig. 4 lane 7). The m/z ratio of larger peak corresponds to Mw of myristoylated MAPPHis. Peak with m/z ratio of 15109 is again an adduct of myrMAPPHis and MS matrix.
Preparation of myrMAPPHis for NMR and MALDI-TOF measurements
NMR spectroscopy requires a higher concentration of protein samples compared to other spectroscopic methods. We found that higher ionic strength (300 mM NaCl) increased the solubility of the myrMAPPHis. This allowed concentrating the myrMAPPHis sample to the final concentration of 0.5 mM. After several days, a minor precipitation appeared but most of the protein remained in solution (the final concentration was approximately 0.4 mM) and the sample was stable for several months (verified by repeated 1H-15N HSQC experiments).
Although MALDI-TOF analysis does not require such a high concentration of protein as NMR spectroscopy, the protein was dissolved in a buffer containing 100 mM NaCl to increase its stability in solution. However, such a high concentration of salt would deteriorate the quality of MS spectra. The sample was therefore mixed with the mass spectrometry matrix in ratio 1:4 immediately before the measurement to lower its ionic strength. ZipTip C18 pipette tips were not used as they would remove a significant portion of the myristoylated MAPPHis.
MALDI-TOF measurement
The major signal of m/z = 14,900 which represents the myrMAPPHis was present in the mass spectrum. We also detected a signal of the non-myristoylated MAPPHis (m/z = 14,686), but its intensity was quite low when compared to the myrMAPPHis (Fig. 6). This signal disappeared completely after the final purification step. Mixtures of the myrMAPPHis with the non-myristoylated MAPPHis ranging from ratio 10:1 to 1:10 (w/w) were prepared to quantify the content of the myristoylated protein in the sample. The intensity ratios of measured signals corresponded well to myr-/non-myr MAPPHis ratios which allowed determination of the amount of the myristoylated MAPPHis. In isotopically labeled (13C/15N) samples this ratio was easily determined by NMR spectroscopy (vide infra). All samples used for MS or NMR studies contained less than 5% of the non-myristoylated MAPPHis. Peptide mapping method confirmed the identity of N-terminal peptides with the bound myristic acid. In the case of trypsin digestion 98% sequence coverage was achieved and by using chymotrypsin the sequence coverage was 92%. The results confirmed the quality of the myrMAPPHis.
NMR experiments
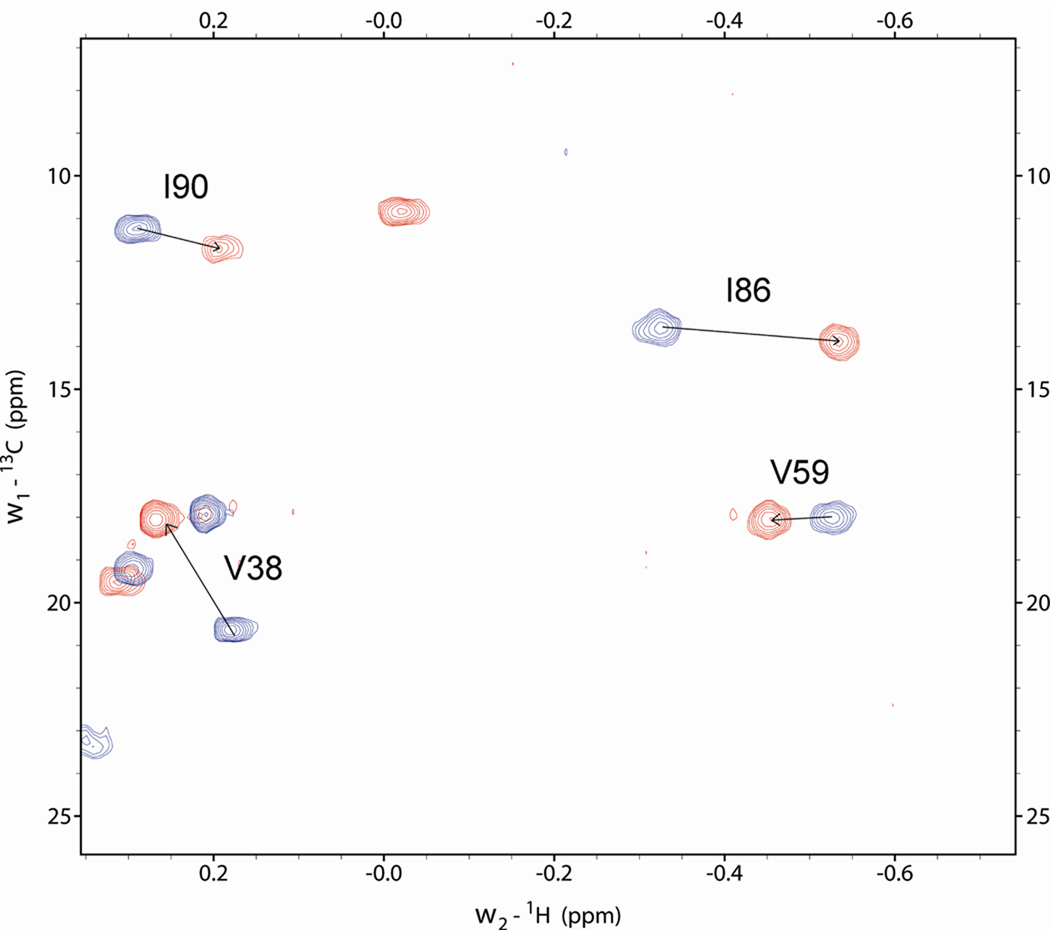
13C-filtered 1H spectra and 2D 1H-13C HSQC were acquired to verify the content of the myrMAPPHis in the sample. Due to the binding of the myristic acid in the hydrophobic cavity it was possible to discriminate the signals of methyl groups of Val 38 and 59 and Ile 86 and 90 from the myristoylated and non-myristoylated proteins (Fig. 8, 1D spectra not shown). The ratio of their signal volumes corresponded directly to the ratio of their contents in the sample.
Figure 8.
Overlay of region of 1H-13C HSQC spectra, measured on myrMAPPHis (red) and MAPPHis (blue), showing signals of gamma methyl groups of isoleucines 86 and 90 and valines 38 and 59, respectively.
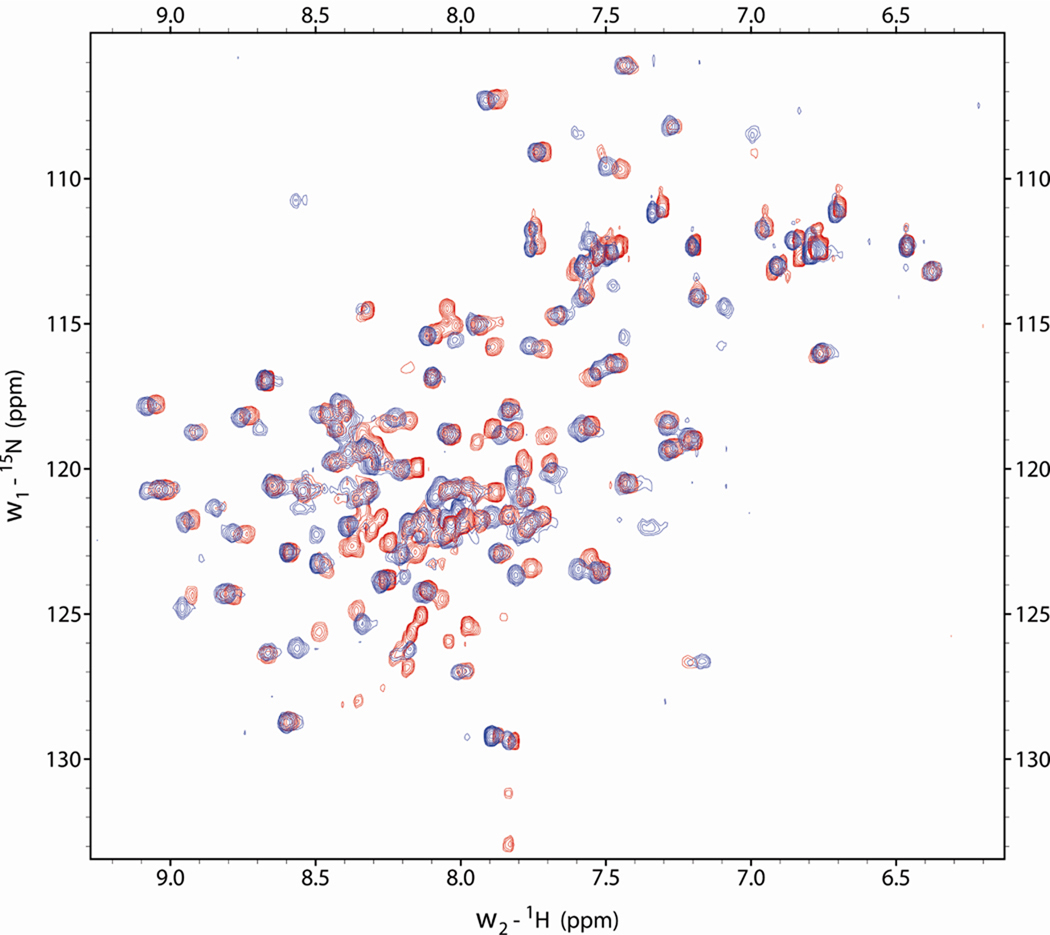
The 1H-15N HSQC spectra of the non-myristoylated MA and MAPPHis were measured and compared to prove that the PPHis tail does not affect the structure of the MA domain (Fig. 9). Both spectra differed substantially only in chemical shifts of the cross peaks of the last 5 amino acid residues, which form the originally unstructured C-terminus of the MA domain, when omitting the signals of the PPHis part. The changes may be caused by a partial immobilization of this amino acid stretch working as a linker between the MA and PPHis domains in the MAPPHis molecule. The remaining signals of the MA protein core corresponded well for both MA and MAPPHis, which means that the PPHis tail does not have any significant impact on the structure of MA.
Figure 9.
Overlay of 1H-15N HSQC spectra measured on MAPPHis (red) and MA (blue). Signals with different chemical shifts are located at the C-terminus of MA.
On the other hand, comparison of 1H-15N HSQC and 1H-13C HSQC spectra of the myristoylated and non-myristoylated MAPPHis showed large changes of chemical shifts of the corresponding signals (Fig. 8). Although we do not expect significant changes in the global MA structure caused by the presence of the myristic acid inside the protein core, a slightly different mutual arrangement of all four α-helices might be found. Similar phenomenon occurred when the myristoylated and non-myristoylated HIV-1 Nef protein were compared[24]. Therefore, to determine structural changes triggered by the buried myristic acid, the structure of the whole myrMAPPHis will be determined ab initio.
Conclusion
We have demonstrated that a large quantity of pure myristoylated M-PMV myrMA can be prepared as a fusion protein myrMAPPHis produced together with the yeast N-myristoyltransferase using the two-plasmid system. Due to a weak processing of the myristoylated fusion protein myrMAPPHis by 13 kDa form of M-PMV protease, it was advantageous to leave it intact, i.e. in the form of the matrix protein which is C-terminally flanked with a stretch of the first 18 amino acid residues from the phosphoprotein followed by His-tag purification anchor. We have proved that the C-terminal extension (PPHis) does not affect the tertiary structure of the MA domain. The contamination with the non-myristoylated M-PMV MA was less than 5% as evidenced from MS and/or NMR spectra. The protein is suitable for structural studies by a combination of isotopically aided NMR spectroscopy and computational methods. For the MS studies the protein was additionally purified using gel filtration chromatography. We also evaluated the production of the myristoylated M-PMV MA in the single-plasmid system, which had been successfully used for the production of the myristoylated HIV-1 MA. However, the degree of myristoylation was very low. A plausible explanation for the higher myristoylation efficiency of the two-plasmid system might be a higher amount of the produced NMT. However, the direct comparison of the amount of NMT expressed by both systems is prevented due to the presence of much higher amounts of numerous cellular proteins of comparable size (55 kDa). The availability of large quantities of the myristoylated M-PMV MA of sufficient purity will allow further characterization of its structural and functional features. Preliminary data indicate that the myristoylation caused large changes of chemical shifts of signals of backbone NH groups of the MA domain. The changes are much larger when compared with HIV-1 myrMA and spread over the whole molecule. Therefore, we hypothesize that either the myristate is buried deeper in the hydrophobic pocket than in HIV-1 MA or the myristoylation caused larger structural changes in the mutual positions of the helices.
Acknowledgements
We thank Prof. Michael Summers for the plasmid carrying the NMT gene. This research was supported financially by the Czech Science Foundation grant 203/07/0872, projects 1M6837805002, ME 904 and MSM 6046137305 from the Czech Ministry of Education, National Institutes of Health grant CA 27834 and by EU funds, project Operational Program Prague - Competitiveness (OP PC) CZ.2.16/3.100/22197.
Abbreviations used
- HSQC
Heteronuclear Single Quantum Coherence
- IPTG
isopropyl β-D-1-thiogalactopyranoside
- LB
Luria-Bertani medium
- MA
matrix protein
- myrMA
myristoylated matrix protein
- MAPPHis
matrix protein with 18 N-terminal amino acid residues from M-PMV phosphoprotein and 6 histidines attached to its C-terminus
- M-PMV
Mason-Pfizer Monkey Virus
- Ni–NTA
Nickel–nitrilotriacetic acid
- NMT
N-myristoyltransferase
- PE
Pellet
- PM
plasma membrane
- SU
Supernatant
- VLP
virus-like particle
Footnotes
Publisher's Disclaimer: This is a PDF file of an unedited manuscript that has been accepted for publication. As a service to our customers we are providing this early version of the manuscript. The manuscript will undergo copyediting, typesetting, and review of the resulting proof before it is published in its final citable form. Please note that during the production process errors may be discovered which could affect the content, and all legal disclaimers that apply to the journal pertain.
References
- 1.Rhee SS, Hunter E. Structural role of the matrix protein of type D retroviruses in gag polyprotein stability and capsid assembly. J.Virol. 1990;64:4383–4389. doi: 10.1128/jvi.64.9.4383-4389.1990. [DOI] [PMC free article] [PubMed] [Google Scholar]
- 2.Freed EO, Orenstein JM, Buckler-White AJ, Martin MA. Single amino acid changes in the human immunodeficiency virus type 1 matrix protein block virus particle production. J.Virol. 1994;68:5311–5320. doi: 10.1128/jvi.68.8.5311-5320.1994. [DOI] [PMC free article] [PubMed] [Google Scholar]
- 3.Hunter Eric. Macromolecular interactions in the assembly of HIV and other retroviruses. Seminars in Virology. 1994;5 [Google Scholar]
- 4.Resh MD. Fatty acylation of proteins: new insights into membrane targeting of myristoylated and palmitoylated proteins. Biochim.Biophys.Acta. 1999;1451:1–16. doi: 10.1016/s0167-4889(99)00075-0. [DOI] [PubMed] [Google Scholar]
- 5.Tang C, Loeliger E, Luncsford P, Kinde I, Beckett D, Summers MF. Entropic switch regulates myristate exposure in the HIV-1 matrix protein. Proc.Natl.Acad.Sci.U.S.A. 2004;101:517–522. doi: 10.1073/pnas.0305665101. [DOI] [PMC free article] [PubMed] [Google Scholar]
- 6.Saad JS, Ablan SD, Ghanam RH, Kim A, Andrews K, Nagashima K, Soheilian F, Freed EO, Summers MF. Structure of the myristylated human immunodeficiency virus type 2 matrix protein and the role of phosphatidylinositol-(4,5)-bisphosphate in membrane targeting. J. Mol. Biol. 2008;382:434–447. doi: 10.1016/j.jmb.2008.07.027. [DOI] [PMC free article] [PubMed] [Google Scholar]
- 7.Krausslich HG, Welker R. Intracellular transport of retroviral capsid components. Curr.Top.Microbiol.Immunol. 1996;214:25–63. doi: 10.1007/978-3-642-80145-7_2. [DOI] [PubMed] [Google Scholar]
- 8.Soneoka Y, Kingsman SM, Kingsman AJ. Mutagenesis analysis of the murine leukemia virus matrix protein: identification of regions important for membrane localization and intracellular transport. J.Virol. 1997;71:5549–5559. doi: 10.1128/jvi.71.7.5549-5559.1997. [DOI] [PMC free article] [PubMed] [Google Scholar]
- 9.Manrique ML, Gonzalez SA, Affranchino JL. Functional relationship between the matrix proteins of feline and simian immunodeficiency viruses. Virology. 2004;329:157–167. doi: 10.1016/j.virol.2004.07.029. [DOI] [PubMed] [Google Scholar]
- 10.Resh MD. A myristoyl switch regulates membrane binding of HIV-1 Gag. Proc.Natl.Acad.Sci.U.S.A. 2004;101:417–418. doi: 10.1073/pnas.0308043101. [DOI] [PMC free article] [PubMed] [Google Scholar]
- 11.Ames JB, Ishima R, Tanaka T, Gordon JI, Stryer L, Ikura M. Molecular mechanics of calcium-myristoyl switches. Nature. 1997;389:198–202. doi: 10.1038/38310. [DOI] [PubMed] [Google Scholar]
- 12.Goldberg J. Structural basis for activation of ARF GTPase: mechanisms of guanine nucleotide exchange and GTP-myristoyl switching. Cell. 1998;95:237–248. doi: 10.1016/s0092-8674(00)81754-7. [DOI] [PubMed] [Google Scholar]
- 13.Saad JS, Miller J, Tai J, Kim A, Ghanam RH, Summers MF. Structural basis for targeting HIV-1 Gag proteins to the plasma membrane for virus assembly. Proc.Natl.Acad.Sci.U.S.A. 2006;103:11364–11369. doi: 10.1073/pnas.0602818103. [DOI] [PMC free article] [PubMed] [Google Scholar]
- 14.Spearman P, Horton R, Ratner L, Kuli-Zade I. Membrane binding of human immunodeficiency virus type 1 matrix protein in vivo supports a conformational myristyl switch mechanism. J.Virol. 1997;71:6582–6592. doi: 10.1128/jvi.71.9.6582-6592.1997. [DOI] [PMC free article] [PubMed] [Google Scholar]
- 15.Vlach J, Srb P, Prchal J, Grocky M, Lang J, Ruml T, Hrabal R. Nonmyristoylated matrix protein from the Mason-Pfizer monkey virus forms oligomers. J. Mol. Biol. 2009;390:967–980. doi: 10.1016/j.jmb.2009.05.063. [DOI] [PubMed] [Google Scholar]
- 16.Sambrook J, Russell R. Molecular Cloning A Laboratory Manual. 2001. pp. 1.112–1.115. [Google Scholar]
- 17.Song C, Dubay SR, Hunter E. A tyrosine motif in the cytoplasmic domain of mason-pfizer monkey virus is essential for the incorporation of glycoprotein into virions. Journal of Virology. 2003;77:5192–5200. doi: 10.1128/JVI.77.9.5192-5200.2003. [DOI] [PMC free article] [PubMed] [Google Scholar]
- 18.Zabransky A, Andreansky M, Hruskova-Heidingsfeldova O, Havlicek V, Hunter E, Ruml T, Pichova I. Three active forms of aspartic proteinase from Mason-Pfizer monkey virus. Virology. 1998;245:250–256. doi: 10.1006/viro.1998.9173. [DOI] [PubMed] [Google Scholar]
- 19.Strohalm M, Kavan D, Novak P, Volny M, Havlicek V. mMass 3: a cross-platform software environment for precise analysis of mass spectrometric data. Anal.Chem. 2010;82:4648–4651. doi: 10.1021/ac100818g. [DOI] [PubMed] [Google Scholar]
- 20.Gasteiger E, Hoogland C, Gattiker A, Duvaud S, Wilkins MR, Appel RD, Bairoch A. Protein Identification and Analysis Tools on the ExPASy Server. 2005:571–607. doi: 10.1385/1-59259-584-7:531. [DOI] [PubMed] [Google Scholar]
- 21.Delaglio F, Grzesiek S, Vuister GW, Zhu G. NMRPipe: a multidimensional spectra processing system based on UNIX pipes. J.Biomol.NMR. 1995;6:277–293. doi: 10.1007/BF00197809. [DOI] [PubMed] [Google Scholar]
- 22.Goddard TD, Kneller DG. Sparky 3. San Francisco: University of California; 2006. [Google Scholar]
- 23.Vlach J, Lipov J, Veverka V, Rumlova M, Ruml T, Hrabal R. Letter to the editor: Assignment of H-1, C-13, and N-15 resonances of WT matrix protein and its R55F mutant from Mason-Pfizer monkey virus. J. Biomol. NMR. 2005;31:381–382. doi: 10.1007/s10858-005-2473-x. [DOI] [PubMed] [Google Scholar]
- 24.Geyer M, Munte CE, Schorr J, Kellner R, Kalbitzer HR. Structure of the anchor-domain of myristoylated and non-myristoylated HIV-1 Nef protein. J. Mol. Biol. 1999;289:123–138. doi: 10.1006/jmbi.1999.2740. [DOI] [PubMed] [Google Scholar]


