Abstract
Background:
With global realization that use of synthetic drugs is not safe on the long run, the medical fraternity at large is looking at alternatives from natural sources to combat diseases particularly those wherein conventional modern system of medicine has little to offer. On one hand, this realization has increased demand for herbal drugs and on the other hand need for quality standardization of these drugs has increased. Central Research Institute of Unani Medicine, Hyderabad, being engaged in multidisciplinary research in Unani Medicine, has taken up standardization of herbomineral drugs used in this system of medicine. One such drug “Qurs-e-Luk” that is widely used by the practitioners of this system in mobilizing and reducing body fat has been utilized for standardization by modern techniques, so as to ascertain its quality.
Methods:
The parameters which were carried out are pharmacognostic studies, physicochemical parameters, high-performance thin layer chromatography, microbial load, aflatoxins, heavy metals, and pesticidal residues revealing specific identities for the particular drug and to evaluate pharmacopoeial standards.
Results and Conclusion:
Results suggest that the drug is safe for therapeutic use and its batch to batch identification for quality control is possible on the basis of present study.
Keywords: Heavy metals, HPTLC studies, Microscopic properties, Physicochemical analysis, Qurs-e-Luk
INTRODUCTION
Recently, there has been a shift in the universal trend of medicine selection from synthetic to herbal medicine, which we can say “Return to Nature”. Medicinal plants have been known for millennia and are highly esteemed all over the world as a rich source of therapeutic agents for the prevention of diseases and ailments.[1] The global resurgence of interest in herbal medicines has led to an increase in their demand leading to a decline in their quality, primarily due to lack of adequate regulations pertaining to drugs.[2] WHO has emphasized the need to ensure quality control of medicinal plant products by using modern techniques and by applying suitable parameters and standards. In order to overcome certain inevitable shortcomings of the pharmacopoeial monograph other quality control measures must be explored.[3–6]
A herbal formulation, Qurs-e-Luk, used in the present study is a Unani compound formulation mentioned in the National formulary of Unani medicine of India, Part-II, Vol-I. The drug is widely used in Unani system of medicine for mobilizing and reducing body fat, which is Istisqa-e-Lehmi in terms of Unani Medicine. It is also very effective tonic for liver and is diuretic.[7]
In order to standardize and to lay down the standard operating procedures (SOPs) and pharmacopoeial standards, the formulation was prepared in three batches at laboratory scale. It was subjected to analysis for microscopic studies, physicochemical parameters, microbial load, heavy metals, aflatoxins, pesticide residues, and high-performance thin layer chromatographic studies.[8] The present paper describes the salient features of preparation, safety evaluation studies, and thin-layer chromatographic studies for the drug.
MATERIALS AND METHODS
Collection of material
Ingredients of formulation were procured from the pharmacy of Central Research Institute of Unani Medicine, Hyderabad, identified with the help of a botanist, and used after drying under shade.
Preparation of the formulation (Mohammad Azam Khan, 1315 AD)
It is prepared according to the composition of the formulation given in the National formulary of Unani Medicine, Part II, Vol I.
Processing of raw material
The ingredients of the formulation, after identification and ascertaining the quality, were cleaned by the removal of foreign matter, if present, and by washing two to three times with sterile distilled water, if needed. The air dried ingredient except Mastagi, were powdered separately by pulverizer (GMP model), sieved through a mesh with a pore size of 150 μ. (Mesh No. 100, British standard sieve (BSS)). Mastagi was powdered separately and gently in a metallic kharal (mortar). Required quantities of the powders were mixed thoroughly and moistened with sterile distilled water. Samagh-e- Arabi (Acacia Arabica) equivalent to 10% of the total weight of the powders of the ingredients was added to the powdered drugs to get a semisolid paste and subjected to granulation, using mechanical granulator with sieve no. 100. The granules thus formed were dried at low temperature (less than 60°C to 70°C) using a hot air drier (GMP model).
Preparation of the Tablets
The tablets were prepared as per the procedure described by Mohammad Azam Khan,1315 AD.[9] The granules were formulated into 500 mg tablets (excluding binding material weight) using rotary tablet punching machine (Cadmach-GMP model). In this manner, three batches were prepared and compared with each other.
Chemical analysis
Physicochemical parameters of the prepared compound formulationQurs-e-Lukwere studied, such as total ash, acid insoluble ash, water soluble ash, solubility matter in alcohol and water, loss on drying at 105°C, microbial load, aflatoxins, and pesticide residues; GBC-908 AA model Atomic Absorption Spectrophotometer (AAS) was used to determine the concentration of heavy metals as per the methods described in WHO guidelines.[10]
HPTLC analysis
DESAGA Sarstedt Gruppe system is used for analysis along with Automatic TLC applicator and UV visible cabinet as imaging system, the instrument had Proquant 1.6 version as software system for documentation.
Preparation of extract of the drug for HPTLC analysis
Five grams powder of Qurs-e-Luk was dissolved in 100 ml of methanol in a stoppered conical flask and was kept for 2 hours with shaking at regular intervals. Later the contents were filtered through Whattmann No. 41 filter paper and the solution was evaporated to 20 ml. Thus, the solution so obtained was used as sample for the determination of components.
Development and determination of the solvent system
Sample Applied : Sample drug solution of about 10 μl.
Solvent system : Toluene: Ethyl acetate: Methanol (7:2:1)
Migration distance : 93 mm
Scanning wavelength : UV 366 nm, UV 254 nm and visible range.
The sample was spotted with the help of Automatic TLC applicator system of the DESAGA Sarstedt Gruppe on Precoated Aluminium Sheets of Silica Gel 60 F254 (Merck) After trying with various solvent systems with variable volume ratios, the suitable solvent system as stated above is selected in its proportionate ratio and developed in the Twin through chamber of TLC to the maximum height of the plate so that it can separate the components on the polar phase of silica gel and that of mobile phase of solvent system. Three batches of formulation were spotted separately and developed the TLC plate as shown in Figure 1.
Figure 1.
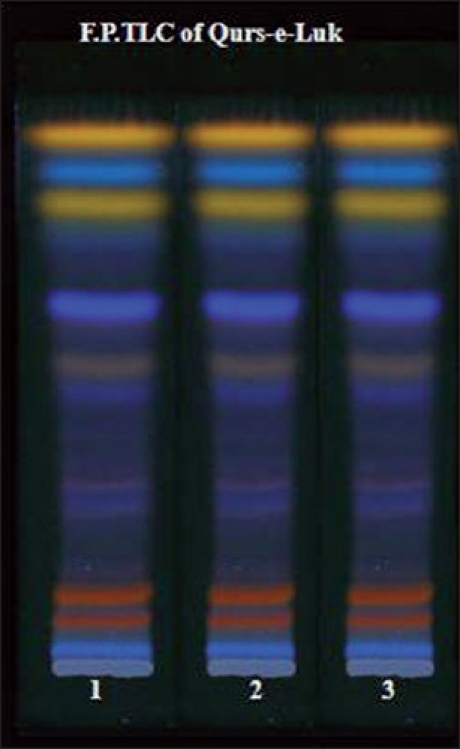
TLC chromatogram of the methanolic extract of three batches of Qurs-e-Luk at UV 366nm observed in UV chamber showing better separation of components (spots).
Development of HPTLC technique
After developing, TLC plates were dried completely and detected with the suitable detection system like UV Cabinet system for detection of spots at 366 nm, 254 nm, and under visible range as shown in the Figure 2. Further, it was scanned with the Densitometer CD60 of DESAGA Sarstedt Gruppe system under the UV range of 366 nm, 254 nm, and visible region. The densitogram obtained, as shown in the Fihures 3–5, showed peaks appearing for the corresponding spots being detected in the densitometer while scanning and the peaks areas under the curve correspond to the concentration of the component in the sample. The separation of the components in the three batches of compound formulation was carried and scanned at UV 366 nm, and were detected to be similar.
Figure 2.
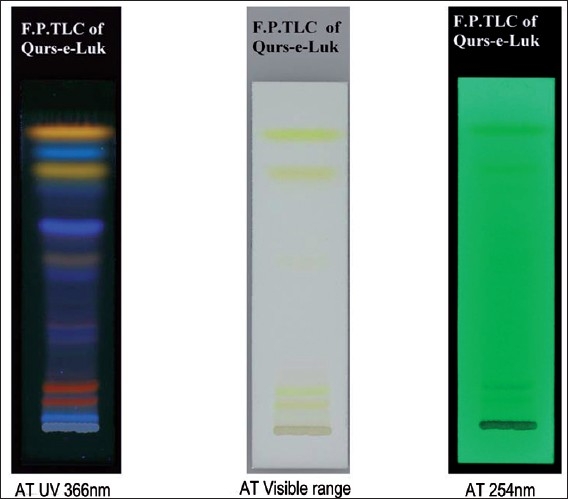
TLC chromatograms of methanolic extract of Qurs-e-Luk at different wavelength.
Figure 3.
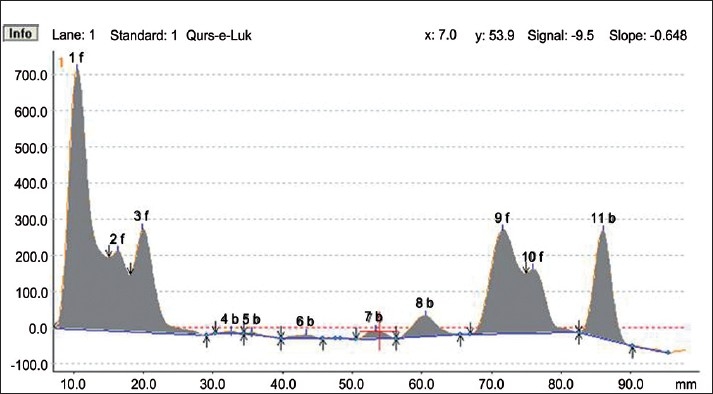
HPTLC Densitogram of the methanolic extract of Qurs-e-Luk at 366nm.
Figure 5.
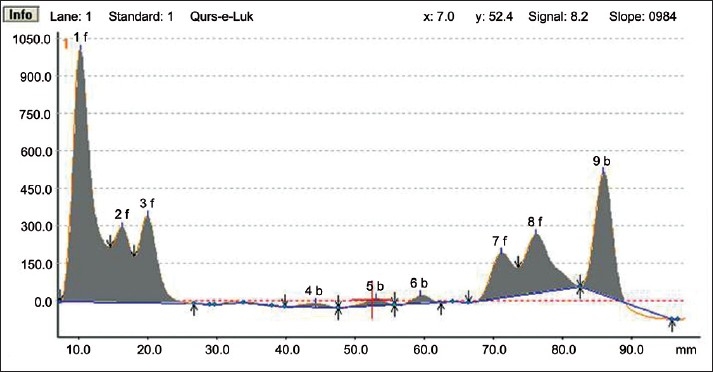
HPTLC Densitogram of the methanolic extract of Qurs-e-Luk at 254nm
RESULTS AND DISCUSSION
Analytical Profile
Organoleptic Characteristics
A greenish Unani tablet with no specific taste and odour.
Identification
Microscopy
The preparation under high power of microscope shows slightly curved unicellar trichomes, vessel elements with spiral and scalariform thickenings (Anisoon), cells with tannin and oil globules, vessels with oblique end walls and a simple perforation plates (Asaroon) iso-diametric or slightly elongated and beaker-shaped stone cells (Filfil Siyah), characteristic graminaceous stomata, silica bodies, and micro hairs; also contains pitted parenchyma and fiber (Izkhar) thick walled rectangular cells containing brownish pigment, cuboid stone cell containing prismatic calcium oxalate crystals and tannin (Nankhwah), brown or orange-red fragments of resins and oils associated with thin- walled parenchymatous cells, broken bits of xylem vessels with scalariform, reticulate thickening and horizontal end walls (Qust), vessels with spiral and annular thickenings, rosettes of prismatic calcium oxalate crystals and tracheids (Rewand Chini), cork cells filled with oil globules (Sumbuluttib), elongated rectangular sclereids with sinuate walls and sphaeroraphides of calcium oxalate (Tukm-e-Karafs) and isodiametric idioblasts containing a yellowish to reddish-brown oleo-resin (Zanjabeel)
Physicochemical Standards
The physicochemical Parameters data shown in Table 1 is expressed as mean values of the three readings calculated. Total ash was found to be 6.85 gm%, water soluble ash 2.39 gm%, and acid insoluble ash 2.10 gm%; whereas alcohol soluble matter in terms of %w/w is found to be 23.47 and water soluble matter as 29.67; the moisture content, i.e., loss of weight on drying at 105°C was found to be 7.53 gm%. ThepH of the 1% aqueous solution observed as 4.60–4.86 and 10% aqueous solution observed as 5.20–5.58; and disintegration time of tablet was 10.27 min. The results of total bacterial load and total fungal count of the microbial studies were within the permissible limits and other parameters were found to be absent in the drug. Analysis of aflatoxins, heavy metal analysis and pesticide residue studies showed that the drug was free from these contaminations. These findings as observed for microbial load, aflatoxin contamination, heavy metal analysis, and pesticidal residues are shown in the Tables 2–5 respectively.
Table 1.
Physico-chemical parameters of the compound formulation ‘Qurs-e-Luk’

Table 2.
Microbial Contamination

Table 5.
Pesticide residue

Table 3.
Aflatoxin Contamination

Table 4.
Heavy Metal Analysis

HPTLC analysis
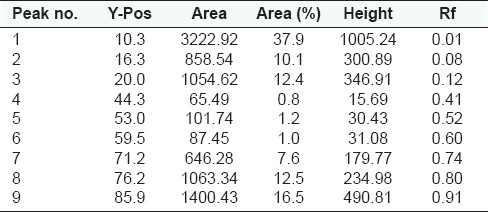
HPTLC fingerprint studies of methanolic extract of Qurs-e-Luk for the three batches was carried out and chromatogram with three batches was developed and detected using the UV visible chamber, which clearly showed eleven spots at UV 366 nm in the densitogram as depicted in the Figure 3. The corresponding Rf values of the eleven components are at 0.01, 0.08, 0.12, 0.27, 0.31, 0.40, 0.52, 0.61, 0.74, 0.79, and 0.91 which are further correspondingly positioned at 10.5, 16.3, 19.9, 32.6, 35.5, 43.4, 53.4, 60.5, 71.6, 75.9, and 86.0 mm. These areas correspond to each peak which determines the concentration of the component in the sample on the TLC Plate as shown in the Table 6. The Rf values of three batches of the formulation were found to be same, whereas at visible region revealed nine spots (Components) in the densitogram as shown in the figure 4, the Rf values are at 0.01, 0.08, 0.12, 0.27, 0.41, 0.52, 0.60, 0.79 and 0.91 which are correspondingly positioned at 10.3, 16.4, 20.0, 32.5, 44.1, 53.2, 60.0, 76.2, and 86.0 mm; and at UV 254nm nine spots are also revealed in the densitogram as show in the Figure 5, the Rf values are at 0.01, 0.08, 0.12, 0.41, 0.52, 0.60, 0.74, 0.80 and 0.91 which are correspondingly positioned at 10.3, 16.3, 20.0, 44.3, 53.0, 59.5, 71.2,76.2 and 85.9 mm the areas correspond to each peak which determine the concentration of the component in the sample on the TLC Plate as shown in the Tables 7 and 8.
Table 6.
Peak list of densitogram of the methanolic extract of Qurs-e-Luk at UV 366nm
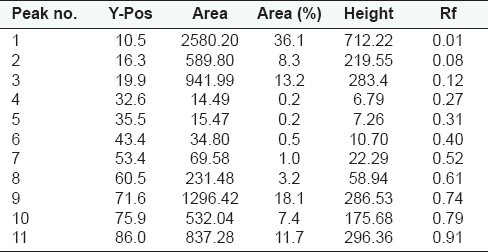
Figure 4.
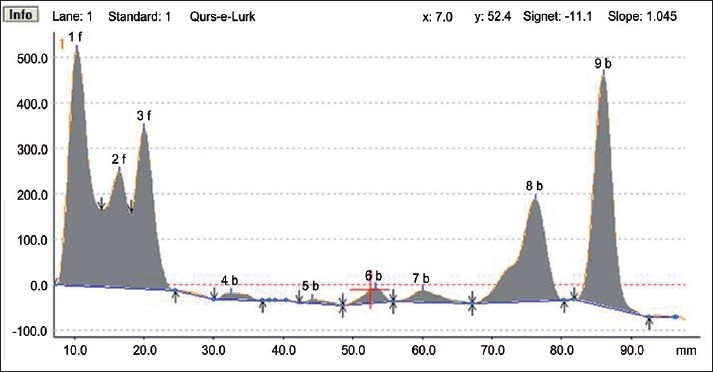
HPTLC Densitogram of the methanolic extract of Qurs-e-Luk at visible range.
Table 7.
Peak list of densitogram of the methanolic extract of Qurs-e-Luk at visible range
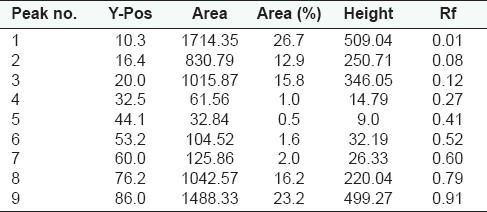
Table 8.
Peak list of densitogram of the methanolic extract of Qurs-e-Luk at UV 254nm
CONCLUSION
The drug under study was subjected to physicochemical analysis, which is helpful in establishing the standard along with the other parameters such as microscopic study. Heavy metal analysis, aflatoxins contamination, pesticide residue analysis was done and found absent as reported in the present investigation besides the presence of microbial load was found within the permissible limits of WHO guidelines. Modern technique of HPTLC analysis was employed in respect to standardization and to separate the compounds which can be isolated for further studies. Consequently, the drug was used to determine and ascertain its quality standard. The study is likely to help in the quality assurance of drug used in the Unani System of Medicine and in development of standard parameters.
Acknowledgments
The authors like to put on record their sincere gratitude to Dr. Mohammad Khalid Siddiqui, Director General, CCRUM, New Delhi for his consistent encouragement and providing financial support. The authors are deeply indepted to Late Dr. Shaik Imam, Research Officer (Botany), CRIUM, Hyderabad who has been primarily instrumental in creating facilities for these studies in the laboratory.
Footnotes
Source of Support: Nil.
Conflict of Interest: None declared.
REFERENCES
- 1.Sharma A, Shanker C, Tyagi L, Singh M, Rao Ch V. Herbal Medicine for Market Potential in India: An Overview. Acad J Plant Sci. 2008;1:26–36. [Google Scholar]
- 2.Rajini M, Kanaki NS. Phytochemical standardization of herbal drugs and polyherbal formulations. In: Ramawat KG, Merillon JM, editors. Bioactive molecules and medicinal plants. Springer: Berlin Heidelberg; 2008. pp. 349–69. [Google Scholar]
- 3.Pifferi G, Santoro P, Pedrani M. Quality and functionality of excipients. Farmaco. 1999;54:1–14. doi: 10.1016/s0014-827x(98)00101-3. [DOI] [PubMed] [Google Scholar]
- 4.Shinde VM, Dhalwal K, Potdar M, Mahadik KR. Application of Quality Control Principles to Herbal Drugs. Int J Phytomed. 2009;1:4–8. [Google Scholar]
- 5.Singh S, Soni GR. WHO Expert committee on biological Standardization. Indian J Med Res. 2004;120:497–8. [Google Scholar]
- 6.Street RA, Stirk WA, Van Staden J. South African traditional medicinal plant trade-Challenges in regulating quality, safety and efficacy. J Ethnopharmacol. 2008;119:705–10. doi: 10.1016/j.jep.2008.06.019. [DOI] [PubMed] [Google Scholar]
- 7.The Unani Pharmacopoeia of India, Published by the Department of AYUSH, Ministry of Health and Family Welfare, Govt. of India. 2007
- 8.New Delhi: 2009. The Unani Pharmacopoeia of India, Part-I, Vol.VI, Ministry of Health and Family welfare, Govt. of India; pp. 119–35. [Google Scholar]
- 9.Khan Mohammad Azam. 1315 AD. Qarabadeen-a-Azam-o-Akmal, Siddiqui Press, Delhi. Qarabadeen-e-Azam-o-Akmal; 121 [Google Scholar]
- 10.Geneva: World Health Organization; 1998. Quality Control Methods for Medicinal Plant Materials; pp. 25–28. [Google Scholar]


