

Abstract
AIM
This study was designed to characterize the population pharmacokinetics of isoniazid in South African pulmonary tuberculosis patients.
METHODS
Concentration–time measurements obtained from 235 patients receiving oral doses of isoniazid as part of routine tuberculosis chemotherapy in two clinical studies were pooled and subjected to nonlinear mixed-effects analysis.
RESULTS
A two-compartmental model, including first-order absorption and elimination with allometric scaling, was found to describe the observed dose-exposure relationship for oral isoniazid adequately. A mixture model was used to characterize dual rates of isoniazid elimination. Estimates of apparent clearance in slow and fast eliminators were 9.70 and 21.6 l h−1, respectively. The proportion of fast eliminators in the population was estimated to be 13.2%. Central volume of distribution was estimated to be 10% smaller in female patients and clearance was found to be 17% lower in patients with HIV. Variability in absorption rate (90%) was completely interoccasional in nature, whereas in relative bioavailability, interoccasional variability (8.4%) was lower than interindividual variability (26%). Oral doses, given once daily according to dosing policies at the time, were sufficient to reach therapeutic concentrations in the majority of the studied population, regardless of eliminator phenotype. Simulations suggested that current treatment guidelines (5 mg kg−1) may be suboptimal in fast eliminators with low body weight.
CONCLUSIONS
A population pharmacokinetic model was developed to characterize the highly variable pharmacokinetics of isoniazid in a South African pulmonary tuberculosis patient population. Current treatment guidelines may lead to underexposure in rapid isoniazid eliminators.
Keywords: computer simulation, isoniazid, models, NONMEM, pharmacokinetics, tuberculosis
WHAT IS ALREADY KNOWN ABOUT THIS SUBJECT
The pharmacokinetic properties of isoniazid are well characterized, having been studied in seminal work beginning in the early 1950s. Pharmacokinetic models have been published in other populations.
WHAT THIS PAPER ADDS
This work provides a population model for isoniazid pharmacokinetics in a South African population from a tuberculosis-endemic region, of potential use in investigating the complex exposure-response relationships found in the first line treatment of pulmonary tuberculosis. Previous work has been performed in smaller groups of healthy volunteers or predominantly Caucasian or Asian patients, but the pharmacokinetics of isoniazid in the population in this study are significantly different from those previously reported in other populations. The developed model will provide a basis for estimation of optimal doses in children.
Introduction
Mycobacterium tuberculosis infects approximately one-third of the world's population. The global burden of disease is greatest in Southeast Asia and in Africa, which account for 35% and 30%, respectively, of about 9.4 million incident cases globally [1]. Globally, 11–13% of incident cases are associated with human immunodeficiency virus (HIV) co-infection and 80% of co-infected patients are in Africa, where up to 60% of tuberculosis patients are infected with HIV. Tuberculosis incidence rates are rising steadily in countries with high burdens of tuberculosis and HIV, like South Africa [2]. It is therefore crucial to ensure optimal antimycobacterial treatment in order to reduce transmission and slow the development of resistance.
Isoniazid (INH) has been an essential component of first line antituberculosis treatment for more than half a century. It has excellent early bactericidal activity (EBA). The drug eliminates rapidly-metabolizing bacilli found in the sputum of microscopy smear-positive pulmonary tuberculosis patients during the first 48 h of treatment [3–5] and is also effective in preventing resistance in its companion drugs, rifampicin, pyrazinamide and ethambutol [6]. Isoniazid inhibits the synthesis of long-chain mycolic acids, indispensable components of mycobacterial cell walls [7, 8].
Efforts to combat tuberculosis and prevent the spread of drug resistance have hinged on the adoption of the directly-observed treatment (short-course) (DOTS) strategy developed by the World Health Organization (WHO) [9]. Results since implementation have, however, been mixed [10–12]. One possible reason for this may be inadequate treatment. Low concentrations of pyrazinamide have been associated with poor outcomes in tuberculosis patients in Botswana [13]. Dosing of isoniazid is traditionally performed by body weight to approximate the WHO recommended dose of 5 mg kg−1[14]. Treatment with isoniazid is further complicated by polymorphism in the expression of the enzyme system primarily responsible for its elimination, N-acetyltransferase-2 (NAT2), resulting in trimodal elimination (slow, intermediate and fast) [15]. Finally, isoniazid is associated with hepatotoxicity and peripheral neuropathy, and slow acetylators may be at increased risk of toxicity [16, 17].
It is therefore important to ensure that exposure to first-line chemotherapeutic agents, including isoniazid, is appropriate in tuberculosis patients in a clinical setting. The population pharmacokinetics of rifampicin and pyrazinamide, also key first-line agents, have been studied in the same population of South African patients [18, 19]. The objective of this analysis is to characterize the population pharmacokinetics of isoniazid in the same population, and to provide a population pharmacokinetic model suitable for predicting isoniazid exposure based on dose and other demographic covariates suitable for scaling.
Methods
Patients
Data from 235 pulmonary tuberculosis patients participating in two clinical studies were pooled to generate the dataset of 2352 concentration–time observations used in the analysis (Table 1). Hospitalized patients were recruited from two treatment centres, the DP Marais SANTA (South African National Tuberculosis Association) Centre, near Cape Town and Brewelskloof Hospital, in the Breede River Valley in South Africa's Western Cape province. The study participants were males and non-pregnant females over the age of 18 years. Treatment was administered in accordance with the WHO's DOTS tuberculosis control strategy [9]. Isoniazid was always administered in combination with rifampicin, and with pyrazinamide, ethambutol and streptomycin as appropriate with respect to the WHO's tuberculosis treatment recommendations and national guidelines at the time. All subjects were fasted from 22.00 h on the evenings prior to blood sampling and provided full written informed consent for participation in the studies. Ethical approval for the studies was granted by the research ethics committees of the University of Cape Town, South Africa and the participating study centres.
Table 1.
Patient demographics, covariates and study designs of the clinical studies contributing data to the isoniazid pharmacokinetic model. Continuous variables are given as median (95% range)
| DPM | BKH | Combined | |
|---|---|---|---|
| Subjects | 91 | 144 | 235 |
| Age (years) | 37 (23–60) | 36 (20–60) | 36 (20–60) |
| Gender (female/male) | 24/67 | 78/66 | 102/133 |
| Race (Coloured / Black / Caucasian) | 64/25/2 | 128/16/0 | 192/41/2 |
| Weight (kg) | 52.5 (37.5–66.9) | 46.1 (31.2–68.0) | 48.0 (33.7–68.0) |
| Dose (mg kg−1) | 5.11 (3.98–6.90) | 6.51 (4.41–9.59) | 5.88 (4.28–8.92) |
| BMI (kg m–2) | 19.6 (15.6–24.5) | 17.8 (13.1–23.7) | 18.5 (13.3–24.4) |
| HIV infection* | 21 (24.1% of 87) | 14 (9.79% of 143) | 35 (15.2% of 230) |
| Formulation (fixed-dose combination / single drug) | 89/2 | 34/110 | 123/112 |
| Study length (weeks) | 2 | 1 | |
| Samples/subject | 12 | 9 | 2352† |
| 3 per day, twice per week | during a single day | ||
| Sampling schedule | Pre-dose and random between 0–12 h post-dose | Pre-dose and at 0.5, 1, 1.5, 2, 2.5, 3, 4, 6, 8 h post-dose | |
| Dosing (mg day−1, p.o.) | 100 (n = 1); 225 (n = 8); 240 (n = 29); 300 | 200 (n = 1); 300 (n = 142); 450 (n = 1) – 7 days per week | |
| (n = 53); 400 (n = 2) – 5 days per week |
n = 230 subjects; five patients declined to be tested.
Total number of samples.
A total of 91 pulmonary tuberculosis patients treated with isoniazid were included from the first study, which we shall refer to as DPM. Oral doses ranged between 100 and 400 mg day−1, Monday to Friday, for a minimum of 2 weeks prior to pharmacokinetic assessment (Be-, Be-Tabs, Roodepoort, South Africa; Rifafour e-200, Hoechst Marion Roussel, Midrand, South Africa; Rifinah-150 and Rifinah-300, Aventis Pharma, Midrand, South Africa). Details are provided in Table 1. Two patients had their isoniazid doses adjusted during the course of the study, for reasons unrelated to this investigation. Sets of three blood samples for the determination of isoniazid pharmacokinetics were taken twice weekly, at random times between 0 and 12 h post-dose, for 2 weeks. The second study (which we shall refer to as BKH) included 144 pulmonary tuberculosis patients, sampled (pre-dose and at 0.5, 1.0, 1.5, 2.0, 2.5, 3.0, 4.0, 6.0 and 8.0 h post-dose) on a single occasion at the end of the 2 month intensive phase of treatment (including isoniazid). Patients were dosed according to the attending physicians' best clinical judgment, in line with treatment policy at the site. Oral doses of between 200 and 450 mg day−1 were administered (Be- 100; Be- 100, Lennon Isoniazid 100, Lennon Isoniazid 200, and Norstan Isoniazid 200, Lennon Medicines, Gallo Manor, South Africa; Rifinah-150; Rifinah-300; see Table 1). In contrast to the 5 day dosing cycle used in the DPM study, BKH patients were administered isoniazid 7 days per week. In addition to isoniazid, patients received their other prescribed medications as usual.
Covariate information recorded for each patient included age, weight, body mass index (BMI) and gender (Table 1). Patient use of alcohol, tobacco and drugs of abuse was determined by questionnaire. Details of concomitant medication were recorded (none had previously been reported to interact with isoniazid), and full medical histories were taken from every subject. Antituberculosis treatment ingestion on study days was monitored by direct observation.
A noncompartmental analysis of isoniazid concentrations from the BKH study has been reported previously [20].
Specimen collection and storage
Venous blood samples for determination of isoniazid pharmacokinetics were collected into lithium heparin vacuum tubes (Vacuette®, Greiner Bio-One International AG, Kremsmuenster, Austria) through an intravenous cannula (Introcan® 1.1 × 32 mm, B. Braun AG, Melsungen, Germany) inserted into an arm vein. The samples were stored for up to 20 min in darkness on ice, before separation of plasma which was subsequently stored at −80°C until analysis.
Patients were requested to undergo voluntary testing for the presence of HIV (10 subjects declined) using an automated ELISA method (AxSYM HIV Ag/Ab Combo, Abbott Diagnostics, Germany). Counselling was provided pre- and post-test, for all subjects. Confirmatory testing was carried out in subjects whose initial screening result was positive using the Enzygnost Anti-HIV 1/2 Plus (Dade Behring, Liederbach, Germany), a second ELISA test.
Analytical methods
Plasma concentrations of isoniazid were determined by high-performance liquid chromatography (HPLC) using UV detection [21]. The HPLC system consisted of a Spherisorb C8 analytical column of dimensions 25 cm × 4.6 mm and particle diameter 5 µm (PSS831815, Waters Corporation, Milford, Massachusetts, USA) in conjunction with a reverse-phase guard column (2.5 cm × 0.46 cm, packed with Pelliguard LC-8, Upchurch Scientific, Oak Harbor, Washington, USA). The mobile phase consisted of acetonitrile (BDH, Poole, United Kingdom) and 0.06% trifluoroacetic acid (Riedel-de Haën, Seelze, Germany) in the ratio 5:95. The UV detection wavelength was 270 nm and the flow rate was 1.5 ml min−1.
Frozen plasma samples were allowed to thaw in a water bath at ambient temperature. The C18 extraction column (Bond Elut 3.0 cm, Varian, Palo Alto, California, USA) was primed with 1 ml 0.5 mm potassium phosphate buffer (pH 4.5) and 0.5 ml of plasma was applied to the column. The sample was drawn onto the column and allowed to stand for 10 min. The column was washed with 1 ml of the phosphate buffer. Finally, isoniazid was eluted into an analytical vial using 0.5 ml acetonitrile and 0.5 ml methanol. All solvents were of HPLC grade. The extracted sample (20 µl) was injected directly onto the column at ambient temperature and the retention time was approximately 2.8 min. The limit of detection was 0.04 mg l−1 and the limit of quantitation was 0.2 mg l−1.
The standard curve was linear and provided a detection range of 0.2–20 mg l−1. Quality control samples of 0.5 mg l−1, 8 mg l−1 and 16 mg l−1 were interspersed between the samples. Percentage coefficients of variation (CV) were 4.2%, 9.4% and 11.3% for the low, medium and high quality control samples, respectively. Mean (±SD) recovery was assessed by measuring the isoniazid concentration obtained from spiked plasma samples corresponding to points on the standard curve, and was determined to be 72.9% ± 4.35%.
Pharmacokinetic data analysis
A total of 52 concentration–time observations (1.6% of the total) were below the lower limit of quantification. Since the actual concentrations were available, and since they made up a negligibly small proportion of the dataset, they were retained unaltered in the dataset. Model-building was conducted using NONMEM (version 7 Level 1.0). Graphical diagnostics were managed using the software utility Xpose 4.0 [22]. NONMEM's first-order conditional estimation (FOCE) method with ε-η interaction was used for model development.
Observed isoniazid concentrations vs. time after dose, conditional on study site, are shown in Figure 1. The data were log-transformed and fitted using one- and two-compartment models with first-order absorption and elimination. Several approaches to modelling absorption were tested, including the use of an absorption lag time, the transit compartment model [18, 23], combined first- and zero-order absorption models, the use of a zero-order input into the absorption compartment to mimic the release of drug from solid-phase formulation, and a model for saturable first-pass elimination. Elimination was assumed to take place from the central plasma compartment in all models tested. The known trimodality of isoniazid elimination was investigated through the use of a mixture model for apparent clearance. The influence of covariances between model variance parameters was tested through the estimation of off-diagonal elements in the variance-covariance matrix. A priori scaling of clearance and volume parameters was tested according to the approach suggested by Anderson & Holford [24], using a reference weight of 70 kg. Typical values of clearance terms were scaled as in the example in Equation (1), and typical volume of distribution terms were scaled as in the example in Equation (2).
Figure 1.
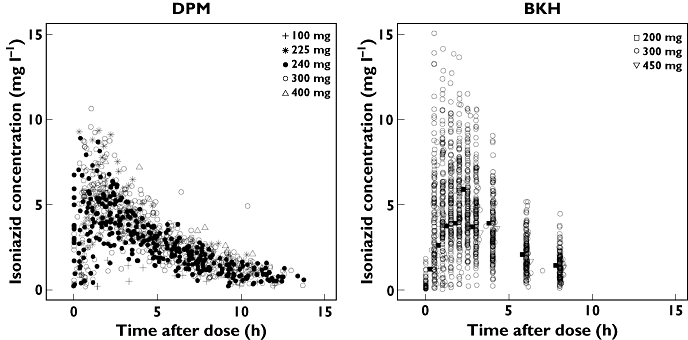
Observed isoniazid concentrations plotted against time after dose, obtained from patients at DP Marais SANTA Centre (DPM) and Brewelskloof Hospital (BKH). Dosing was 5 days per week, Monday to Friday, at DPM, and daily at BKH, owing to policy differences between the sites. Time points for 200 mg and 450 mg doses in the BKH plot have been jittered by 0.25 h to facilitate visibility
| (1) |
| (2) |
(CL/F)i is scaled oral clearance for individual i, CL is the typical value of the clearance term for a 70 kg individual, and WTi is the body weight of individual i in kg. Similarly (Vc/F)i and Vc are scaled volume in individual i, and typical value of the volume term for a 70 kg individual, respectively.
Interindividual variability (IIV) parameters were defined as being normally distributed with mean 0 and variance ω2. Similarly, interoccasional variability (IOV) parameters were normally distributed with mean 0 and variance π2. An occasion was defined as a dosing interval in which blood sampling was conducted. The number of occasions per patient ranged between 1 (all patients in the BKH group) and 4. Residual variability, arising from unspecified within-subject variability, model misspecification and experimental error, was normally distributed with mean 0 and variance σ2; it was applied as an additive model on the log scale.
Model selection was informed by use of the objective function (OFV), a goodness-of-fit criterion equivalent to minus twice the log-likelihood of the data given the model, as well as by evaluation of parameter estimates (including precision), graphical goodness-of-fit, visual predictive checks (VPCs) and prediction-corrected visual predictive checks (PC-VPCs). The differences in OFV between a full and a reduced model are approximately chi-square distributed. Differences of ≥3.84 in the OFV were regarded as significant, corresponding to a confidence level of P < 0.05 assuming 1 degree of freedom (the norm when comparing nested models), respectively. For VPCs, the final model was used to simulate 600 new datasets based upon the design of the original dataset. First, the observed and simulated datasets were each divided into bins of approximately equal numbers of observations by ranges of time after dose, stratified by dose. For each separate bin in the observed data, the 2.5%, 50% and 97.5% percentiles were calculated. This process was repeated for each bin in each of the simulated datasets to yield a distribution for each of these percentiles, from which a 95% confidence interval was calculated. The 95% prediction intervals (the 2.5%, 50% and 97.5% quantiles) and associated 95% confidence intervals derived from the simulations were then plotted against the 2.5%, 50% and 97.5% quantiles of the binned observations to yield the final VPC. Additionally, a PC-VPC was used, in which observations and simulated predictions in each bin were first normalized by the typical model prediction in the bin in order to generate prediction-corrected observations and predictions, which were used in all subsequent steps of the VPC. Stratification is unnecessary in PC-VPCs [25].
Potential covariate relationships were tested for inclusion in the model using a stepwise covariate modelling (SCM) procedure. First, potential covariate relationships were tested one at a time, and included only if an OFV change of ≥3.84 (P < 0.05) was observed. At each forward step, the relationship with the highest change in OFV above the cut-off was included at each step, and the remaining relationships were tested again. This process was repeated until no further relationships could be included at the specified significance level. During the backwards elimination process, the relationships selected during the forward process were univariately removed using an OFV change of ≥10.83 (P < 0.001) as a prerequisite for retention, until only those above the backward cut-off were retained. The pool of covariates tested included body weight, age, gender, race and HIV status. Continuous covariates were allowed to enter the model as linear and power relationships.
A nonparametric bootstrap of 1000 iterations, stratified by site, was performed to provide estimates of the standard errors and the 95% confidence intervals of the estimated model parameters.
Influential individuals in the data were identified through the use of a case-deletion diagnostic procedure. Each of the 235 included patients was removed from the original dataset in turn to create 235 new datasets, each composed of 234 individuals, and each omitting a different individual included in the original data. The final model was used to fit each of these new datasets. In order to evaluate the impact of the deletion of each of the subjects in the data, Cook scores and covariance ratios (where available, since these were dependent on a successful covariance step) were calculated for each of the 235 model fits, and the results compared. Changes in the parameter estimates caused by removal of each individual were also examined.
The final pharmacokinetic model was used to simulate concentration–time curves over 7 days of continuous daily dosing in pulmonary tuberculosis patients according to the covariates in the final model, based on current WHO guidelines for isoniazid dosing, which recommend 5 mg kg−1 body weight [14]. Four bands were used for assigning doses by weight: 150 mg for weights of 30–37 kg (4.1–5 mg kg−1), 225 mg for weights of 38–54 kg (4.2–5.9 mg kg−1), 300 mg for weights of 55–70 kg (4.3–5.5 mg kg−1) and 375 mg for weights of >70 kg (<4.9 mg kg−1). Covariates were bootstrapped from those in the original dataset.
Equal groups of simulated patients for each of the weight bands were generated, using the weight range in the study population (28.5–85.5 kg). Eight subgroups reflected all possible permutations of fast and slow eliminators, HIV status and gender for a total of 38 400 simulated patients. With the four different weight bands for dosing, the total number of simulated dose groups was 32, containing 1200 simulated patients per subgroup. Area under the concentration–time curve to infinity (AUC(0,∞)), peak concentration (Cmax) and concentration at 2 h post-dose (C2h) were derived for each simulated individual. The distributions were compared with previously-published cut-offs (related to 90% of maximal EBA) for AUC(0,∞) (10.52 mg l−1 h) and C2h (2.19 mg l−1) [26] and to the lower limit of the ‘normal range’ (3 mg l−1) for isoniazid [27].
Results
The best model describing isoniazid pharmacokinetics in the studied population was found to be two-compartmental, with first-order absorption and an absorption lag time, and first-order elimination. All clearance and volume terms were allometrically scaled by body weight. A mixture model applied on apparent clearance was used to characterize the effect of metabolic polymorphism on isoniazid elimination, but could only be parameterized in terms of two subpopulations rather than three, owing to insufficient information to differentiate between estimates of apparent clearance in intermediate acetylators and in fast acetylators. The mixture model produced a difference in clearance of approximately two-fold between slow and rapid eliminator populations.
Interindividual variability (IIV) was incorporated into the model on apparent clearance (18.4%, a single term for fast and slow eliminators, CLfast/F and CLslow/F, respectively), central volume of distribution (Vc/F, 16.5%), intercompartmental clearance (Q/F, 93.1%), relative bioavailability (F, 26.2%), and lag time (tlag, 88.4%). Interoccasion variability was incorporated into the model on absorption rate constant (ka, 90.1%) and relative bioavailability (F, 8.4%). Residual variability was additive on the natural logarithmic scale.
A priori allometric scaling of clearance and volume terms by weight was included [24]. Two additional covariate relationships were found to be significant at the P < 0.001 level during covariate model building. Typical Vc/F was estimated to be 10.3% lower in female patients than male patients, and typical oral clearance (both CLfast/F and CLslow/F) was estimated to be 17.4% lower in patients infected with HIV.
Model parameter estimates are presented in Table 2. Figure 2 provides an overview of model fits to individual subject data, divided into categories of best, typical and worst, selected by evaluation of mean absolute individual weighted residual for each patient. A PC-VPC of the final model appears in Figure 3, along with VPCs stratified by doses of 240 mg and 300 mg, and indicated that the model's ability to reproduce the central tendency of the observed data was adequate. A tendency towards overpredicting variability was, however, observed after approximately 4.5 h post-dose, although this trend was greatly reduced in the VPCs stratified by dose. The case-deletion diagnostic procedure did not identify any patients exerting disproportionate influence on any of the model parameter estimates.
Table 2.
Parameter values estimated by the final pharmacokinetic model
| Parameter | Population mean | %RSE* | 95% confidence interval* |
|---|---|---|---|
| Typical apparent clearance, fast eliminators (CLfast/F, l h−1) | 21.6 | 36.8 | 18.9, 28.2 |
| Typical apparent clearance, slow eliminators (CLslow/F, l h−1) | 9.70 | 3.05 | 9.61, 10.7 |
| Typical apparent central volume of distribution (Vc/F, l) | 57.7 | 2.81 | 56.3, 62.9 |
| Typical apparent peripheral volume of distribution (Vp/F, l) | 1730 | 14.7 | 1313, 2514 |
| Typical apparent intercompartmental clearance (Q/F, l h−1) | 3.34 | 8.52 | 2.43, 3.38 |
| Typical absorption rate constant (ka, h−1) | 1.85 | 4.01 | 1.72, 2.06 |
| Typical absorption lag time (tlag, h) | 0.180 | 7.63 | 0.166, 0.226 |
| Proportion of fast eliminators in population (Pfast) | 0.132 | 23.2 | 0.0685, 0.184 |
| Linear effect of positive HIV status on CL/F (θCL,HIV) | −0.174 | 22.2 | −0.266, −0.0990 |
| Linear effect of being female on Vc/F (θVc,gender,F) | −0.103 | 25.7 | −0.205, −0.0861 |
| Interindividual variability (%CV) | |||
| Apparent clearance (ωCL2) | 18.4 | 13.6 | 13.6, 19.3 |
| Apparent central volume of distribution (ωVc2) | 16.5 | 12.6 | 12.4, 16.8 |
| Apparent intercompartmental clearance (ωQ2) | 93.1 | 25.4 | 92.1, 132 |
| Relative bioavailability (ωF2) | 26.2 | 9.77 | 25.2, 29.9 |
| Absorption lag time (ωtlag2) | 88.4 | 9.57 | 86.6, 102 |
| Interoccasional variability (%CV) | |||
| Absorption rate constant (κka2) | 90.1 | 5.92 | 80.5, 92.0 |
| Relative bioavailability (κF2) | 8.4 | 33.0 | 8.77, 14.4 |
| Residual variability (standard deviation) | |||
| Additive variability for DPM (σ, log scale, mg l−1) | 0.205 | 2.74 | 0.187–0.229 |
Generated by nonparametric bootstrap, n = 1000. RSE = relative standard error. Typical value of CL/F = CL · (body weight/70)0.75· (1–0.174 · HIV), where CL = 21.6 or 9.70 for fast and slow eliminators, respectively, and HIV = 0 or 1 for negative and positive status, respectively; typical value of Vc/F = 57.7 · (body weight/70) · (1–0.103 · SEX), where SEX is 0 for males and 1 for females; typical value of Vp/F = 1730 · (body weight/70); typical value of Q/F = 3.34 · (body weight/70)0.75.
Figure 2.
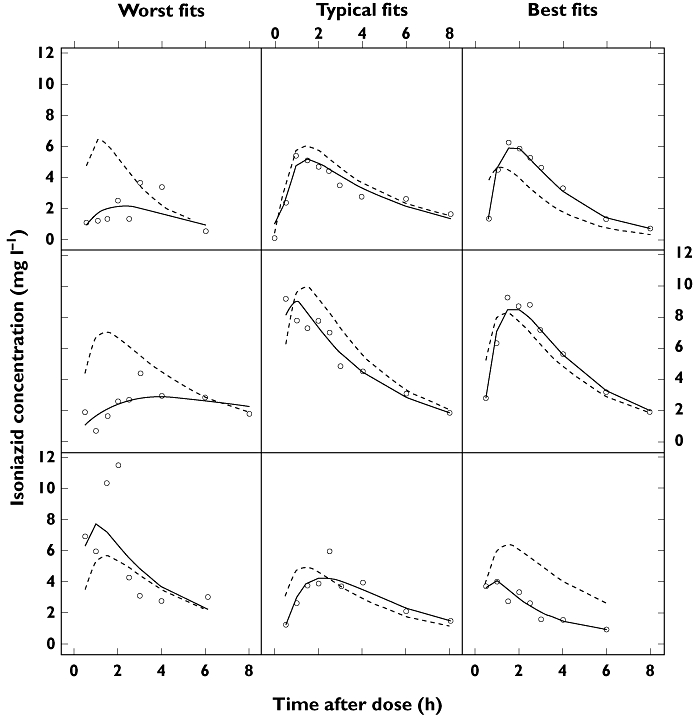
Plots of the observations (open circles), individual predictions (solid lines) and population predictions (dotted lines) from the final pharmacokinetic model, to illustrate goodness-of-fit for fast absorbers and slow absorbers. ‘Worst fit’, ‘Typical fit’ and ‘Best fit’ denote degree of goodness-of-fit, categorized by the median of the absolute weighted individual residuals (IWRES) in each individual. C = isoniazid plasma concentration
Figure 3.
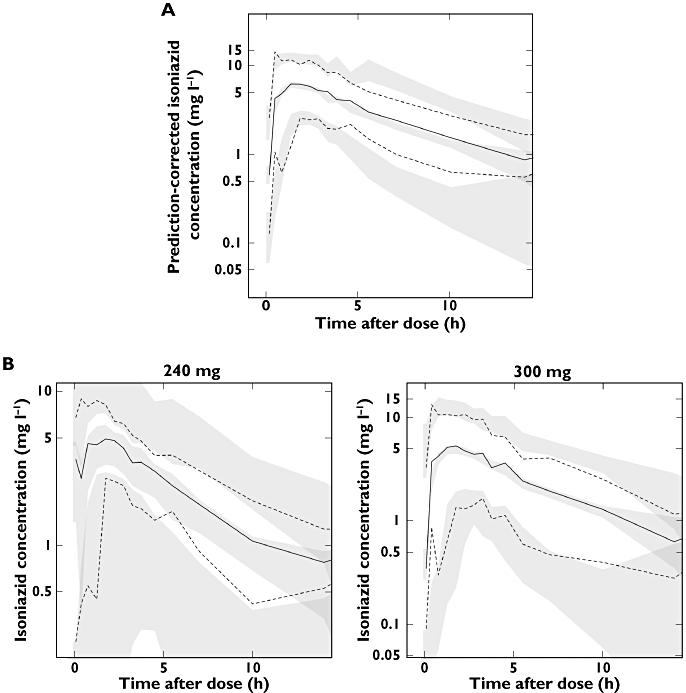
(A) A prediction-corrected visual predictive check (PC-VPC) and (B) VPCs stratified for 240 mg and 300 mg doses. The open circles are the observed data points, solid lines are the 2.5th, 50th and 97.5th percentiles of the observations (binned by time interval), dashed lines are the 2.5th, 50th and 97.5th percentiles of the simulated data, and the shaded regions represent the 95% confidence intervals for the simulation percentiles)
Shrinkage in interindividual variability estimates for CL/F (43.8% and 43.6% in fast and slow eliminators, respectively) and Vp/F (52.5% and 42.8% in fast and slow eliminators, respectively) was high, as was shrinkage in the interoccasional variability estimates for ka (15.6% to 100% for fast eliminators and 21.7% to 62.5% for slow eliminators) and F (63.4% to 100% for fast eliminators and 63.8% to 75.8% for slow eliminators). Shrinkage was lower in other IIV parameters (Q/F: 3.61% and 28.2% in fast and slow eliminators, respectively; F: 14.4% and 17.% in fast and slow eliminators, respectively; tlag: 16.4% and 27.4% in fast and slow eliminators, respectively). Shrinkage in residual error was 7.44% for fast eliminators and 23.2% for slow eliminators.
Figure 4 compares the predictions of Cmax, C2h, and AUC(0,∞) obtained from simulations of current WHO-recommended dosing guidelines for the eight different subgroups and the four weight-based dosing bands. Exposure in fast eliminators was relatively low relative to the cut-offs used, especially in patients of low body weight.
Figure 4.
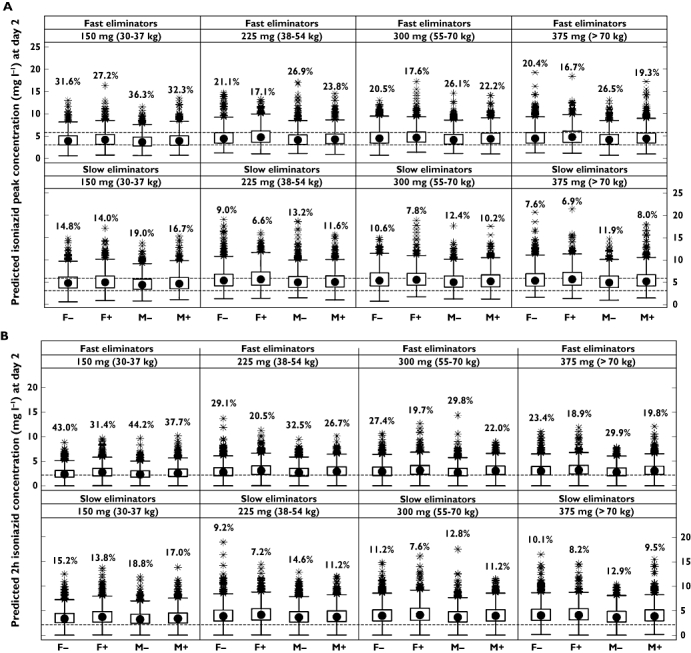

Distribution of simulated pharmacokinetic metrics after 2 days of continuous dosing in fast and slow eliminators using doses based on current WHO guidelines (5 mg kg−1 body weight), stratified by eliminator status and weight-based dosing band (30–37 kg = 150 mg, 38–54 kg = 225 mg, 55–70 kg = 300 mg, >70 kg = 375 mg). (A) Isoniazid peak concentration (Cmax); percentages are the number of Cmax values under 3 mg l−1; dashed horizontal lines represent the ‘normal range’ of 3–6 mg l−1. (B) Isoniazid concentration at 2 h post-dose; percentages are the number of concentrations under 2.19 mg l−1 (represented by the dashed horizontal line), the threshold associated with 90% of maximal EBA. (C) Isoniazid area under the curve (AUC(0,∞)); percentages are the number of concentrations under 10.52 mg l−1 h (represented by the dashed horizontal line), the threshold associated with 90% of maximal EBA. Solid circles are medians, open circles are outliers, boxes represent the interquartile range, and whiskers extend to the most extreme data point which is no more than 1.5 times the length of the box away from the box
Discussion
A model for the population pharmacokinetics of isoniazid incorporating allometric scaling was developed and found to describe and predict the observed patient data adequately. The model was flexible enough to describe the pharmacokinetics of isoniazid the majority of patients, and provided adequate predictive power as judged by VPCs.
Estimates of variability in CL/F and Vc/F were not unusually high, but the same was not true of absorption-related parameters. High variability in absorption rate constant (ka) was estimated to be derived entirely from between-occasion differences (90.1%). In contrast, variability in F was had a larger interindividual component than interoccasional (26.2% vs. 8.4%, respectively). Interindividual variability in lag time was also large (88.4%).
Although absorption in many of the studied patients was rapid, others appeared to absorb the drug much more slowly (some examples appear in Figure 2), in contrast to previously published reports in which isoniazid has been shown to be rapidly and completely absorbed [28–30]. This has implications for therapeutic drug monitoring (TDM), which has been suggested as a useful tool in the treatment of tuberculosis [27]. Substantial variability in absorption kinetics means that the use of a single consistent time point for TDM is unlikely to provide a reliable estimate of true isoniazid exposure. In any event, TDM is of limited practical use in resource-poor high-burden countries, where it is currently unavailable and unlikely to become available in the foreseeable future.
In the absence of genotypic or metabolite data [31], a mixture model composed of two populations, fast and slow, was used to predict eliminator phenotype. The final estimate of the proportion of fast eliminators in the population was 13.2%. Trimodal elimination has been defined by acetylator status [15], but these data did not support the differentiation of intermediate eliminators from fast and slow eliminators. The proportion of fast acetylators in South African populations [5, 32, 33] has been estimated to be between 23.4% and 74.3% (with the lower frequencies described in Caucasian patients). These estimates are based on genotype, however, whereas our analysis relies on phenotype alone. In addition to acetylation, clearance in the fast and slow eliminator groups is likely to include contributions by other unidentifiable pathways.
Fast eliminators were predicted to have a mean apparent clearance of 21.6 l h−1, and slow eliminators were estimated to have a mean apparent clearance of 9.70 l h−1. Peloquin and colleagues [34] reported apparent clearances of approximately 15 l h−1 in slow acetylators and approximately 50 l h−1 in rapid acetylators in a small study conducted in healthy male North American subjects. These estimates are substantially higher than those we report, do not appear to be explained by differences in body weight between the populations, and reflect observed concentrations substantially lower than those observed in the current study. Another model-based analysis, conducted in healthy Caucasian volunteers and using a two-compartment model with first-order absorption and elimination, produced CL/F estimates closer to those we report [35]. Slow acetylators were predicted to have an apparent clearance of 10.0 l h−1, intermediate acetylators an apparent clearance of 19.2 l h−1, and fast acetylators were predicted to have an average apparent clearance of 28.4 l h−1. A small steady-state study conducted in an African patient population in Nairobi, Kenya, reported Cmax and AUC(0,12 h) values substantially lower than we observed [36]. In contrast, another study in South African patients produced AUC estimates similar to ours [15, 26]. Possible reasons for these discrepancies include differences in methodology, study population, sampling schedules and study design, analytical methods and drug formulations. It is important to highlight that our study was multiple dose, whereas the healthy volunteer studies used only single doses of isoniazid. Substantial differences in isoniazid pharmacokinetics appear to exist between South African tuberculosis patients and other populations.
Two significant and potentially clinically relevant covariate relationships were identified. Typical Vc/F in female patients was estimated to be 10.3% lower than in male patients, independent of body size. Reasons for pharmacokinetic differences between genders are varied, and in this case may relate to the typically greater percentage of body fat in females [37]. HIV co-infection was associated with a reduction of 17.4% in CL/F, which may relate to reported drops in NAT2 activity in HIV-positive subjects [38–42]. A link between isoniazid bioavailability and HIV status has been reported previously [43–45], but no significant relationship was identified in our data.
EBA refers to the fall in log10 viable colony-forming units of M. tuberculosis in sputum samples during the first 2 days of treatment in patients with microscopy smear-positive pulmonary tuberculosis [3], and has become accepted as an objective and reproducible means of estimating the ability of a drug to kill metabolically-active bacilli [46]. Donald and colleagues have published thresholds of AUC(0,∞) and C2h which in their analysis were linked to reaching 90% of maximal isoniazid-mediated EBA [26], which together with the ‘normal range’ of isoniazid concentrations proposed for informing TDM [27], provide a useful basis for evaluating levels of isoniazid exposure. Results of simulations using weight-based dosing derived from current WHO guidelines indicated that exposure may be suboptimal in fast eliminators according to these thresholds, with low weight patients (<55 kg) in this subgroup more likely to receive low exposures (Figure 4). Between 15.4% and 35.2% of fast eliminators in the lowest weight group were predicted to have day 2 AUC(0,∞) values below the cut-off of 10.52 mg l−1 h. The dosing regimens in place at the study sites at the time the data were collected resulted in isoniazid exposures that were higher than are likely to result from application of current guidelines (Figure 1). Doses lower than 240 mg were rarely given (Table 1), and low weight patients who would have received 150 mg according to current guidelines often received doses twice as high during the conduct of our study. Without better knowledge of the exposure-response relationships involved (including those related to safety), it is, however, difficult to judge the significance of these findings.
Knowledge of the pharmacokinetics of isoniazid in this tuberculosis patient population will be of considerable usefulness in the scaling of doses to paediatric patients. A key area of future research will be the linking of this pharmacokinetic model (as well as similar models for rifampicin, pyrazinamide and ethambutol, amongst other components of tuberculosis chemotherapy) with markers of clinical response in order to derive a truly optimal dosing regimen. Although this is a challenging undertaking given the multidrug nature of tuberculosis treatment and the significant quantities of time and resources required to gather data of this kind at an acceptable level of quality, it is an essential step to elucidate the complex dose exposure-response relationships involved in tuberculosis chemotherapy, an area that, even today, is not fully understood.
Acknowledgments
We thank Jean van Dyk, Rudy Onia, Afia Fredericks and Alicia Evans for their invaluable technical and logistical assistance.
This research was co-funded by the South African Medical Research Council and by the Division of Clinical Pharmacology of the Department of Medicine, Faculty of Health Sciences, University of Cape Town, South Africa.
All work described here was carried out with full written ethical approval from the University of Cape Town, Brewelskloof Hospital and the D P Marais SANTA Centre, and complies fully with South African legal requirements for biomedical research.
Competing Interests
JW was employed by Novartis between December 2006 and November 2010. GL is currently a Pfizer employee and shareholder. GP is currently employed by and owns stock and shares in Novartis Pharma. There are no other competing interests to declare.
REFERENCES
- 1.World Health Organization. Global Tuberculosis Control: WHO Report 2010. WHO/HTM/TB/2010.7. Geneva: World Health Organization; 2010. [Google Scholar]
- 2.Wood R. The case for integrating tuberculosis and HIV treatment services in South Africa. J Infect Dis. 2007;196(Suppl 3):S497–499. doi: 10.1086/521118. [DOI] [PubMed] [Google Scholar]
- 3.Jindani A, Aber VR, Edwards EA, Mitchison DA. The early bactericidal activity of drugs in patients with pulmonary tuberculosis. Am Rev Respir Dis. 1980;121:939–49. doi: 10.1164/arrd.1980.121.6.939. [DOI] [PubMed] [Google Scholar]
- 4.Donald PR, Sirgel FA, Botha FJ, Seifart HI, Parkin DP, Vandenplas ML, van de Wal BW, Maritz JS. The early bactericidal activity of isoniazid related to its dose size in pulmonary tuberculosis. Am J Respir Crit Care Med. 1997;156:895–900. doi: 10.1164/ajrccm.156.3.9609132. [DOI] [PubMed] [Google Scholar]
- 5.Donald PR, Sirgel FA, Venter A, Parkin DP, Seifart HI, van de Wal BW, Werely C, van Helden PD, Maritz JS. The influence of human N-acetyltransferase genotype on the early bactericidal activity of isoniazid. Clin Infect Dis. 2004;39:1425–30. doi: 10.1086/424999. [DOI] [PubMed] [Google Scholar]
- 6.Mitchison DA. Basic mechanisms of chemotherapy. Chest. 1979;76(Suppl):771–81. doi: 10.1378/chest.76.6_supplement.771. [DOI] [PubMed] [Google Scholar]
- 7.Winder FG, Collins PB. Inhibition by isoniazid of synthesis of mycolic acids in Mycobacterium tuberculosis. J Gen Microbiol. 1970;63:41–8. doi: 10.1099/00221287-63-1-41. [DOI] [PubMed] [Google Scholar]
- 8.Takayama K, Wang L, David HL. Effect of isoniazid on the in vivo mycolic acid synthesis, cell growth, and viability of Mycobacterium tuberculosis. Antimicrob Agents Chemother. 1972;2:29–35. doi: 10.1128/aac.2.1.29. [DOI] [PMC free article] [PubMed] [Google Scholar]
- 9.World Health Organization. WHO Tuberculosis Programme: Framework for Effective Tuberculosis Control. WHO/TB/94.179. Geneva: WHO; 1994. [Google Scholar]
- 10.Lienhardt C, Ogden JA. Tuberculosis control in resource-poor countries: have we reached the limits of the universal paradigm? Trop Med Int Health. 2004;9:833–41. doi: 10.1111/j.1365-3156.2004.01273.x. [DOI] [PubMed] [Google Scholar]
- 11.Frieden TR, Munsiff SS. The DOTS strategy for controlling the global tuberculosis epidemic. Clin Chest Med. 2005;26:197–205. doi: 10.1016/j.ccm.2005.02.001. [DOI] [PubMed] [Google Scholar]
- 12.Atun R, Olynik I. Resistance to implementing policy change: the case of Ukraine. Bull World Health Organ. 2008;86:147–54. doi: 10.2471/BLT.06.034991. [DOI] [PMC free article] [PubMed] [Google Scholar]
- 13.Chideya S, Winston CA, Peloquin CA, Bradford WZ, Hopewell PC, Wells CD, Reingold AL, Kenyon TA, Moeti TL, Tappero JW. Isoniazid, rifampin, ethambutol, and pyrazinamide pharmacokinetics and treatment outcomes among a predominantly HIV-infected cohort of adults with tuberculosis from Botswana. Clin Infect Dis. 2009;48:1685–94. doi: 10.1086/599040. 15. [DOI] [PMC free article] [PubMed] [Google Scholar]
- 14.World Health Organization. Treatment of Tuberculosis: Guidelines. WHO/HTM/TB/2009.420. 4th edn. Geneva: World Health Organization; 2009. [Google Scholar]
- 15.Parkin DP, Vandenplas S, Botha FJ, Vandenplas ML, Seifart HI, van Helden PD, van der Walt BJ, Donald PR, van Jaarsveld PP. Trimodality of isoniazid elimination: phenotype and genotype in patients with tuberculosis. Am J Respir Crit Care Med. 1997;155:1717–22. doi: 10.1164/ajrccm.155.5.9154882. [DOI] [PubMed] [Google Scholar]
- 16.Cho H, Koh W, Ryu Y, Ki C, Nam M, Kim J, Lee S. Genetic polymorphisms of NAT2 and CYP2E1 associated with antituberculosis drug-induced hepatotoxicity in Korean patients with pulmonary tuberculosis. Tuberculosis (Edinb) 2007;87:551–6. doi: 10.1016/j.tube.2007.05.012. [DOI] [PubMed] [Google Scholar]
- 17.Possuelo LG, Castelan JA, de Brito TC, Ribeiro AW, Cafrune PI, Picon PD, Santos AR, Teixeira RLF, Gregianini TS, Hutz MH, Rossetti MLR, Zaha A. Association of slow N-acetyltransferase 2 profile and anti-TB drug-induced hepatotoxicity in patients from Southern Brazil. Eur J Clin Pharmacol. 2008;64:673–81. doi: 10.1007/s00228-008-0484-8. [DOI] [PubMed] [Google Scholar]
- 18.Wilkins JJ, Savic RM, Karlsson MO, Langdon G, McIlleron H, Pillai G, Smith PJ, Simonsson USH. Population pharmacokinetics of rifampin in pulmonary tuberculosis patients, including a semimechanistic model to describe variable absorption. Antimicrob Agents Chemother. 2008;52:2138–48. doi: 10.1128/AAC.00461-07. [DOI] [PMC free article] [PubMed] [Google Scholar]
- 19.Wilkins JJ, Langdon G, McIlleron H, Pillai GC, Smith PJ, Simonsson USH. Variability in the population pharmacokinetics of pyrazinamide in South African tuberculosis patients. Eur J Clin Pharmacol. 2006;62:727–35. doi: 10.1007/s00228-006-0141-z. [DOI] [PubMed] [Google Scholar]
- 20.McIlleron H, Wash P, Burger A, Norman J, Folb PI, Smith P. Determinants of rifampin, isoniazid, pyrazinamide, and ethambutol pharmacokinetics in a cohort of tuberculosis patients. Antimicrob Agents Chemother. 2006;50:1170–7. doi: 10.1128/AAC.50.4.1170-1177.2006. [DOI] [PMC free article] [PubMed] [Google Scholar]
- 21.Smith PJ, van Dyk J, Fredericks A. Determination of rifampicin, isoniazid and pyrazinamide by high performance liquid chromatography after their simultaneous extraction from plasma. Int J Tuberc Lung Dis. 1999;3(Suppl 3):S325–328. [PubMed] [Google Scholar]
- 22.Jonsson EN, Karlsson MO. Xpose – an S-PLUS based population pharmacokinetic/pharmacodynamic model building aid for NONMEM. Comput Methods Programs Biomed. 1999;58:51–64. doi: 10.1016/s0169-2607(98)00067-4. [DOI] [PubMed] [Google Scholar]
- 23.Savic RM, Jonker DM, Kerbusch T, Karlsson MO. Implementation of a transit compartment model for describing drug absorption in pharmacokinetic studies. J Pharmacokinet Pharmacodyn. 2007;34:711–26. doi: 10.1007/s10928-007-9066-0. [DOI] [PubMed] [Google Scholar]
- 24.Anderson BJ, Holford NHG. Mechanism-based concepts of size and maturity in pharmacokinetics. Annu Rev Pharmacol Toxicol. 2008;48:303–32. doi: 10.1146/annurev.pharmtox.48.113006.094708. [DOI] [PubMed] [Google Scholar]
- 25.Bergstrand M, Hooker AC, Wallin JE, Karlsson MO. Prediction corrected visual predictive checks [Internet] In: American Conference on Pharmacometrics (ACoP). Mashantucket: 2009. Available at http://2009.go-acop.org/sites/all/assets/webform/Poster_ACoP_VPC_091002_two_page.pdf (last accessed 16 March 2011) [DOI] [PMC free article] [PubMed]
- 26.Donald PR, Parkin DP, Seifart HI, Schaaf HS, van Helden PD, Werely CJ, Sirgel FA, Venter A, Maritz JS. The influence of dose and N-acetyltransferase-2 (NAT2) genotype and phenotype on the pharmacokinetics and pharmacodynamics of isoniazid. Eur J Clin Pharmacol. 2007;63:633–9. doi: 10.1007/s00228-007-0305-5. [DOI] [PubMed] [Google Scholar]
- 27.Peloquin CA. Therapeutic drug monitoring in the treatment of tuberculosis. Drugs. 2002;62:2169–83. doi: 10.2165/00003495-200262150-00001. [DOI] [PubMed] [Google Scholar]
- 28.Elmendorf DF, Cawthon WU, Muschenheim C, McDermott W. The absorption, distribution, excretion, and short-term toxicity of isonicotinic acid hydrazide (nydrazid) in man. Am Rev Tuberc. 1952;65:429–42. doi: 10.1164/art.1952.65.4.429. [DOI] [PubMed] [Google Scholar]
- 29.Barclay WR, Ebert RH, Le Roy GV, Manthei RW, Roth LJ. Distribution and excretion of radioactive isoniazid in tuberculous patients. J Am Med Assoc. 1953;151:1384–8. [PubMed] [Google Scholar]
- 30.Des Prez R, Boone IU. Metabolism of C14-isoniazid in humans. Am Rev Respir Dis. 1961;84:42–51. doi: 10.1164/arrd.1961.84.1.42. [DOI] [PubMed] [Google Scholar]
- 31.Eidus L, Varughese P, Hodgkin MM, Hsu AH, McRae KB. Simplification of isoniazid phenotyping procedure to promote its application in the chemotherapy of tuberculosis. Bull World Health Organ. 1973;49:507–16. [PMC free article] [PubMed] [Google Scholar]
- 32.Loktionov A, Moore W, Spencer SP, Vorster H, Nell T, O'Neill IK, Bingham SA, Cummings JH. Differences in N-acetylation genotypes between Caucasians and Black South Africans: implications for cancer prevention. Cancer Detect Prev. 2002;26:15–22. doi: 10.1016/s0361-090x(02)00010-7. [DOI] [PubMed] [Google Scholar]
- 33.Schaaf HS, Parkin DP, Seifart HI, Werely CJ, Hesseling PB, van Helden PD, Maritz JS, Donald PR. Isoniazid pharmacokinetics in children treated for respiratory tuberculosis. Arch Dis Child. 2005;90:614–8. doi: 10.1136/adc.2004.052175. [DOI] [PMC free article] [PubMed] [Google Scholar]
- 34.Peloquin CA, Jaresko GS, Yong CL, Keung AC, Bulpitt AE, Jelliffe RW. Population pharmacokinetic modeling of isoniazid, rifampin, and pyrazinamide. Antimicrob Agents Chemother. 1997;41:2670–9. doi: 10.1128/aac.41.12.2670. [DOI] [PMC free article] [PubMed] [Google Scholar]
- 35.Kinzig-Schippers M, Tomalik-Scharte D, Jetter A, Scheidel B, Jakob V, Rodamer M, Cascorbi I, Doroshyenko O, Sörgel F, Fuhr U. Should we use N-acetyltransferase type 2 genotyping to personalize isoniazid doses? Antimicrob Agents Chemother. 2005;49:1733–8. doi: 10.1128/AAC.49.5.1733-1738.2005. [DOI] [PMC free article] [PubMed] [Google Scholar]
- 36.Choudhri SH, Hawken M, Gathua S, Minyiri GO, Watkins W, Sahai J, Sitar DS, Aoki FY, Long R. Pharmacokinetics of antimycobacterial drugs in patients with tuberculosis, AIDS, and diarrhea. Clin Infect Dis. 1997;25:104–11. doi: 10.1086/514513. [DOI] [PubMed] [Google Scholar]
- 37.Anderson GD. Gender differences in pharmacological response. Int Rev Neurobiol. 2008;83:1–10. doi: 10.1016/S0074-7742(08)00001-9. [DOI] [PubMed] [Google Scholar]
- 38.O'Neil WM, Gilfix BM, DiGirolamo A, Tsoukas CM, Wainer IW. N-acetylation among HIV-positive patients and patients with AIDS: when is fast, fast and slow, slow? Clin Pharmacol Ther. 1997;62:261–71. doi: 10.1016/S0009-9236(97)90028-X. [DOI] [PubMed] [Google Scholar]
- 39.O'Neil WM, Drobitch RK, MacArthur RD, Farrough MJ, Doll MA, Fretland AJ, Hein DW, Crane LR, Svensson CK. Acetylator phenotype and genotype in patients infected with HIV: discordance between methods for phenotype determination and genotype. Pharmacogenetics. 2000;10:171–82. doi: 10.1097/00008571-200003000-00009. [DOI] [PubMed] [Google Scholar]
- 40.Lee BL, Wong D, Benowitz NL, Sullam PM. Altered patterns of drug metabolism in patients with acquired immunodeficiency syndrome. Clin Pharmacol Ther. 1993;53:529–35. doi: 10.1038/clpt.1993.66. [DOI] [PubMed] [Google Scholar]
- 41.Deloménie C, Grant DM, Mathelier-Fusade P, Jacomet C, Leynadier F, Jacqz-Aigrain E, Rozenbaum W, Krishnamoorthy R, Dupret JM. N-acetylation genotype and risk of severe reactions to sulphonamides in AIDS patients. Br J Clin Pharmacol. 1994;38:581–2. doi: 10.1111/j.1365-2125.1994.tb04401.x. [DOI] [PMC free article] [PubMed] [Google Scholar]
- 42.Jones AE, Brown KC, Werner RE, Gotzkowsky K, Gaedigk A, Blake M, Hein DW, van der Horst C, Kashuba A. Variability in drug metabolizing enzyme activity in HIV-infected patients. Eur J Clin Pharmacol. 2010;66:475–85. doi: 10.1007/s00228-009-0777-6. [DOI] [PMC free article] [PubMed] [Google Scholar]
- 43.Berning SE, Huitt GA, Iseman MD, Peloquin CA. Malabsorption of antituberculosis medications by a patient with AIDS. N Engl J Med. 1992;327:1817–8. doi: 10.1056/NEJM199212173272514. [DOI] [PubMed] [Google Scholar]
- 44.Peloquin CA, Nitta AT, Burman WJ, Brudney KF, Miranda-Massari JR, McGuinness ME, Berning SE, Gerena GT. Low antituberculosis drug concentrations in patients with AIDS. Ann Pharmacother. 1996;30:919–25. doi: 10.1177/106002809603000901. [DOI] [PubMed] [Google Scholar]
- 45.Gurumurthy P, Ramachandran G, Hemanth Kumar AK, Rajasekaran S, Padmapriyadarsini C, Swaminathan S, Venkatesan P, Sekar L, Kumar S, Krishnarajasekhar OR, Paramesh P. Malabsorption of rifampin and isoniazid in HIV-infected patients with and without tuberculosis. Clin Infect Dis. 2004;38:280–3. doi: 10.1086/380795. [DOI] [PubMed] [Google Scholar]
- 46.Donald PR, Diacon AH. The early bactericidal activity of anti-tuberculosis drugs: a literature review. Tuberculosis (Edinb) 2008;88(Suppl 1):S75–83. doi: 10.1016/S1472-9792(08)70038-6. [DOI] [PubMed] [Google Scholar]