

Abstract
Insulin and insulin growth factor type 1 (IGF-1) and their receptors are closely related molecules but both factors bind to the receptor of the other one with a weak affinity. No study has presently documented a role of insulin as a myeloma growth factor (MGF) for human multiple myeloma cells (MMC) whereas many studies have concluded that IGF-1 is a major MGF. IGF-1 receptor (IGF-1R) is aberrantly expressed by MMC in association with a poor prognosis. We show here that insulin receptor (INSR) is increased throughout normal plasma cell differentiation. INSR gene is also expressed by MMC of 203/206 newly-diagnosed patients. Insulin is a MGF as potent as IGF-1 at physiological concentrations and requires the presence of insulin/IGF-1 hybrid receptors, stimulating INSR+IGF-1R+ MMC, unlike INSR+IGF- 1R− or INSR-IGF-1R− MMC. Immunoprecipitation experiments indicate that INSR is linked with IGF-1R in MMC and that insulin induces both IGF-1R and INSR phosphorylations and vice versa. In conclusion, we demonstrate for the first time that insulin is a MGF as potent as IGF-1 at physiological concentrations and its activity necessitates insulin/IGF-1 hybrid receptor activation. Further therapeutic strategies targeting the IGF-IGF-1R pathway have to take into account neutralizing the IGF-1R-mediated insulin MGF activity.
Keywords: Antibodies, Monoclonal; pharmacology; Cell Division; drug effects; Cell Line, Tumor; Cell Survival; drug effects; Flow Cytometry; Gene Expression Regulation, Neoplastic; Growth Substances; pharmacology; Humans; Insulin; genetics; pharmacology; Insulin-Like Growth Factor I; pharmacology; physiology; Kinetics; Multiple Myeloma; genetics; pathology; Nucleic Acid Hybridization; Oligonucleotide Array Sequence Analysis; Receptor, IGF Type 1; immunology; isolation & purification; physiology; Receptor, Insulin; genetics; isolation & purification; physiology; Recombinant Proteins; pharmacology; Reverse Transcriptase Polymerase Chain Reaction; Transcription, Genetic
Keywords: multiple myeloma, insulin, IGF-1, IGF-1R, INSR, insulin/IGF-1 hybrid receptor
Introduction
Many reports have documented a role of insulin as well as of IGF-1 as growth factors in a variety of cancers 1. Insulin and IGF-1 and their receptors are closely related molecules. A role of insulin has not been investigated carefully in multiple myeloma (MM), a clonal B-cell neoplasia characterized by the accumulation of malignant plasma cells (MMCs) within the bone marrow. In a study published in 1993, a high insulin concentration (400-fold higher than the physiological concentrations) was reported to increase slightly the proliferation of one myeloma cell line 2. A role of insulin could be of importance since IGF-1 is the most important of the phethora of myeloma cell growth factors (MGF) that has been described 3. In particular, the MGF activity of IL-6, HB-EGF or HGF is partly dependant on an IGF-1/IGF-1R loop 4. IGF- 1R is only expressed by the MMCs, unlike normal plasma cells, and patients with IGF-1Rpresent MMC had a significantly shorter survival than patients with IGF-1Rabsent MMC 4–6.
Insulin and IGF-1 receptors share 60% overall amino acid sequence homology and 84% homology in their tyrosine kinase domains 7. They are tetrameric glycoproteins composed of 2 extracellular α-subunits and 2 transmembrane β-subunits linked by disulfide bonds 7. The α- and β-subunits are encoded by a single gene, whose gene product is glycosylated, proteolytically cleaved, and crosslinked by cysteine bonds to form a functional transmembrane αβ chain. The extracellular α-chain is involved in ligand binding and the intracellular β-chain includes the tyrosine kinase domain 1. IGF-1, IGF-2 and insulin - the ligands of these receptors - have also high sequence and structure similarity. This high sequence and structural homology between the receptors and between their ligands result in cross-talks between IGF-1 and insulin signaling. IGF-1R and INSR can heterodimerize leading to the formation of insulin/IGF-1 hybrid receptors (hybrid-R), which comprises one α- and one β-subunit of each receptor 8. INSR exists in 2 isoforms, which differ by exon 11 splicing - INSRA (INSR−ex11) and INSR-B (INSR+ex11) - yielding to 2 possible hybrid-Rs: hybrid-RA and hybrid-RB. The ligands of these hybrid-Rs are controversially discussed. Whereas IGF-1 and IGF-2 can bind with high affinity to IGF-1R only and insulin to INSR only, Pandini et al. have shown that IGF-1, IGF-2 and insulin may bind to hybrid-RA (IGF-1R/INSR-A) with high affinity 8. Only IGF-1 can bind hybrid-RB with a high affinity, IGF-2 with a weaker affinity and insulin insignificantly 8. Contrarily to these data, Slaaby et al. found that these 2 hybrid-Rs have similar binding properties as the IGF-1R homodimer 9. They can bind IGF-1 and IGF-2 with high affinity and insulin with a very low affinity. Thus, the biological role of the hybrid-R is still unclear. Although they share strong homologies, the homodimeric receptors - IGF-1R and INSR - have different functions: IGF-1R signaling is predominantly involved in cell growth regulation whereas INSR signaling controls carbohydrate metabolism regulation 1.
In this study, we have shown that insulin has a similar effect as IGF-1: insulin is an anti-apoptotic and proliferation factor for myeloma cells. The mechanism of action likewise includes AKT and MAPK phosphorylations. The growth factor activity of insulin necessitates an activation of IGF-1R. Only INSR+IGF-1R+ myeloma cell lines can be stimulated by insulin, unlike INSR+IGF-1R− myeloma cell lines. In agreement, the insulin growth activity is inhibited by an anti-INSR mAb but also by an IGF-1R kinase inhibitor or an anti-IGF1R mAb. We show the presence of INSR/IGF-1R heterodimers at the cell surface of HMCLs and that insulin induces both IGF-1R and INSR phosphorylations. This MGF activity of insulin through insulin/IGF-1 hybrid receptors is of importance for the development of strategies aiming the neutralization MMC survival and proliferation triggered by IGF-1R activation in MMC.
Materials and Methods
Cell samples
The 14 human myeloma cell lines (HMCLs) were obtained in our laboratory (XG HMCLs) 10, provided by Dr Pellat-Deceunynck (BCN, Nantes, France), or purchased from ATCC (NCI-H929, LP-1, OPM2, L363, Rockville, MD, USA). They were maintained in RPMI1640 (Gibco Invitrogen, France), 10% fetal bovine serum (FBS, PAA laboratory GmbH, Austria) and for the IL-6-dependant cell lines, with 2 ng/ml of IL-6. CD27+ memory B cells (MBCs), in-vitro generated polyclonal plasmablasts (D7 PBs, CD20−CD38++CD138− cells) and plasma cells (D10 PCs, CD20−CD38++CD138− cells) were obtained as previously described 11. Normal bone marrow plasma cells (BMPCs) and MMC of 206 patients with previously untreated MM were purified as described 12. These patients presenting with previously untreated MM (n=206) at the University Hospitals of Heidelberg and Montpellier and the healthy normal donors were included in the studies approved by the institutional review board of the Medical Faculty of the Ruprecht-Karls-University Heidelberg, Germany and the institutional review board of the CHU Montpellier, France, for the respective patients. Written informed consent was obtained in accordance with the Declaration of Helsinki. These 206 patients were treated with high dose therapy (HDC) and autologous stem cell transplantation (ASCT) and were termed in the following Heidelberg-Montpellier (HM) series. Bone marrow of patients with MM was obtained for routine follow up and excess cells were used with written consent of the patients.
Reagents
Recombinant human IL-6 was purchased from Abcys SA (Paris, France), recombinant human IGF-1 from R&D Systems (Minneapolis, MN), and recombinant human insulin from Roche Diagnostics (Basel, Switzerland). The B-E8 anti-IL6 mAb was a generous gift from Dr Wijdenes (Diaclone, Besancon, France) 13, and the NVPAEW541 IGF-1R inhibitor from Novartis Pharma AG (Basel, Switzerland) 14. The anti- INSR antibody was purchased from Abcam (Cambridge, United Kingdom) and the αIR3 anti-IGF-1R mAb from Calbiochem (Darmstadt, Germany). The Syn-H Iscovebased fully-defined culture medium containing human albumin, anti-oxidative reagents and amino acids without insulin was purchased from ABCell-Bio (Montpellier, France). siRNAs to INSR (siINSR), IGF-1R (siIGF-1R) or 1 nM nontargeting siRNA (siGLO) were purchased from Dharmacon (Lafayette, CO).
Flow cytometry Analysis
The expression INSR on HMCLs was evaluated by incubating 5 × 10⁵ cells with PEconjugated anti-human INSR (BD Biosciences, San Diego, CA) or an isotypematched control antibody in phosphate-buffered saline (PBS) containing 2% FBS at 4°C for 30 minutes. The cells were washed twice in PBS. Flow cytometry analysis was performed on a FACScan (Becton Dickinson, San Jose, CA). The mean fluorescence intensity (MFI) obtained with the isotype matched control antibody was set between 3 and 5.
Microarray hybridization
RNA was extracted with the RNeasy Kit (Quiagen, Valencia, CA), the SV-total RNA extraction kit (Promega, Mannheim, Germany) and Trizol (Invitrogen, Karlsruhe, Germany) in accordance to the manufacturer’s instructions. Biotinylated complementary RNA (cRNA) was amplified with a double in-vitro transcription, according to the Affymetrix small sample labeling protocol (Affymetrix, Santa Clara, CA, USA). The biotinylated cRNA was fragmented and hybridized to human U133 2.0 GeneChip microarrays according to manufacturer’s instructions (Affymetrix). Fluorescence intensities were quantified and analyzed using the GECOS software (Affymetrix). Arrays were scaled to an average intensity of 100. A threshold of 1 was assigned to values under 1.
Real-time RT-PCR
Total RNA was converted to cDNA using the Superscript II reverse transcriptase (RT; Invitrogen, Cergy Pontoise, France). The assays-on-demand primers and probes and the TaqMan Universal Master Mix were used according to the manufacturer’s instructions (Applied Biosystems, Courtaboeuf, France). Measurement of gene expression was performed using the ABI Prism 7000 Sequence Detection System. Quantitative PCR analysis was completed using ABI PRISM 7000 SDS Software. For each primer, serial dilutions of a standard cDNA were amplified to create a standard curve, and values of unknown samples were estimated relative to this standard curve in order to assess the PCR efficiency. Ct values were collected for GAPDH and the genes of interest during log phase of the cycle. Gene of interest levels were normalized to GAPDH for each sample (δCt = Ct gene of interest – Ct GAPDH) and compared with the values obtained for a known positive control using the following formula 100/2δδCt where δδCt = δCt unknown – δCt positive control.
Signal transduction and immunoblot analysis
To look for signal transduction, myeloma cell lines were harvested in the exponential growth phase. Cells were washed twice in RPMI-1% BSA and starved at 37°C for 18 hours in the Syn-H serum-free culture medium. After 2 washings, cells (106 cells/ml) were incubated with pre-warmed insulin (100 ng/ml) or IGF-1 (100 ng/ml) with or without inhibitors for 20 minutes. In preliminary experiments, a 20-minute stimulation made it possible to get an optimal triggering of transduction pathways by recombinant MGF. The IGF-1R kinase inhibitor or the anti-INSR mAb were added to the cells for 4 hours at the end of starvation culture and during exposure to recombinant MGF. Cells were lysed in 10 mM Tris-HCl (pH 7.05), 50 mM NaCl, 50 mM NaF, 30 mM sodium pyrophosphate (NaPPi), 1% triton X-100, 5 μM ZnCl2, 100 μM Na3VO4, 1 mM DTT, 20 mM β-glycerophosphate, 20 mM p-nitrophenolphosphate (PNPP), 20 μg/ml aprotinin, 2.5 μg/ml leupeptin, 0.5 mM PMSF, 0.5 mM benzamidine, 5 μg/ml pepstatin, and 50 nM okadaic acid. Lysates were resolved on 12% sodium dodecyl sulfate-polyacrylamide by gel electrophoresis (SDS-PAGE) and transferred to a nitrocellulose membrane (Schleicher and Schuell, Kassel, Germany). Membranes were blocked for 2 hours at room temperature in 140 mM NaCl, 3 mM KCl, 25 mM Tris-HCl (pH 7.4), 0.1% Tween 20 (TBS-T), 5% non-fat milk, and then immunoblotted with anti-phospho-Akt, anti-phospho-MAPK, anti-Akt and anti-MAPK antibodies (Cell Signaling Technology, Beverly, MA). As a control for protein loading, we used a mouse monoclonal anti-β-actin antibody (Sigma, St Louis, MO). The primary antibodies were visualized with goat anti-rabbit (Sigma) or goat anti-mouse (Bio-Rad, Hercules, CA) peroxidase-conjugated antibodies by an enhanced chemiluminescence detection system.
Immunoprecipitation of insulin and IGF-1 receptors proteins
Prior to SDS-PAGE and Western blot studies, the cells were solubilized with ice-cold cell lysis buffer (20 mM Tris, 150 mM NaCl, 5 mM EDTA, 0.5% sodium deoxycholate and 0.5% Triton X-100, pH 7.5) supplemented with protease inhihitors (1mM phenylmethylsulfonyl fluoride, 1.5 μg/ml leupeptin, 1.5 μg/ml aprotinin) and a phosphotyrosine phosphatase inhibitor (1mM sodium vanadate) for 30 minutes on ice. Cell lysates were scraped and further disrupted by passage through a syringe needle. The lysates were then centrifuged at 14000 g for 15 minutes at 4°C and the supernatants were collected. To immunoprecipitate INSR or IGF-1R, cell lysates (107 cells) were incubated with 2 μg anti-INSR or anti-IGF-1R antibodies overnight on a shaker at 4°C. The day after, protein A/G plus-agarose (Santa Cruz biotechnology) was added to lysates and incubated on a rocker overnight at 4°C to capture immunocomplexes. After 3 washes with ice-cold cell lysis buffer, the pellets of agarose-bounds protein were resuspended in 50 μl of 2X Laemmli sample buffer and were boiled for 2 minutes to dissociate the immunocomplexes from the beads and reduce the disulphide bridges holding the receptor subunits together.
To study monomeric receptors (denaturing conditions), cell lysate was treated with 1 mM dithiotreitol (DTT) for 30 minutes at 4°C to separate the receptor β-subunit forms each other before IP. The reduction was then terminated with 3 mM Nethylmaleimide 15. Lysates were resolved on 12% sodium dodecyl sulfatepolyacrylamide by gel electrophoresis (SDS-PAGE) and transferred to a nitrocellulose membrane (Schleicher and Schuel). Membranes were blocked for 2 hours at room temperature in TBS-T, 5% non-fat milk, and then immunoblotted with anti-phospho-IGF-1R/INSR (Cell Signaling technology), anti-IGF-1R and anti-INSR antibodies (Santa Cruz).
Assay for myeloma cell line growth
HMCLs were IL-6- and serum-starved for 2 hours and cultured for 4 days in 96-well flat-bottomed microtiter plates in Syn-H serum-free culture medium without cytokine (control) or with insulin or IGF-1, without or with the IGF-1R inhibitor NVP-AEW541 (0.5 μM) or the anti-INSR mAb (1 μg/ml). At the end of the culture, the number of viable cells was evaluated by quantifying intracellular ATP amount with a Cell Titer Glo Luminescent Assay (Promega Corporation, Madison, USA) with a Centro LB 960 luminometer (Berthold Technology, Germany).
Short-term culture of primary myeloma cells
A survival effect of recombinant insulin (100 ng/ml) or IGF-1 (100 ng/ml) on primary MMC of patients was evaluated culturing bone marrow mononuclear cells of patients with MM for 5 days at 5 × 10⁵ cells/ml in Syn-H serum-free medium as reported previously 16. At the end of the culture, viable cell numbers were determined using trypan blue staining and the percentage of viable myeloma cells was assayed using labelling with an anti-CD138-PE MoAb (Beckman-Coulter, Marseille, France) and FACS analysis. CD138 is expressed on viable MMCs only 17. The role of insulin or IGF-1 present in AB serum to support primary MMC survival in short-term cultures was evaluated culturing bone marrow mononuclear cells from patients with MM in RPMI1640 and 5% AB serum in the presence of a neutralizing anti-INSR mAb (1 μg/ml) or of IGFBP-3 (2 μg/ml) as an IGF-1 inhibitor. At the end of the culture, the number of viable MMC was determined as indicated above.
Statistical analysis
A difference in the mean values of two (paired) groups was evaluated with a (paired) student t test using the SPSS10 software. Gene Expression Profiles were analyzed with our RAGE bioinformatics platform (RAGE, remote analysis of microarray gene expression, http://rage.montp.inserm.fr) designed by T. Rème 18 and with the Amazonia website (amazonia.montp.inserm.fr) 19. The prognostic value of a probe set was evaluated using the Affymetrix call (“present” or “absent”) that is determined by the Affymetrix GCOS-software as indicator whether a gene is expressed or not. The statistical significance of differences in survival between groups of patients was calculated by the log-rank test. An event was defined as relapse or disease progression (for EFS) or as death (for OAS). Survival curves were plotted using the Kaplan-Meier method.
Results
Expression of insulin receptor (INSR) in normal plasma cells, primary myeloma cells and myeloma cell lines
Expression of INSR gene was investigated in a large cohort of normal and malignant samples using Affymetrix microarrays. The Affymetrix probe set 226450_at with the highest variance among samples was used. Affymetrix signal was validated by the measurement of INSR membrane expression using FACS analysis (Figure 1A). Using a panel of 14 HMCLs, the rMFI ranged from 1.3 to 21.8 and was correlated with Affymetrix signal (n= 14, r = 0.79, P = 8.10−4, Figure 1B). In particular, the XG-10 HMCL with the lowest rMFI was the only cell line with an absent Affymetrix call. Affymetrix signal was also correlated with real-time RT-PCR data in HMCLs (n = 10, r = 0.8, P = 4.10−3, Figure 1B).
Figure 1. Expression of the insulin Receptor (INSR) on human myeloma cell lines.
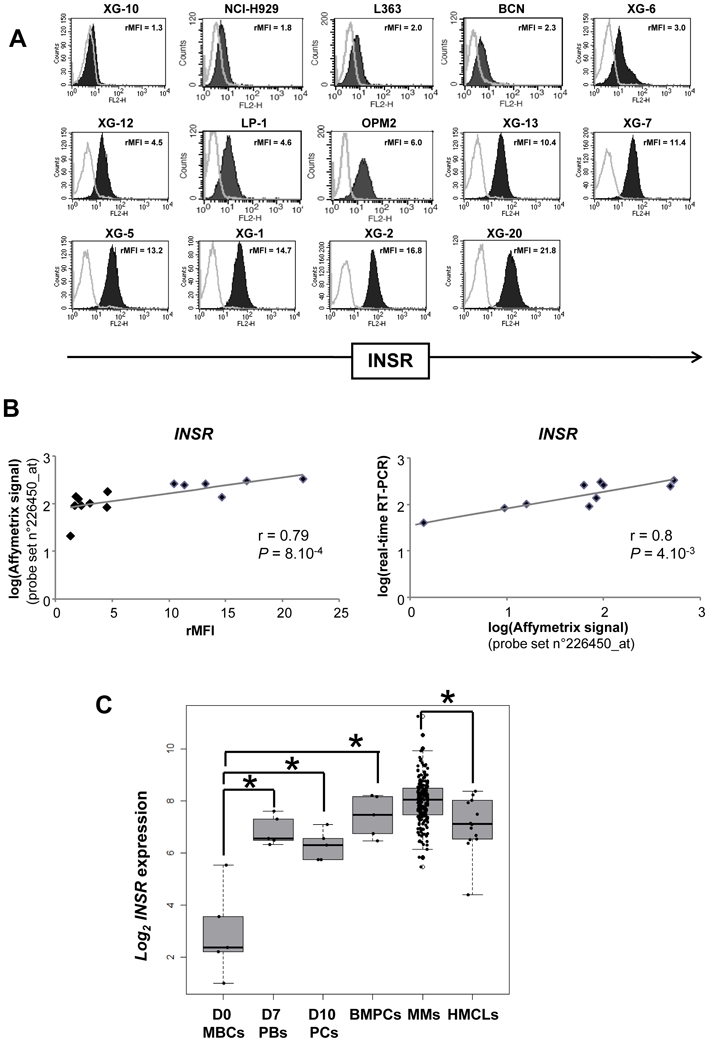
(A) Cell surface expression of INSR was determined by flow cytometry using PEconjugated anti-INSR mAb. The black histograms show the FACS labelling with anti- INSR mAb. Results are the ratio of the mean fluorescence intensities (rMFI) of the labelling with the anti-INSR mAb and that with the isotype-matched control mAb (B) Correlations (Pearson correlation) of INSR gene expression with Affymetrix probe set 226450_at with INSR detection by FACS analysis or with INSR gene expression assayed with real-time RT-PCR. Real-time RT-PCR data were normalized with GAPDH and the XG-6 HMCL was used as a standard. (C) Box plots of gene expression signal for INSR in 5 samples of memory B cells (MBCs), 5 samples of plasmablasts generated at day 7 using an in vitro model (D7 PBs)11, 5 samples of plasma cells generated at day 10 using an in vitro model (D10 PCs)11, 7 samples of purified bone marrow plasma cells (BMPCs), primary myeloma cells (MMCs) from 206 newly-diagnosed patients with MM, and 14 HMCLs. The top, bottom and middle lines of each box correspond to the 75th percentile (top quartile), 25th percentile (bottom quartile) and 50th percentile (median) of the Log2 Affymetrix signal for INSR 226450_at probe set. The significance of the differences in median INSR gene expressions in the various populations was evaluated with a Wilcoxon test. * indicates that the Wilcoxon test was significant (P ≤ .05).
INSR expression is a plasma cell marker. Indeed, memory B cells purified from the peripheral blood of healthy individuals did not express INSR gene (“absent” Affymetrix call) and INSR expression was gradually induced in day 7 plasmablasts (D7 PBs) and then day 10 plasma cells (D10 PCs) generated using an in vitro model of plasma cell differentiation (Figure 1C) (http://amazonia.transcriptome.eu/index.php?zone=PlasmaCell)11. Purified bone marrow plasma cells (BMPCs) also expressed INSR (Figure 1C). INSR had a present Affymetrix call in 203/206 primary MMC of previously untreated patients, with an Affymetrix signal ranging from 200 to 2400 (Figure 1C). INSR expression in MMC was not associated with MM disease clinical parameters (age, heavy chain isotype, β2m, albumin, CRP, hemoglobin, LDH, bone lesions, Durie-salmon or ISS staging) and had no prognostic value for event free survival or overall survival as a continuous or a binary variable (above or below the median INSR expression).
Myeloma growth factor activity of insulin
Insulin significantly stimulated the growth of 12 of 14 HMCLs, which expressed both IGF-1R and INSR (P ≤ .05) (Figure 2A). The 2 HMCLs that were not stimulated by insulin were IGF-1R-. The XG-10 HMCL did not express both IGF-1R and INSR and XG-12 expressed INSR, unlike IGF-1R. The growth activity of insulin was observed with XG IL-6 dependant cell lines and commercially available cell lines (NCI-H929, LP-1, OPM2, L363). It was already significant with 100 pg/ml insulin for the most sensitive HMCLs and increased with graded insulin concentrations. With 100 ng/ml insulin, the growth stimulation ranged from 2.1 fold (XG-20) to 18 fold (XG-2). As reported 4, IGF-1 stimulated HMCLs (P ≤ .05), unlike the IGF-1R− HMCLs (XG-10 and XG-12). We show here additional data indicating that IGF-1 growth activity was already significant with 100 pg/ml IGF-1, as for insulin, and became higher with increasing IGF-1 concentrations (Figure 2B). The growth stimulations were in the same range as those for insulin, i.e., from 2.5 fold (XG-6) to 16 fold (XG-2). The 4 HMCLs for which growth was most effectively stimulated by insulin (i.e., XG-2, XG-1, NCI-H929, BCN) were also most strongly stimulated by IGF-1. No correlation between the fold stimulation by insulin or IGF-1 and INSR or IGF-1R gene or protein expressions was found.
Figure 2. Insulin is a myeloma growth factor.

Myeloma cell lines (HMCLs) were starved for 2 hours and cultured without growth factor (group) or with increasing concentration of insulin (A) or IGF-1 (B) for 4 days in the Syn-H culture medium. The starting cell concentration was 105 cells/ml. Results are the mean luminescent signal determined in 6 replicate culture wells and are those from 1 out of 3 representative experiments. Data are shown as mean percentage ± SD of the luminescent signal obtained with insulin or IGF-1 compared to that of the control group. * The mean value was significantly different from that obtained in the control group using a Student t test (P ≤ .05).
Inhibition of insulin growth activity by INSR or IGF-1R inhibitors
The MGF activity of insulin was blocked by an anti-INSR mAb and this anti-INSR mAb did not affect the IGF-1 MGF activity. Data for 4 HMCLs (i.e., XG-2, XG-5, XG-6 and XG-7) are shown in Figure 3. The growth of XG-10 and XG-12 HMCLs, which were not stimulated by recombinant insulin or IGF-1, was not affected either by the anti-INSR mAb or IGF-1R inhibitor (Figure 3E-F). Of note, the NVP-AEW541 IGF-1R kinase inhibitor also blocked insulin MGF activity, the efficacy depending on the cell line. This IGF-1R inhibitor fully blocked the MGF activity of IGF-1. The NVP-AEW541 IGF-1R inhibitor strongly suppressed the survival of some HMCLs, in particular XG-6, without adding exogenous MGF indicating that an autocrine IGF-1-IGF-1R loop was functional as reported 4. The anti-INSR mAb or the NVP-AEW541 IGF-1R inhibitor did not affect the growth of the INSR-IGF-1R− XG-10 or INSR+IGF-1R− XG-12 HMCL. The inhibition of insulin MGF activity by an IGF-1R inhibitor was confirmed with the neutralizing α IR3 anti-IGF-1R mAb. This mAb blocked insulin MGF activity (63–75%) as well as IGF-1 activity (57–90%) on 3 insulin- and IGF-1-stimulated HMCLs (XG-2, XG-5 and XG-7 HMCLs), unlike the INSR− IGF-1R− XG-10 HMCL (Table 1). We also looked whether knockouting INSR expression using a siRNA pool to INSR could block insulin-induced growth. A pool of 4 siRNAs to INSR reduced INSR protein expression by 32% as assayed by western blot, whereas INSR was not affected by siRNAs to IGF-1R. The siRNA pool to IGF-1R reduced IGF-1R protein expression by 47% and of note, the siRNA to INSR increased by 63% IGF-1R expression (Supplementary Figure S1A). The growth activity of insulin was decreased by a half by the siRNAs to INSR and that of IGF-1 was unaffected by siRNA to IGF-1R (Supplementary Figure S1B).
Figure 3. Insulin growth activity is blocked by the NVP-AEW541 IGF-1R inhibitor.

XG-2, XG-5, XG-6, XG-7, XG-10 and XG-12 HMCLs were starved for 2 hours and cultured without growth factor (group) or with increasing concentration of insulin or IGF-1 and without inhibitor or with anti-INSR mAb (1 μg/ml), or the NVP-AEW541 IGF-1R inhibitor (0.5 μM) for 4 days in Syn-H culture medium. The starting cell concentration was 105 cells/ml. Results are given as the mean luminescent signal determined in 6 replicate culture wells and from 1 out of 3 representative experiments. For each culture group, data are expressed as mean percentage ± SD of the luminescent signal obtained with insulin or IGF-1 with or without inhibitor compared to that of the group of cells cultured with culture medium alone. * The mean value was significantly different from that obtained in the control group using a Student t test (P ≤ .05).
Table 1. The αIR3 monoclonal antibody to IGF-1R blocked insulin-induced myeloma cell growth factor activity.
HMCLs were starved for 2 hours and cultured without growth factor (control), or with insulin (10 ng/ml), or IGF-1 (10 ng/ml) for 4 days in the Syn-H culture medium, without inhibitor or with an anti-INSR mAb (1 μg/ml), or the αIR3 anti-IGF-1R mAb (4 μg/ml) or the NVP-AEW541 IGF-1R kinase inhibitor (0.5 μM). Results are the mean luminescent signal determined in 6 replicate culture wells and are those from 1 out of 3 representative experiments. Data are expressed as mean percentage ± SD of the luminescent signal obtained with the inhibitor compared to that obtained with insulin or IGF-1 alone. When the percentages were significantly different with a Student t test (P ≤ .05), data are shown in bold and italic.
| recombinant growth factor | Insulin | IGF-1 | Insulin | IGF-1 | Insulin | IGF-1 |
|---|---|---|---|---|---|---|
| inhibition | anti-INSR MoAb % inhibition | αIR3 anti-IGF-1R MoAb % inhibition | NVP-EW541 IGF-1R inhibitor % inhibition | |||
| XG-2 | 85% | 0% | 70% | 57% | 46% | 82% |
| XG-5 | 37% | 0% | 75% | 78% | 35% | 55% |
| XG-7 | 38% | 0% | 63% | 90% | 40% | 70% |
| INSR- IGF-1R- XG-10 | 0% | 0% | 5% | 0% | 3% | 5% |
Insulin supports myeloma cell survival and proliferation and PI-3 kinase/AKT and MAP kinase activations
We investigated whether insulin is both a survival and proliferation factor for human myeloma cells. Without adding recombinant growth factors, the 4 HMCLs tested (XG- 2, XG-7, XG-10, XG-12) apoptosed within 3 days as assayed with annexin-V staining (Table 2A). Insulin reduced the apoptosis-rate of the 2 IGF-1R+ HMCLs (P ≤ .05) but had no effect on INSR− IGF-1R− XG-10 and INSR+IGF-1R− XG-12 HMCLs. In a control experiment, we showed that IGF-1 promoted the survival of the 2 IGF-1R+ HMCLs. IL-6 promoted the survival of all 4-tested HMCL, independent of IGF-1R+/− state.
Table 2. Insulin promotes the survival and the proliferation of HMCLs.
HMCLs were starved for 2 hours and cultured without growth factor (control) or with insulin (10 ng/ml), IGF-1 (10 ng/ml), or IL-6 (2 ng/ml) for 3 days in the Syn-H culture medium. The starting cell concentration was 2 × 10⁵ cells/ml. At the end of the culture, BrdU was added for 30 minutes. The percentage of apoptotic cells (A) and the percentage of cells in the S phase (B) were evaluated by flow cytometry after staining with Annexin V or with an anti-BrdU antibody. Results are the percentage of the labelled cells and are those from 1 out of 3 representative experiments. When the percentages were different with a Student t test (P ≤ .05) from those obtained with cells cultured in culture medium alone (control group), data are shown in bold and italic.
| A | Annexin V+ cells (%) | |||
|---|---|---|---|---|
| control | + Insulin | + IGF-1 | + IL-6 | |
| XG-2 | 69% | 25% | 34% | 24% |
| XG-7 | 25% | 10% | 9% | 8% |
| XG-10 | 87% | 88% | 84% | 63% |
| XG-12 | 56% | 48% | 48% | 40% |
| B | BrdU+ cells (%) | |||
|---|---|---|---|---|
| control | + Insulin | + IGF-1 | + IL-6 | |
| XG-2 | 3% | 25% | 23% | 32% |
| XG-7 | 40% | 70% | 69% | 44% |
| XG-10 | 1% | 1% | 2% | 12% |
| XG-12 | 6% | 11% | 8% | 13% |
The proliferative activity of insulin was investigated with anti-BrdU labelling. Insulin stimulated the percentage of cells in the S phase of XG-2 and XG-7 cells (P ≤ .05), unlike that of XG-10 and XG-12 HMCLs (Table 2B). The proliferative effect of IGF-1 paralleled that of insulin. IL-6 stimulated the proliferation of all 4 tested HMCLs (Table 2B).
Insulin induced the phosphorylation of AKT and MAPK (Figure 4A) but did not activate JAK/STAT3 or NF-κB pathways (result not shown). The anti-INSR mAb as well as the NVP-AEW541 IGF-1R inhibitor blocked the insulin-induced signal transduction (Figure 4A). The NVP-AEW541 IGF-1R inhibitor and the IR3α anti-IGF- 1R mAb used are known to be specific of IGF-1R and do not recognize INSR. In hour hands, they do not block AKT and MAPK phosphorylations induced by insulin in the IGF-1R− XG-12 cell line, unlike the anti-INSR mAb. We have recently shown that IGF- 1 activates also AKT and MAPK phosphorylations in myeloma cells, unlike STAT3 or NF-κB 4. In several experiments, the NVP-AEW541 IGF-1R inhibitor was more efficient to inhibit AKT and MAPK phosphorylations in XG-2 cells 20 minutes after insulin activation than the anti-INSR mAb. An explanation is that the IGF-1R inhibitor is a direct IGF-1R kinase inhibitor, likely being more efficient to block the 20-minute AKT and MAPK phosphorylations than the anti-INSR mAb.
Figure 4. Insulin receptor associates with IGF-1R at the cell membrane of myeloma cells and insulin induces IGF-1R and INSR phosphorylations.

Signaling pathways induced by insulin. XG-2 cells were starved at 37°C for 18 hours in Syn-H serum-free culture medium. Cells were then cultured without cytokine (control) or insulin (100 ng/ml) and without inhibitor or with NVP-AEW541 IGF-1R kinase inhibitor (1 μM) or the anti-INSR mAb (1 μg/ml) for 20 minutes at 37°C in the Syn-H culture medium. The receptor inhibitors were added to cells for 4 hours at the end of starvation culture and during exposure to insulin. Cell lysates were immunoblotted with anti-phospho-Akt antibody and reprobed with anti-akt antibody, anti-phospho-MAPK antibody and reprobed with anti-MAPK. Anti-βactin was used as a loading control. (B) Immunoprecipitation (IP) of XG-7 and XG-12 cell lysates with polyclonal antibodies against either INSR or IGF-1R and detection of both receptors with the same antibodies on the same membrane by western blot. Before IP, lysates were treated without dithiotreitol (DTT), i.e. in non-denaturating condition (nd), or with DTT, i.e. in denaturating condition (d) to break protein complexes. Standard (std) is the cell lysates without IP. XG-12 was used as negative control for IGF-1R. (C) IP of XG-1, XG-2, XG-5, XG-6, XG-10 and XG-20 lysates with a polyclonal antibody to IGF-1R and detections of INSR and IGF-1R with anti-INSR and anti-IGF-1R antibodies by western blot. XG-10 was used as negative control for IGF-1R and INSR. (D) XG-7 cells were starved at 37°C for 18 hours in Syn-H serum-free culture medium. Cells were then cultured without cytokine (control), or with IGF-1 (100 ng/ml) or with insulin (100 ng/ml) for 20 minutes at 37°C. The immunoprecipitation of INSR or IGF-1R in XG-7 lysates were done in denaturing condition. Cell lysates were immunoblotted with an anti-phospho-IGF-1R/INSR antibody, reprobed with an anti- INSR antibody and reprobed with an anti-IGF-1R antibody again.
Insulin receptors associate with IGF-1R at the cell membrane of myeloma cells
Using western blot analysis, both INSR and IGF-1R were detected in the INSR+ IGF- 1R+ XG-7 HMCL (Figure 4B). Immunoprecipitation (IP) of IGF-1R in non-denaturating conditions resulted in detection of IGF-1R as well as INSR. In denaturating conditions (monomeric receptors), IGF-1R IP resulted only in IGF-1R detection, unlike INSR (Figure 4B). INSR IP in non-denaturating conditions also resulted in detection of both INSR and IGF-1R, and in denaturating conditions, of only INSR. As a control, we used the XG-12 HMCL that expressed INSR but not IGF-1R by FACS and western blot. INSR IP in non-denaturating conditions resulted in INSR detection only, similar to IP in denaturating conditions (Figure 4B). The presence of insulin/IGF-1 hybrid receptors was investigated in 5 additional INSR+ IGF-1R+ HMCLs (i.e., XG-1, XG-2, XG-5, XG-6, XG-20), and similar data were obtained (Figure 4C). Immunoprecipitation in non-denaturating conditions with an anti-IGF-1R mAb resulted in detection of both INSR and IGF-1R. IP in denaturating conditions yielded to detection of only the IGF-1 receptor (data not shown). Similar data were obtained using IP with an anti-INSR mAb for these 5 INSR+IGF-1R+ HMCLs (results not shown). No INSR or IGF-1R was detected in the XG-10 HMCL that did not express these receptors by FACS analysis (Figure 4C).
Insulin induced IGF-1R phosphorylation
As the MGF activity of insulin is inhibited by a mAb to IGF-1R and INSR is associated with IGF-1R in myeloma cells, we have investigated whether insulin can induce IGF- 1R phosphorylation. Since there is no relevant antibody that is specific to phosphorylated IGF-1R only, we took advantage of the ability to immunoprecipitate INSR and/or IGF-1R in non-denaturating or denaturating conditions as shown in Figure 4B. After insulin stimulation and IGF-1R immunoprecipitation in denaturating conditions, only IGF-1R could be immunoprecipated, unlike INSR (Figure 4C and 4D). The immunoprecipitated IGF-1R was phosphorylated by insulin stimulation since it was labelled by an anti-phosphorylated IGF-1R/INSR antibody. After insulin stimulation and INSR immunoprecipitation in denaturating conditions, only INSR could be immunoprecipitated and the immunoprecipated was also labelled by the anti-phosphorylated IGF-1R/INSR antibody (Figure 4D). The same holds true for IGF-1 stimulation. After IGF-1 stimulation and IGF-1R or INSR IP in denaturating conditions, both IGF-1R and INSR were phosphorylated.
Myeloma cell growth activity of serum insulin
We have investigated whether circulating insulin present in human AB serum could be partly responsible for the myeloma cell growth activity of serum. Adding increasing concentrations of human AB serum increased the growth of myeloma cells (Figure 5A). The reported concentration of insulin in human serum is about 2 ng/ml and that of IGF-1 and IGF-2, 100–200 ng/ml 1. An anti-INSR mAb (1 μg/ml) significantly reduced (P < .05) the serum-induced myeloma cell growth activity. This anti-INSR mAb (1 μg/ml) completed blocked the insulin growth activity (10 ng/ml), without affecting that of 10 ng/ml IGF-1 (Figure 5B). Blocking IGF-1 activity with recombinant IGFBP-3 (2 μg/ml) also reduced the serum-induced growth. Recombinant IGFBP-3 (2 μg/ml) completely blocked the myeloma cell growth activity of 10 ng/ml IGF-1, without affecting that of 10 ng/ml insulin (Figure 5B). Of interest, adding both the anti-INSR mAb and IGFBP-3 synergistically inhibited myeloma cell growth induced by human serum (Figure 5A).
Figure 5. Serum insulin can promote the growth of myeloma cell lines and primary myeloma cells.
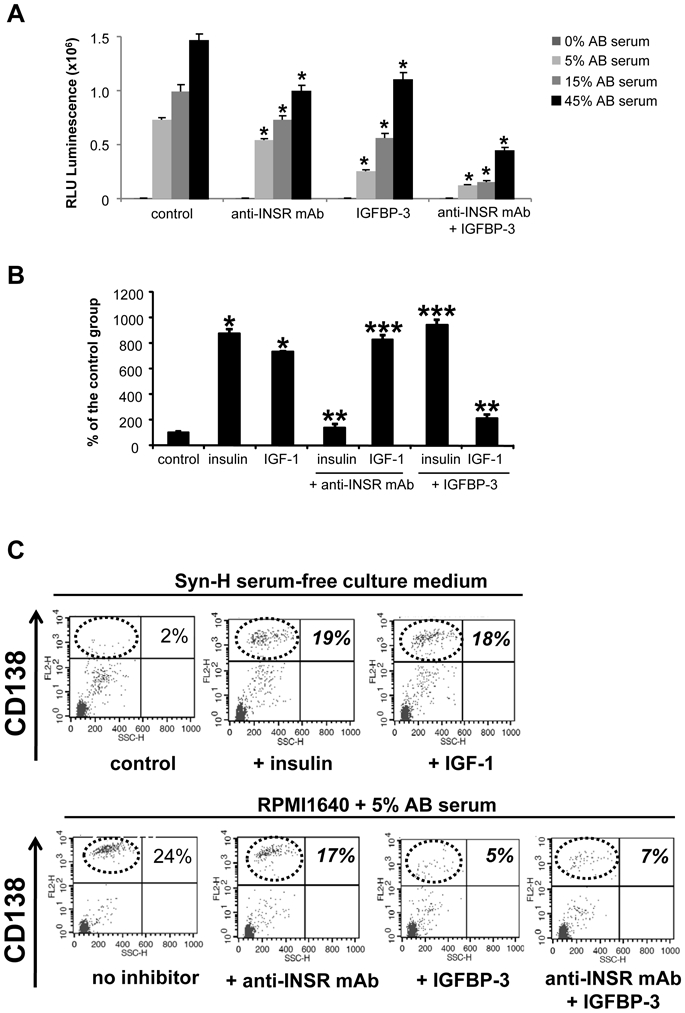
(A) XG-2 MMC were cultured for 4 days in Syn-H culture medium with graded concentrations of human AB serum, in the presence a neutralizing anti-INSR mAb (1 μg/ml) or IGFBP-3 inhibitor to IGF-1 (2 μg/ml). Results are the mean luminescent signal ± SD of 5 different experiments. * The mean value was significantly different from that obtained in the control group using a Student t test (P ≤ .05).
(B) The anti-INSR mAb (1 μg/ml) specifically blocked the effect of insulin (10 ng/ml) unlike that of IGF-1 (10 ng/ml) and IGFBP-3 (2 μg/ml) that of IGF-1 (10 ng/ml) unlike that of insulin (10 ng/ml). * The mean value was significantly different from that obtained in the control group using a Student t test (P ≤ .05); ** the mean luminescent signal with insulin and anti-INSR mAb (IGF-1 and IGFBP-3) was significantly lower than that with insulin (IGF-1) (P ≤ .05); *** the mean luminescent signal with insulin and IGFBP-3 (IGF-1 and anti-INSR mAb) was not significantly different than that with IGF-1 (insulin).
(C) Bone marrow mononuclear cells (5 × 10⁵ cells/ml) from patients with MM were cultured for 5 days in two culture systems. The first one used Syn-H serum-free culture medium without or with 100 ng/ml recombinant insulin or IGF-1. The second one used RPMI1640 + 5% AB serum without or with neutralizing anti-INSR mAb (1 μg/ml) or IGFBP-3 (2 μg/ml). At the end of the culture, viable cells were counted and the MMC expressing CD138 were determined. Data are dot plot FACS profiles of CD138 labelling and SSC of one patient sample representative of 7.
Insulin can promote the survival of primary myeloma cells
To evaluate the role of insulin on the survival of patients’ primary MMC, 2 culture systems were used. First, bone marrow mononuclear cells from patients with MM (containing primary MMC and other bone marrow cells) were cultured for 5 days in serum-free culture medium. Viable MMC were assayed using FACS staining of membrane CD138 since early apoptotic MMC rapidly loss membrane CD138 17. As illustrated in Figure 5C for one patient sample, MMC did not survive in serum-free culture, and addition of recombinant insulin or of recombinant IGF-1 conferred survival on MMC. Similar data were observed for the BM samples of other 6 patients (Table 3). This survival effect of insulin or IGF-1 was observed only with primary MMC that expressed IGF-1R. In the second culture system, bone marrow mononuclear cells were cultured with RPMI1640 and 5% human AB serum. The neutralizing anti-INSR mAb could significantly reduced the AB serum effect (P = .018, Figure 5C and Table 3). The IGFBP-3 inhibitor to IGF-1 was more efficient in blocking AB serum survival effect but this is hardly surprising since serum IGF-1 concentration is 100-fold higher than that of insulin (Figure 5C and Table 3).
Table 3. Primary myeloma cells are stimulated by insulin or IGF-1 and the anti- INSR mAb or the anti-IGF-1 inhibits their survival.
Mononuclear cells from patients with MM were cultured for 5 days at 5 × 10⁵ cells/ml in serum-medium free without cytokine or with either insulin (100 ng/ml) or IGF-1 (100 ng/ml). To study the role of human serum insulin or IGF-1, primary myeloma cells were cultured in RPMI 1640 medium and 5% AB serum with either the anti- INSR mAb (1 μg/ml) or IGFBP-3 (2 μg/ml). In each culture group, cells were counted and labelled with an anti-CD138-PE antibody and CD138+ and CD138− cells determined by FACS analysis. Data are the median values and ranges determined with of 7 patients’ samples. Results in bold and italic indicate that the median value compared to that of the control group is statistically significantly different using a Wilcoxon test for pairs (P ≤ .05).
| Syn-H serum-free medium | |||
|---|---|---|---|
| control | insulin | IGF-1 | |
| CD138+ myeloma cell number/ml (median value) | 3828 | 13018 | 13134 |
| range | 1600–274890 | 2280–399718 | 4250–333427 |
| P-value | 0.028 | 0.018 | |
| non myeloma cell number/ml (median value) | 145110 | 267498 | 206866 |
| range | 96390–216370 | 90300–313467 | 206866–245750 |
| P-value | 0.06 | 0.09 | |
| RPMI1640 + 5% AB serum | ||||
|---|---|---|---|---|
| no inhibitor | anti-INSR mAb | IGFBP-3 | anti-INSR mAb + IGFBP-3 | |
| CD138+ myeloma cell number/ml (median value) | 49806 | 24486 | 18040 | 15697 |
| range | 8831–344448 | 5773–315954 | 6982–298218 | 5616–282656 |
| P-value | 0.018 | 0.028 | 0.018 | |
| non myeloma cell number/ml (median value) | 136169.5 | 154846.12 | 159382.08 | 124384 |
| range | 100716–396546 | 73725–415400 | 67969–391960 | 57694–286936 |
| P-value | 0.40 | 0.31 | 0.05 | |
Discussion
This is the first report showing that insulin is a potent growth and survival factor for human myeloma cell lines and for primary MMCs. The growth activity started to be detectable with a concentration of 100 pg/ml insulin, a concentration 30-fold below physiological concentrations 1. The insulin MGF activity increased with insulin concentrations, as does the MGF activity of IGF-1, both in term of bioactive concentrations and extent of growth induction. The insulin MGF activity requires both INSR and IGF-1R because it is observed only in IGF-1R+ HMCLs and is abrogated by IGF-1R or INSR inhibitors. On the contrary, the IGF-1 MGF activity is not affected by an anti-INSR neutralizing mAb, but fully blocked by IGF-1R inhibitors. Human plasma comprises about 2 ng/ml insulin and 100–200 ng/ml IGF-1 and IGF-1 bound to IGFBP, mainly IGFBP-3 and acid labile subunit 1. We have shown here that the insulin activity present in human serum is responsible in part of the myeloma cell growth activity of human serum. This was observed with both HMCLs and primary MMCs.
There was no correlation between the FACS-based INSR concentration and the extent of proliferative effect of insulin in HMCLs. We and others have previously found there was also no correlation between IL-6 proliferative effect and IL-6R and gp130 IL-6 transducer expressions. A likely explanation is that the HMCLs have abnormalities targeting the intracellular signaling pathways, in particular the NF-κB pathway 20–22, the ras pathway and myc pathway with myc translocations occurring in virtually all HMCLs 23. Additional abnormalities involve the AKT pathway, in particular a loss of PTEN 24. In addition, several HMCLs produce autocrine IGF-1 that will confer an autocrine IGF-1R activation, reducing the effect of adding exogenous insulin 4.
These data further extend the importance of insulin as a growth factor in epithelial cancers, i.e. breast, prostate, colon, pancreatic, in part signaling through hybrid receptors (hybrid-Rs) 1. In these cancers, INSR is overexpressed in tumor cells compared to normal cells 25. The surexpression of INSR promotes the formation of hybrid-Rs and the number of functional receptors for IGF-1 - IGF-1R and hybrid-Rs -, which have the same affinity for IGF-1 26. In breast cancer lines, Pandini et al. have shown hybrid-Rs to be the most abundant form of receptors at the cell surface of tumor cells compared to IGF-1R or INSR homodimers 27. Challenging results have been reported regarding the ability of hybrid-Rs to bind insulin with high affinity. Pandini et al. 27 found insulin to be able to bind the hybrid-Rs with high affinity, whereas Slaaby et al. found that IGF-1 had at least a 50-fold higher affinity compared to insulin 9. Our current data are in favor of a high affinity of insulin to bind and to activate hybrid-Rs in myeloma cells. Indeed, the insulin concentrations triggering myeloma cell growth were similar to those of IGF-1, and in particular, the biological activity of insulin could be detected at low concentration (100 pg/ml). It has been shown that the dimers involving 2 molecules of either IGF-1R, INSR or IGF-1R and INSR are preformed before ligand activation 7. It is noteworthy that both anti-INSR mAb or IGF-1R inhibitor blocked the effect of insulin whereas only IGF-1R inhibitor blocked the effect of IGF-1, unlike anti-INSR. This suggests that the preformed IGF- 1R dimers are at sufficient concentrations to yield an optimal proliferative activity of IGF-1 or that the anti-INSR mAb does not affect the binding of IGF-1 to the hybrid-Rs as previously noted 28.
We show here that INSR is a plasma cell marker. INSR gene was not expressed by normal memory B cells (absent Affymetrix call), but was induced upon in vitro differentiation of memory B cells into day 4 activated B cells, day 7 plasmablasts and then day 10 plasma cells 11. INSR was also highly expressed in normal bone marrow plasma cells. The Affymetrix data were confirmed by real time RT-PCR and FACS analysis (results not shown). There might be an interesting role of insulin in normal plasma cell differentiation, function and survival. The main biological function of plasma cells is to secrete high amounts of immunoglobulin, necessitating high uptake of amino acids. Plasma cell differentiation is also associated with the expression of a high density of syndecan-1, with the necessity to continuously synthesize large levels of heparan sulfate chains and to import glucose 29. In mammalian cells, these metabolic functions are upregulated by insulin-mediated INSR activation 30. INSR is also expressed in primary MMC, at the same level as that found in normal bone marrow plasma cells. But a major difference between normal and malignant plasma cells is that normal plasmablasts or plasma cells do not express IGF-1R 4. In a previous work, we found IGF-1R gene is expressed in 35% and 50% of primary myeloma cells in 2 large series of newly diagnosed patients, in association with a poor prognosis 4, confirming previous data with a small cohort of 37 patients studied with flow cytometry 5. This aberrant expression of IGF-1R in MMC is likely a key oncogenic event in MM. It would be important to elucidate which mechanisms control this aberrant IGF-1R expression in MMC and why insulin requires IGF-1R to trigger MMC growth. A difference in insulin and IGF-1 biological activities whereas activating common signaling pathways is a current finding in various cell lineages, and may involved 3 critical nodes, the insulin receptor substrate (IRS) proteins, the recruited PI-3 kinase subunits and then AKT isoforms 30. We have shown that insulin can trigger INSR, AKT and MAPK phosphorylations in the INSR+IGF-1R− XG-12 HMCL without triggering myeloma cell growth (results not shown) and this model will be promising to further elucidate IRS proteins, PI-K subunits and AKT isoforms involved. In vivo, the aberrant expression of IGF-1R in primary MMC forming hybrid receptor with INSR could have two consequences. First, it will increase the number of high affinity receptor for IGF-1 and IGF-2, both as IGF-1R homodimers and Hybrid-Rs. The availability for IGF receptor on MMC is likely the major limitation for IGF MGF activity, since IGF-1 or IGF-2 are not limiting in the myeloma milieu in vivo: i) myeloma cells themselves and the tumor environment, in particular osteoclasts, produce IGF-1 31.ii) IGF-1 and IGF-2 circulate at high levels (20–90 nM, i.e. 150–700 ng/ml), bound to IGF-binding proteins, mainly in the form of an IGF/IGFBP-3/acid labile subunit trimer. The availability of circulating IGF to tissue involves a close regulation of IGFBP as demonstrated in several models 26. The second consequence is to confer MGF activity to physiological concentrations of insulin. Contrary to IGF-1, no circulating insulin binding (inhibitory) molecules exist, making insulin more easily available for cell surface receptors. A direct role of insulin in cancer progression was shown in several studies. Obesity is associated with an increased risk of cancer, in particular of multiple myeloma, in humans 32. Plasma c-peptide levels, reflecting insulin secretion, are associated with prostate specific death in men 33. There is also a relationship between high-fasting insulin levels and risk of relapse in breast cancers 34. It would be of interest to investigate a possible link between hyperinsulinemia-related markers and clinical and survival outcome in patients with MM. In particular, as increased risk for MM is found in patients with type II diabetes 35 as that was found for risk of overall cancers 36.
The current observation that insulin is a potent myeloma cell growth factor, signaling through hybrid-Rs, is of importance in several ways: i) for the development of therapies targeting the IGF axis in patients with MM. Here, it will be needed to be taken into account that the anti-IGF-1R inhibitors block the hybrid receptor activated by both IGF-1, IGF-2 and insulin as well; ii) treatments blocking noctural glyconeogenesis (i.e. reducing hyperinsulinemia) or metabolic activation as metformin, which have been shown to be of interest in cancer 1, might be an additional treatment option in myeloma as well; iii) in patients with Multiple Myeloma and type II diabetes, compounds further increasing the insulin level, e.g. sulfonylurea derivatives like Glibenclamid, might be warranted to be avoided where possible.
Supplementary Material
Acknowledgments
This work was supported by grants from the Ligue Nationale Contre le Cancer (équipe labellisée), Paris, France, from INCA (n°R07001FN) and from MSCNET European strep (N°E06005FF), the Hopp-Foundation, Germany, the University of Heidelberg, Germany, the National Centre for Tumor Diseases, Heidelberg, Germany, the Tumorzentrum Heidelberg/Mannheim, Germany. AC Sprynski is supported by Association Guillaume Espoir, St Genis Laval, France.
Footnotes
Conflict of interest
The authors declare no conflict of interest.
Author contributions:
ACS designed research, performed the experiments and wrote the paper. DH, LV, JFR and HG collected bone marrow samples and clinical data. AK and MJ participated in the analyzing of the data. DH contributed in the gene expression profiling. DH and HG participated in the analsis of the data and the writing of the paper. BK is the senior investigator who designed research and wrote the paper.
Supplementary Information accompanies the paper on the Leukemia website (http://www.nature.com/leu)
References
- 1.Pollak M. Insulin and insulin-like growth factor signalling in neoplasia. Nat Rev Cancer. 2008 Dec;8(12):915–928. doi: 10.1038/nrc2536. [DOI] [PubMed] [Google Scholar]
- 2.Freund GG, Kulas DT, Mooney RA. Insulin and IGF-1 Increase Mitogenesis and Glucose Metabolism in the Multiple Myeloma Cell Line, RPMI-8226. JImmunol. 1993;151:1811–1820. [PubMed] [Google Scholar]
- 3.De Vos J, Hose D, Reme T, Moreaux J, Mahtouk K, Jourdan M, et al. Microarray-based understanding of normal and malignant plasma cells. Immunological Reviews. 2006 doi: 10.1111/j.0105-2896.2006.00362.x. In press. [DOI] [PMC free article] [PubMed] [Google Scholar]
- 4.Sprynski AC, Hose D, Caillot L, Reme T, Shaughnessy JD, Jr, Barlogie B, et al. The role of IGF-1 as a major growth factor for myeloma cell lines and the prognostic relevance of the expression of its receptor. Blood. 2009 May 7;113(19):4614–4626. doi: 10.1182/blood-2008-07-170464. [DOI] [PMC free article] [PubMed] [Google Scholar]
- 5.Bataille R, Robillard N, Avet-Loiseau H, Harousseau JL, Moreau P. CD221 (IGF-1R) is aberrantly expressed in multiple myeloma, in relation to disease severity. Haematologica. 2005 May;90(5):706–707. [PubMed] [Google Scholar]
- 6.Chng WJ, Gualberto A, Fonseca R. IGF-1R is overexpressed in poorprognostic subtypes of multiple myeloma. Leukemia. 2006 Jan;20(1):174–176. doi: 10.1038/sj.leu.2403997. [DOI] [PubMed] [Google Scholar]
- 7.De Meyts P, Whittaker J. Structural biology of insulin and IGF1 receptors: implications for drug design. Nat Rev Drug Discov. 2002 Oct;1(10):769–783. doi: 10.1038/nrd917. [DOI] [PubMed] [Google Scholar]
- 8.Pandini G, Frasca F, Mineo R, Sciacca L, Vigneri R, Belfiore A. Insulin/insulinlike growth factor I hybrid receptors have different biological characteristics depending on the insulin receptor isoform involved. J Biol Chem. 2002 Oct 18;277(42):39684–39695. doi: 10.1074/jbc.M202766200. [DOI] [PubMed] [Google Scholar]
- 9.Slaaby R, Schaffer L, Lautrup-Larsen I, Andersen AS, Shaw AC, Mathiasen IS, et al. Hybrid receptors formed by insulin receptor (IR) and insulin-like growth factor I receptor (IGF-IR) have low insulin and high IGF-1 affinity irrespective of the IR splice variant. J Biol Chem. 2006 Sep 8;281(36):25869–25874. doi: 10.1074/jbc.M605189200. [DOI] [PubMed] [Google Scholar]
- 10.Zhang XG, Gaillard JP, Robillard N, Lu ZY, Gu ZJ, Jourdan M, et al. Reproducible obtaining of human myeloma cell lines as a model for tumor stem cell study in human multiple myeloma. Blood. 1994;83:3654–3663. [PubMed] [Google Scholar]
- 11.Jourdan M, Caraux A, De Vos J, Fiol G, Larroque M, Cognot C, et al. An in vitro model of differentiation of memory B cells into plasmablasts and plasma cells including detailed phenotypic and molecular characterization. Blood. 2009 Dec 10;114(25):5173–5181. doi: 10.1182/blood-2009-07-235960. [DOI] [PMC free article] [PubMed] [Google Scholar]
- 12.Mahtouk K, Jourdan M, De Vos J, Hertogh C, Fiol G, Jourdan E, et al. An inhibitor of the EGF receptor family blocks myeloma cell growth factor activity of HB-EGF and potentiates dexamethasone or anti-IL-6 antibody-induced apoptosis. Blood. 2004;103(5):1829–1837. doi: 10.1182/blood-2003-05-1510. [DOI] [PMC free article] [PubMed] [Google Scholar]
- 13.Wijdenes J, Clement C, Klein B, Morel-Fourrier B, VIta N, Ferrara P, et al. Human recombinant dimeric IL-6 binds to its receptor as detected by anti-IL-6 monoclonal antibodies. MolImmunol. 1991;28:1183. doi: 10.1016/0161-5890(91)90004-4. [DOI] [PubMed] [Google Scholar]
- 14.Garcia-Echeverria C, Pearson MA, Marti A, Meyer T, Mestan J, Zimmermann J, et al. In vivo antitumor activity of NVP-AEW541-A novel, potent, and selective inhibitor of the IGF-IR kinase. Cancer Cell. 2004 Mar;5(3):231–239. doi: 10.1016/s1535-6108(04)00051-0. [DOI] [PubMed] [Google Scholar]
- 15.Johansson GS, Arnqvist HJ. Insulin and IGF-I action on insulin receptors, IGFI receptors, and hybrid insulin/IGF-I receptors in vascular smooth muscle cells. Am J Physiol Endocrinol Metab. 2006 Nov;291(5):E1124–1130. doi: 10.1152/ajpendo.00565.2005. [DOI] [PubMed] [Google Scholar]
- 16.Mahtouk K, Hose D, Reme T, De Vos J, Jourdan M, Moreaux J, et al. Expression of EGF-family receptors and amphiregulin in multiple myeloma. Amphiregulin is a growth factor for myeloma cells. Oncogene. 2005 May 12;24(21):3512–3524. doi: 10.1038/sj.onc.1208536. [DOI] [PMC free article] [PubMed] [Google Scholar]
- 17.Michel J, Martine F, Eric L, Mira H, Janny L, Jean FranÇois R, et al. The myeloma cell antigen syndecan-1 is lost by apoptotic myeloma cells. British Journal of Haematology. 1998;100(4):637–646. doi: 10.1046/j.1365-2141.1998.00623.x. [DOI] [PubMed] [Google Scholar]
- 18.Reme T, Hose D, De Vos J, Vassal A, Poulain PO, Pantesco V, et al. A new method for class prediction based on signed-rank algorithms applied to Affymetrix microarray experiments. BMC Bioinformatics. 2008;9:16. doi: 10.1186/1471-2105-9-16. [DOI] [PMC free article] [PubMed] [Google Scholar]
- 19.Assou S, Le Carrour T, Tondeur S, Strom S, Gabelle A, Marty S, et al. A metaanalysis of human embryonic stem cells transcriptome integrated into a webbased expression atlas. Stem Cells. 2007 Apr;25(4):961–973. doi: 10.1634/stemcells.2006-0352. [DOI] [PMC free article] [PubMed] [Google Scholar]
- 20.Keats JJ, Fonseca R, Chesi M, Schop R, Baker A, Chng WJ, et al. Promiscuous mutations activate the noncanonical NF-kappaB pathway in multiple myeloma. Cancer Cell. 2007 Aug;12(2):131–144. doi: 10.1016/j.ccr.2007.07.003. [DOI] [PMC free article] [PubMed] [Google Scholar]
- 21.Annunziata CM, Davis RE, Demchenko Y, Bellamy W, Gabrea A, Zhan F, et al. Frequent engagement of the classical and alternative NF-kappaB pathways by diverse genetic abnormalities in multiple myeloma. Cancer Cell. 2007 Aug;12(2):115–130. doi: 10.1016/j.ccr.2007.07.004. [DOI] [PMC free article] [PubMed] [Google Scholar]
- 22.Demchenko YN, Glebov OK, Zingone A, Keats JJ, Bergsagel PL, Kuehl WM. Classical and/or alternative NF-{kappa}B pathway activation in multiple myeloma. Blood. 2010 Apr 29;115(17):3541–3552. doi: 10.1182/blood-2009-09-243535. [DOI] [PMC free article] [PubMed] [Google Scholar]
- 23.Dib A, Gabrea A, Glebov OK, Bergsagel PL, Kuehl WM. Characterization of MYC translocations in multiple myeloma cell lines. J Natl Cancer Inst Monogr. 2008;(39):25–31. doi: 10.1093/jncimonographs/lgn011. [DOI] [PMC free article] [PubMed] [Google Scholar]
- 24.Hyun T, Yam A, Pece S, Xie X, Zhang J, Miki T, et al. Loss of PTEN expression leading to high Akt activation in human multiple myelomas. Blood. 2000 Nov 15;96(10):3560–3568. [PubMed] [Google Scholar]
- 25.Denley A, Wallace JC, Cosgrove LJ, Forbes BE. The insulin receptor isoform exon 11- (IR-A) in cancer and other diseases: a review. Horm Metab Res. 2003 Nov-Dec;35(11–12):778–785. doi: 10.1055/s-2004-814157. [DOI] [PubMed] [Google Scholar]
- 26.Denley A, Cosgrove LJ, Booker GW, Wallace JC, Forbes BE. Molecular interactions of the IGF system. Cytokine Growth Factor Rev. 2005 Aug-Oct;16(4–5):421–439. doi: 10.1016/j.cytogfr.2005.04.004. [DOI] [PubMed] [Google Scholar]
- 27.Pandini G, Vigneri R, Costantino A, Frasca F, Ippolito A, Fujita-Yamaguchi Y, et al. Insulin and insulin-like growth factor-I (IGF-I) receptor overexpression in breast cancers leads to insulin/IGF-I hybrid receptor overexpression: evidence for a second mechanism of IGF-I signaling. Clin Cancer Res. 1999 Jul;5(7):1935–1944. [PubMed] [Google Scholar]
- 28.Pandini G, Wurch T, Akla B, Corvaia N, Belfiore A, Goetsch L. Functional responses and in vivo anti-tumour activity of h7C10: a humanised monoclonal antibody with neutralising activity against the insulin-like growth factor-1 (IGF- 1) receptor and insulin/IGF-1 hybrid receptors. Eur J Cancer. 2007 May;43(8):1318–1327. doi: 10.1016/j.ejca.2007.03.009. [DOI] [PubMed] [Google Scholar]
- 29.Bret C, Hose D, Reme T, Sprynski AC, Mahtouk K, Schved JF, et al. Expression of genes encoding for proteins involved in heparan sulphate and chondroitin sulphate chain synthesis and modification in normal and malignant plasma cells. Br J Haematol. 2009 May;145(3):350–368. doi: 10.1111/j.1365-2141.2009.07633.x. [DOI] [PMC free article] [PubMed] [Google Scholar]
- 30.Taniguchi CM, Emanuelli B, Kahn CR. Critical nodes in signalling pathways: insights into insulin action. Nat Rev Mol Cell Biol. 2006 Feb;7(2):85–96. doi: 10.1038/nrm1837. [DOI] [PubMed] [Google Scholar]
- 31.Moreaux J, Hose D, Reme T, Moine P, Mahtouk K, Moos M, et al. Osteoclast Gene Expression Profiling in Multiple Myeloma. Blood. 2008 Nov;112(11):945–945. [Google Scholar]
- 32.Calle EE, Rodriguez C, Walker-Thurmond K, Thun MJ. Overweight, obesity, and mortality from cancer in a prospectively studied cohort of U.S. adults. N Engl J Med. 2003 Apr 24;348(17):1625–1638. doi: 10.1056/NEJMoa021423. [DOI] [PubMed] [Google Scholar]
- 33.Ma J, Li H, Giovannucci E, Mucci L, Qiu W, Nguyen PL, et al. Prediagnostic body-mass index, plasma C-peptide concentration, and prostate cancerspecific mortality in men with prostate cancer: a long-term survival analysis. Lancet Oncol. 2008 Nov;9(11):1039–1047. doi: 10.1016/S1470-2045(08)70235-3. [DOI] [PMC free article] [PubMed] [Google Scholar]
- 34.Goodwin PJ, Ennis M, Pritchard KI, Trudeau ME, Koo J, Madarnas Y, et al. Fasting insulin and outcome in early-stage breast cancer: results of a prospective cohort study. J Clin Oncol. 2002 Jan 1;20(1):42–51. doi: 10.1200/JCO.2002.20.1.42. [DOI] [PubMed] [Google Scholar]
- 35.Fortuny J, Benavente Y, Bosch R, Garcia-Villanueva M, de Sevilla AF, de Sanjose S. Type 2 diabetes mellitus, its treatment and risk for lymphoma. Eur J Cancer. 2005 Aug;41(12):1782–1787. doi: 10.1016/j.ejca.2005.04.032. [DOI] [PubMed] [Google Scholar]
- 36.Bowker SL, Majumdar SR, Veugelers P, Johnson JA. Increased cancerrelated mortality for patients with type 2 diabetes who use sulfonylureas or insulin. Diabetes Care. 2006 Feb;29(2):254–258. doi: 10.2337/diacare.29.02.06.dc05-1558. [DOI] [PubMed] [Google Scholar]
Associated Data
This section collects any data citations, data availability statements, or supplementary materials included in this article.