


Abstract
The multi-subunit DNA-dependent protein kinase (DNA-PK), a crucial player in DNA repair by non-homologous end-joining in higher eukaryotes, consists of a catalytic subunit (DNA-PKcs) and the Ku heterodimer. Ku recruits DNA-PKcs to double-strand breaks, where DNA-PK assembles prior to DNA repair. The interaction of DNA-PK with DNA is regulated via autophosphorylation. Recent SAXS data addressed the conformational changes occurring in the purified catalytic subunit upon autophosphorylation. Here, we present the first structural analysis of the effects of autophosphorylation on the trimeric DNA-PK enzyme, performed by electron microscopy and single particle analysis. We observe a considerable degree of heterogeneity in the autophosphorylated material, which we resolved into subpopulations of intact complex, and separate DNA-PKcs and Ku, by using multivariate statistical analysis and multi-reference alignment on a partitioned particle image data set. The proportion of dimeric oligomers was reduced compared to non-phosphorylated complex, and those dimers remaining showed a substantial variation in mutual monomer orientation. Together, our data indicate a substantial remodelling of DNA-PK holo-enzyme upon autophosphorylation, which is crucial to the release of protein factors from a repaired DNA double-strand break.
INTRODUCTION
Double-strand breaks (DSBs) caused by ionizing radiation, radiomimetic anti-cancer drugs or stalling of the replication fork at a single-strand break or other lesion, are the most lethal form of DNA damage (1). In eukaryotes, two different DSB repair pathways exist: homologous recombination (2) and non-homologous end-joining (NHEJ) (3). NHEJ involves the direct joining of the generated ends after the DSB using no template, and is predominantly active in G0 and G1 phases of the cell cycle. One of the first protein complexes recruited to DSBs in the NHEJ process is the heterotrimeric enzyme DNA-dependent protein kinase (DNA-PK), composed of a catalytic subunit (DNA-PKcs) and the Ku heterodimer (4,5). DNA-PKcs is a ∼470 kDa single-polypeptide chain belonging to the protein family of PI3-related protein kinases (PIKKs), which include ATM, ATR, mTOR, TRRAP and SMG-1 (6). Ku consists of the Ku70 and Ku80 subunits, present in the cell as a pre-assembled heterodimer (7,8). The function of Ku within NHEJ is the recognition of a broken DNA end and the recruitment of DNA-PKcs via the Ku80 C-terminal domain (7). DNA-PK heterotrimers assembled at DNA ends make a further homo-dimeric interaction that brings two broken DNA ends into close proximity (9) and acts as a scaffold for further NHEJ factors such as XRCC4-DNA LigaseIV, Artemis, XLF and aprataxin (3). At a later stage in the NHEJ process, this molecular machinery must be disassembled and released from the re-ligated DNA (Figure 1A).
Figure 1.

Effect of autophosphorylation on DNA-PK. (A) A schematic diagram of NHEJ. Ionizing Radiation induces a DSB Step (1). The DSB is detected and bound by the Ku70/80 heterodimer (pink, Step 2). Once bound to the DSB, the Ku80 C-terminal domain recruits DNA-PKcs (blue). Ku translocates inward and positions DNA-PKcs at the extremity of the DSB (Step 3). The DNA ends are processed by one or more possible enzymes that include Artemis (brown), Polynucleotide kinase (PNK, orange), XRCC4 (green), XLF (purple) and LigaseIV (grey) (Step 4). DNA-PKcs undergoes autophosphorylation (indicated by arrows), resulting in the release of autophosphorylated DNA-PKcs from DNA (Step 5). In the final step (Step 6), the XRCC4/DNA ligase IV complex ligates the DNA ends in a reaction that is stimulated by XLF. (B) (1) Silver stained SDS-PAGE gel of autophosphorylated DNA-PK complex, (2) autoradiograph showing autophosphorylation of DNA-PK. The dephosphorylated sample was incubated for 1 h at 37°C in the presence of 10 µM ATP and 0.1 µCi of [γ-32P]ATP in a final volume of 20 µl. Radioactive products were separated on SDS–PAGE on a NuPAGE 4–12% gel and visualized by autoradiography. (C) Electron micrograph of negatively stained dephosphorylated DNA-PK. (D) Electron micrograph of negatively-stained autophosphorylated sample. Dimers are boxed in rectangles, large monomers in squares and small monomers in circles. Scale bar = 200 Å.
Autophosphorylation of DNA-PK is a key event in the dissociation of DNA-PK from DNA (10–23). A recent report suggests that up to 30 autophosphorylation sites exist within DNA-PKcs (23). Two major autophosphorylation clusters have been identified in DNA-PKcs up to now. The ABCDE cluster contains phosphorylation sites at serines 2612 and 2624 and threonines 2609, 2620, 2638 and 2647 (11), and the PQR cluster contains phosphorylation sites at serines 2023, 2029, 2041, 2053 and 2056 (15). It has been suggested that the structural plasticity of DNA-PK is highly affected by autophosphorylation at those two clusters (12,15). The ABCDE and PQR sites were shown to regulate DNA end processing and DNA repair pathway choice in a reciprocal manner, since blocking phosphorylation at the first one inhibits both end processing and homologous recombination, while blocking phosphorylation at the second cluster enhances them (16). A further autophosphorylation site was also identified at Thr 3950, within the kinase domain. Phosphorylation of this site regulates the kinase activity of DNA-PKcs (22). Biochemical studies on the mechanism of DNA-PK autophosphorylation showed that it occurs in trans both in vitro and in vivo (19).
The structural studies of DNA-PKcs are particularly challenging due to its large size (∼0.5 MDa) and poor recombinant protein production hence requiring complex purification regimes from natural sources. Electron crystallography and single particle analysis initially revealed the structure of DNA-PKcs at intermediate resolution (24–26), defining the general architecture of DNA-PKcs into three main regions, namely a head, a palm and a connecting arm. Higher resolution cryo-electron microscopy (cryo-EM) studies aimed at localizing the specific domains that constitute each of the previously defined regions (27,28). In our cryo–EM study, we integrated different approaches and proposed a model that explained the global architecture of DNA-PKcs and localized the kinase domain in the head region (27). Recently, DNA-PKcs has been crystallized and its structure highlights the overall topology mainly composed of Huntingtin-Elongation-A-subunit-TOR (HEAT) repeats (29), unequivocally confirming our previous assignment of the catalytic domain to the head region. Interestingly, DNA-PKcs forms adequately diffracting crystals only upon co-crystallization with a C-terminal region of the Ku80 subunit (29). We have previously determined the negatively stained structures of the full-length Ku heterodimer, DNA-PKcs and of DNA-PKcs/Ku70/Ku80 assembled on DNA in the dephosphorylared state, by electron microscopy and single particle analysis (9,26,30,31). With these structures, together with the 13 Å cryo–EM structure of DNA-PKcs (27), we provided a structural view of the assembly of the NHEJ complex in the early phases of this repair pathway. Importantly, the study of dephosphorylated DNA-PK has highlighted the formation of synaptic dimers, which are likely to be responsible for keeping the DNA broken ends in close proximity. The orientation of the DNA-PK monomers in these dimers seems difficult to reconcile with their internal autophosphorylation since the kinase domains are facing outwards (9). The existence of dimers in this conformation upon incubation with the DNA has been confirmed by SAXS (23), but more importantly DNA-PKcs co-crystallized with the Ku80 C-terminal domain, so that each asymmetric unit contains two molecules related by a 2-fold non-crystallographic symmetry in a similar orientation to that described from the electron microscopy of negatively stained DNA-PK samples (9,29).
In recent SAXS analyses, John Tainer et al. (23,32) observed that autophosphorylation of DNA-PKcs induced significant conformational changes that were postulated to function as a DNA release mechanism. One of the SAXS studies (23) also addressed the conformational changes of the DNA-PK holo-enzyme upon recognition of two different DNA substrates, one of which mimicks NHEJ substrates as we analysed previously (9), while the other (hairpin DNA) is more reminiscent of a V(D)J recombination environment.
Here, we address the question of how autophosphorylation affects DNA-PK complexes, assembled on DNA ends mimicking NHEJ substrates, and how structural rearrangements are involved in the modulation of the NHEJ apparatus and its release from a DSB. This work was carried out by comparative analysis of autophosphorylated and dephosphorylated DNA-PK using negative staining electron microscopy and single particle analysis. We visualized substantial conformational rearrangements associated with autophosphorylation of the DNA-PK holo-enzyme, which may represent snapshots along the NHEJ pathway.
MATERIALS AND METHODS
Sample preparation
The DNA-PK complex loaded on DNA was purified as previously described (9), from HeLa nuclear extracts purchased from CilBiotech, Belgium. DNA oligonucleotides were purchased from IBA GmbH, Goettingen, Germany. The sequences of the oligos (with the duplex segments in uppercase) were:
1 5′-CGCGCCCagctttcccagctAATAAACTAAAAACTATTATTATGGCCGCACGCGT-3′;
2 5′-ACGCGTGCGGCCATAATAATAGTTTTTAGTTTATTGGGCGCG-3′.
Sample collection from the glycerol gradient was followed by 1 h incubation with 1 mM adenosine Triphosphate (ATP) and 1 mM MgCl2. The sample was then loaded on a second glycerol gradient (20 mM Hepes pH 7.5, 200 mM NaCl, 1 mM ATP, 1 mM MgCl2, 20–60% glycerol) and centrifuged at 257 000 rpm in Beckman SW28i tubes. Fractions were collected from the bottom and analysed by western blot. The DNA-PKcs, Ku70 and Ku80 proteins were found to co-migrate in the same peak.
Electron microscopy
In both the dephosphorylated and autophosphorylated samples, 4 µl of protein were applied to carbon-coated grids and negatively stained with 1% uranyl acetate. Micrographs were recorded in a JEOL 1230 electron microscope operating at 100 kV, at a magnification of 50 000×, under low-dose conditions. Images were digitized with a MINOLTA Dimage Scan Multi Pro scanner at 2400 dpi and averaged to a final 2.2 Å/pixel at the specimen level.
Data processing
Particle images were selected interactively using the Boxer program from the EMAN single particle analysis package and extracted into boxes (33). Image processing was performed using the IMAGIC-5 package (34). Unless specified otherwise, the data set was re-sampled at 4.4 Å/pixel. The images were band-pass filtered with a high-pass cut-off of 110 Å and a low-pass cut-off of 18 Å. The data set was subjected to classification and the resulting eigenimages were analysed by visual inspection. Details of the classification protocol are described in the ‘Results’ section. The analysis of small monomeric particles (Group 1) was done in images extracted from the non-coarsened data set (images sampled at 2.2 Å/pixel) to improve the alignment procedures.
RESULTS
Characterization of autophosphorylated DNA-PK
DNA-PKcs/Ku70/Ku80 assembled on DNA was prepared as previously described, following a protocol involving incubation with λ-phosphatase (9). We used our knowledge of the DNA co-crystallized with the Ku heterodimer (8) and the DNA length which can be accommodated in the DNA-PKcs cavity (26), to design a DNA structure long enough to bind the full DNA-PK heterotrimer, but with a blocked end to prevent migration along the DNA and no protruding duplex DNA to avoid loading of multiple Ku heterodimers. Following incubation with 1 mM ATP and MgCl2, the sample was subjected to glycerol gradient centrifugation with excess ATP and MgCl2 always present in the buffer. Fractions were collected and analysed by SDS–PAGE and western blotting. The DNA-PKcs, Ku70 and Ku80 proteins were found to co-migrate in the same peak (Figure 1B). It is worth noting that DNA-PK in monomeric and dimeric form co–migrate even in the dephosphorylated sample (9).
Parallel experiments on the autophosphorylation activity of the purified dephosphorylated DNA-PK were carried out following the incorporation of radioactively labelled ATP (Figure 1B). These experiments clearly showed incorporation of [γ-32P] into the DNA-PKcs, together with a weak signal indicating that some phosphorylation of Ku70 may have also occurred.
Observation of dephosphorylated and autophosphorylated DNA-PK samples by electron microscopy
Autophosphorylated DNA-PK collected from glycerol gradients was observed by negative stain electron microscopy, in the same conditions as previously used for the dephosphorylated complex (9), in order to visualize any conformational changes occurring in the complex upon autophosphorylation. Visual inspection of the negatively stained fully dephosphorylated sample (Figure 1C) shows a relatively homogeneous sample consisting primarily of monomeric particles, but with some dimeric oligomers also present, as previously described (9). In contrast, the negatively stained autophosphorylated sample (Figure 1D) appeared more heterogeneous with a range of sizes and apparent oligomeric assemblies. Heterogeneity in appearance of electron microscope images such as these, where the biochemical composition is known (Figure 1A), can arise from genuine heterogeneity in the sample due to large conformational rearrangements, disassembly or aggregation of the complexes. Alternatively, apparent heterogeneity may simply represent variations in orientation of the molecules of a homogenous sample. In order to investigate the nature of the observed heterogeneity, we have used image analysis procedures to classify and average molecular images so that they could be compared with existing data from dephosphorylated DNA-PK.
Characterization of sample heterogeneity by classification
Particle images from the autophosphorylated DNA-PK sample were manually selected from the micrographs. The selected particles were characterized by a broad range of size and apparent oligomeric assemblies, as judged by comparison with our previous work (9,26,27,31). 12 126 particles were collected into one data set. Care was taken to centre the particles as much as possible during selection. Further centring procedures were not used since they did not generate good results, particularly in the analysis of dimeric assemblies, where there was a tendency for the particles to be translated so that they were centred on one of the monomers.
The single particle images were subjected to Principal Component Analysis (35) using the Multivariate Statistical Analysis (MSA) program in Imagic-5 (34). In this procedure, each image is considered as a point in a multi-dimensional space defined by the density of each component pixel. Eigenimage–eigenvector data compression allows this cloud of image points to be described by a new coordinate system defined by a chosen number of eigenvectors. Each of the resulting eigenimages represents major variability within the density distribution of the original images. This is used to group similar images into a selected number of classes, which can be averaged to produce image class averages with enhanced signal/noise ratio. In the present analysis, we designed a classification protocol initially based on the work of Orlova et al. (36). The data set was initially analysed using 69 eigenvectors (Figure 2A). The presence of a dark concentric ring in the second eigenimage of lower radius than the total image sum (Eigenimage 1) is diagnostic of particle image heterogeneity relative to size, due to variations of radial density distributions (36). Furthermore, eigenimages Numbers 3 and 4 indicated 2-fold symmetry in some of the particles in the data set. These observations were used to partition the data set into smaller, more homogeneous subsets based on particle size and oligomeric state using a smaller number of eigenvectors as described next.
Figure 2.

Initial classification of autophosphorylated DNA-PK. (A) First 10 eigenimages of the autophosphorylated data set. The first four eigenimages, on which subsequent classification is based, are highlighted in a white dashed box. Small images were extracted from the class averages labelled with a white star, medium particles from the class averages labelled with a white circle, dimeric images from the class averages labelled with a white oval. (B) Classification based on the first four eigenimages showed both size variations and variations due to different oligomeric states (monomer/dimer). The eigenimages with approximate 3-fold symmetry probably arise from views in which the head, palm and arm domains of DNA-PKcs are arranged so as produce a pronounced 3-fold modulation around a central axis. (C) First 10 eigenimages of the dephosphorylated data set. The first three eigenimages, on which subsequent classification is based, are highlighted in a white dashed box. (D) Classification of the dephosphorylated particles based on the first three eigenimages showed variations due to different oligomeric states (monomer/dimer). (E) First 10 eigenimages of the combined data set. The first four eigenimages, on which subsequent classification is based, are highlighted in a white dashed box. (F) Classification of the combined data set based on the first four eigenimages showed both size variations and variations due to different oligomeric states. Box size = 560 Å.
Image partition into three subsets
We sampled the classification of our data set of images from autophosphorylated DNA-PK complex based on different combinations of eigenimages and calculating different numbers of class averages. The classification that was visually judged most effective in separating the data set into distinct subpopulations was that where 10 classes were calculated using 4 eigenimages (Figure 2A and B). This classification procedure resulted in image class averages where the particles show lengths of 100–160 Å (small, star-shaped box), 160–220 Å (medium, circular box) and 240 Å (large, oval box) (Figure 2B). This proved a more efficient and objective method than the visual partitioning of raw particles previously used in the analysis of dephosphorylated DNA-PK (9).
To assess the significance of these observations, a parallel analysis of dephosphorylated DNA-PK using the same approach was conducted. This gave rise to eigenimages (Figure 2C), which lacked the concentric ring typical of Eigenimage 2 of the autophosphorylated data set (Figure 2A) and to class averages (Figure 2D) with similar appearances to the medium and large classes of autophosphorylated DNA-PK (Figure 2B). Conversely, a second parallel analysis of a data set formed by merging the autophosphorylated and dephosphorylated images led to a set of eigenimages in which the concentric ring was again identified as the second eigenimage (Figure 2E). Class averages with similar appearances to the small, medium and large classes in Figure 2B were present in the 20 classes calculated for the combined data set (Figure 2F).
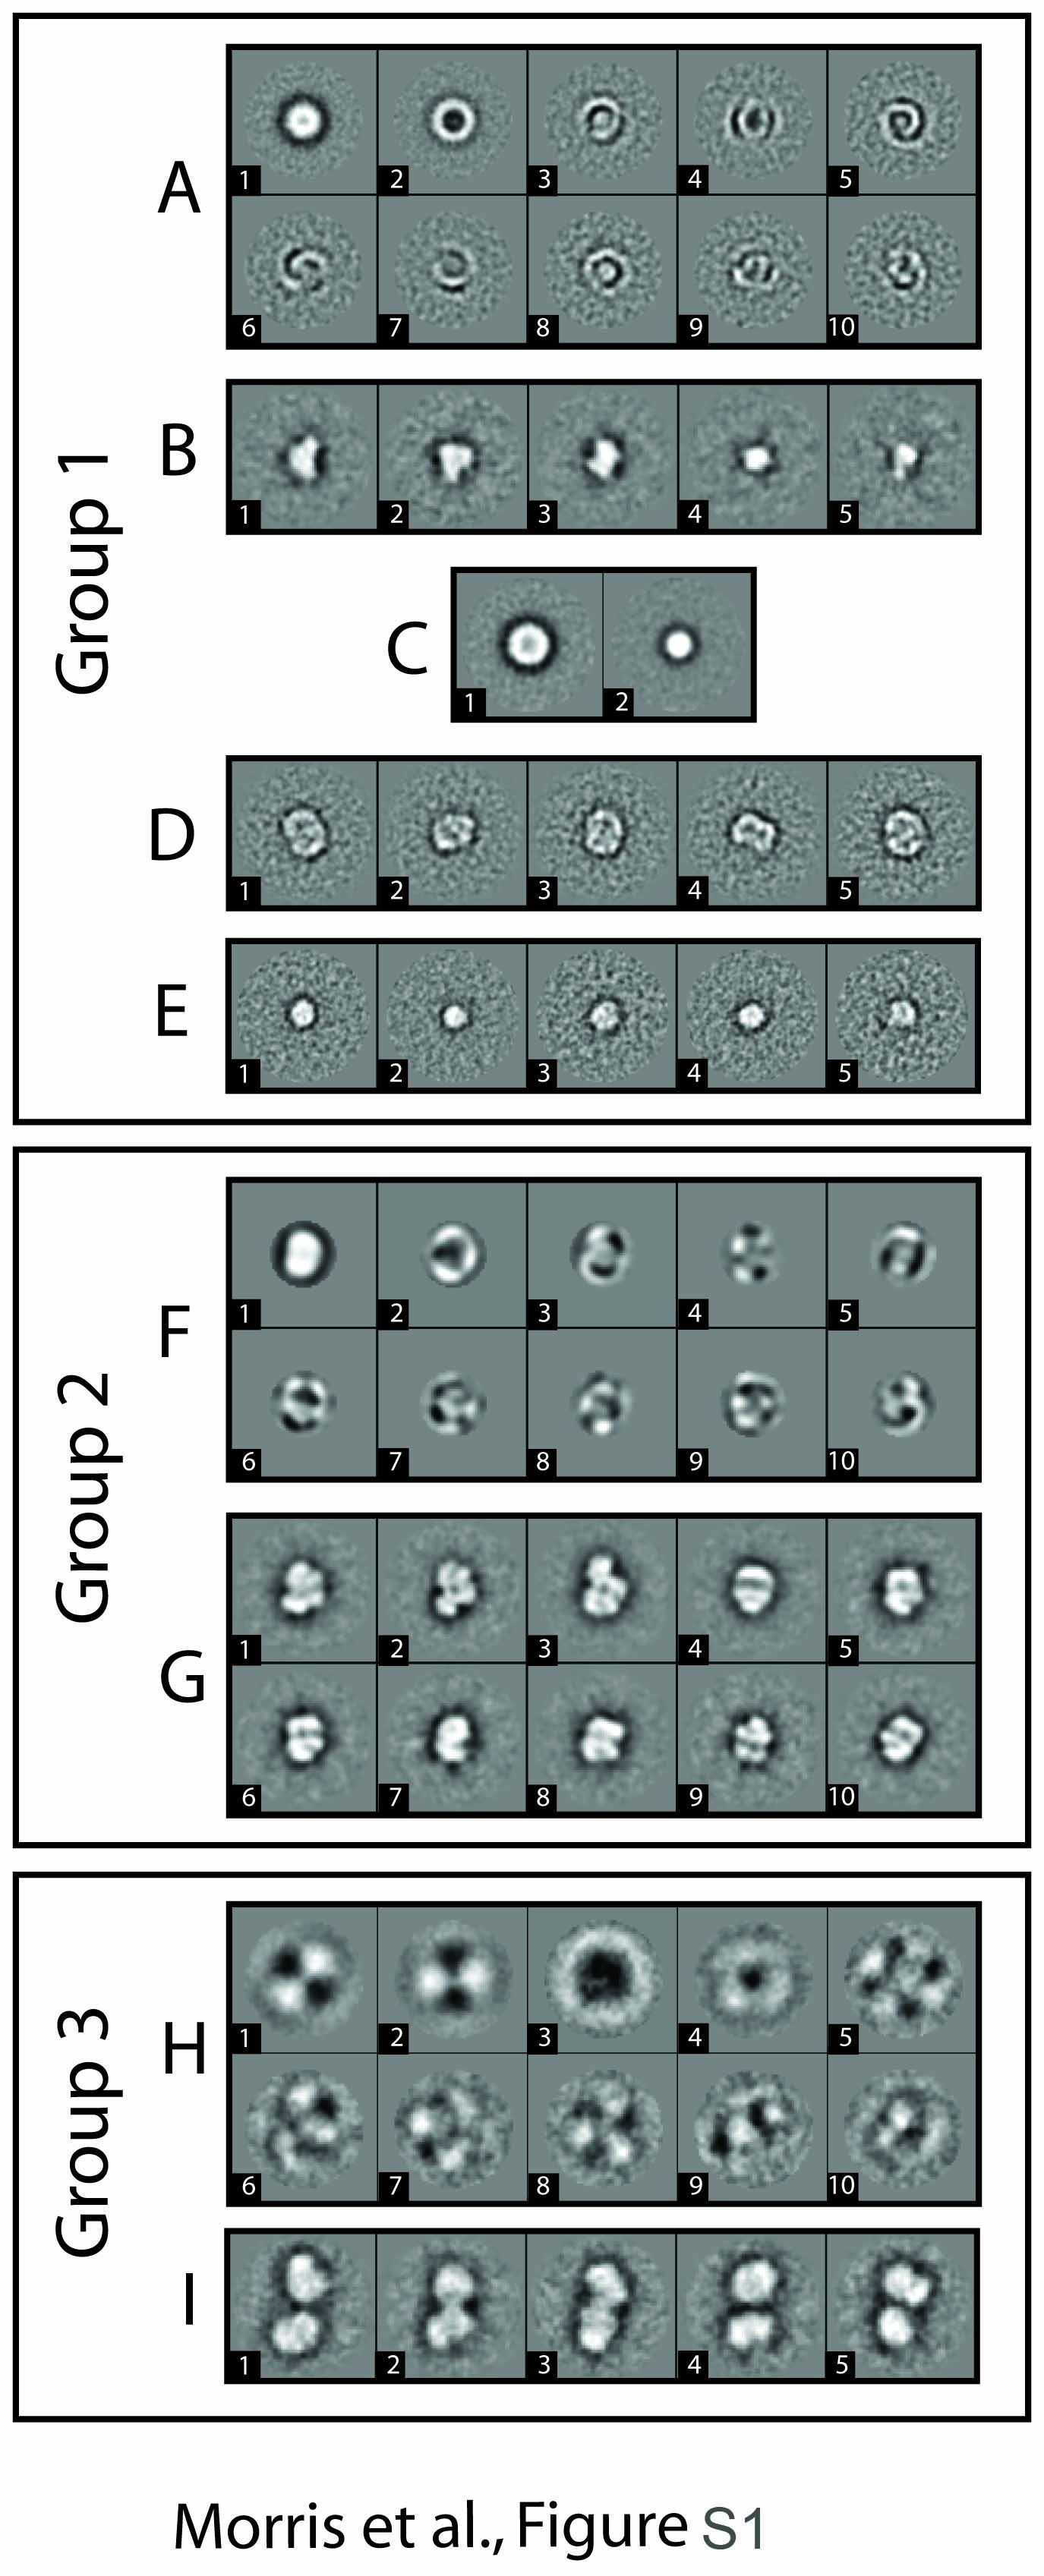
To further study the autophosphorylated data set, we partitioned it into three single particle subsets. These were assembled in this way: 2874 small particles belonging to class averages 2, 9 and 10 in Figure 2B (star-shaped box) were extracted from the data set to form Group 1. About 8431 medium-sized particles belonging to class averages 1, 5, 6 and 7 in Figure 2B (circled) were extracted to form Group 2. Eight hundred and twenty-one large particles belonging to class averages showing 2-fold modulation (class averages 3, 4, 8 in Figure 2B, oval box) were extracted to form Group 3. The three subsets were each independently analysed by several rounds of classification and multi-reference alignment. References for multi-reference alignment were selected from class averages of the previous classification. The results of this analysis are summarized in Figures 3 and Supplementary Figure S1, and in Table I. Eigenimages obtained for Group 1 were still diagnostic of size variations (Figure S1A) and classification did not produce detailed class averages (Figure S1B), which indicated that further partition was required. Therefore two classes were calculated based on eigenimages 1 and 2 (Supplementary Figure S1C). Images belonging to each class were separated to form Group 1A (1511 images) and Group 1B (1363 images) and were further analysed separately. A total of 15 classes were calculated from particles in Group 1A (Supplementary Figures S1D and 3A) and 20 from Group 1B (Supplementary Figure S1E). About 1000 final classes were calculated from particles in Group 2 (Figure 3C and E). Totally 50 final classes were calculated from particles in Group 3 (Figure 3I). The class averages obtained in this second round of classification satisfactorily represent the size/oligomeric assembly features of the classes into which they were grouped in the initial classification (small, medium and large). The classification of the subsets highlighted finer details in the class averages (Figure 3). Class averages from particles of Group 1A are monomers of length 80–100 Å (Supplementary Figures S1D and 3A). Class averages from particles of Group 1B have monomeric appearance and a length of 56–74 Å (Supplementary Figure S1E). Class averages from particles of Group 2 have monomeric appearance and a length of 166–50 Å (Figure 3C and E). Class averages from particles of Group 3 have dimeric appearance and a length of 320–396 Å (Figure 3I). This is generally consistent with the dimensions and oligomeric state of the 10 class averages in the first round of classification based on 4 eigenimages (Figure 2B).
Figure 3.

Summary of current interpretation of the DNA-PK system. (A) Ku70:80 views, current study. The feature of the bridge in the Ku dimer is highlighted with a white arrow. (B) Ku70:80 views (31). (C) DNA-PKcs views, current study. (D) DNA-PKcs views (26). (E) DNA-PK views, current study. (F) DNA-PK views (9). In E and F, the density relative to Ku in the DNA-PK complex is highlighted with a white arrow. (G) Dephosphorylated DNA-PK dimer views (9). (H) Dephosphorylated DNA-PK dimer views obtained by classification with a local mask on the upper subunit, current study. (I) Autophosphorylated DNA-PK dimer views. (J) Autophosphorylated DNA-PK dimer views obtained by classification with a local mask, current study. The white arrows point to the Ku density. Box size = 560 Å.
Table 1.
Numerical representation of the data sets partitioning
| Particles | Dephosphorylated | Autophosphorylated | Pooled data set |
|---|---|---|---|
| Small particlesa | 0 | 2874 (23.7%) | 2724 (14.1%) |
| Medium particlesb | 6325 (87.5%) | 8431 (69.2%) | 14 541 (75.1%) |
| Dimersc | 905 (12.5%) | 821 (6.8%) | 2091 (10.8%) |
| Total | 7230 (100%) | 12 126 (100%) | 19 356 (100%) |
Each data set is numerically represented in a row. Percentages are calculated on the total number of particles analysed in each data set.
aMixture of Ku and small, unidentified particles.
bIdentified as DNA-PK in the dephosphorylated sample, and as a mixed population of DNA-PKcs and DNA-PK in the autophosphorylated sample.
cIdentified as DNA-PK dimers.
Identification of particles in each data set
Our previous structural knowledge of the DNA-PK system allowed direct identification of the calculated class averages. This was extremely valuable in the assessment of the procedures and in the analysis of the classification results. In order to interpret the classes obtained from our classification procedures of the autophosphorylated DNA-PK sample, we compared the classes obtained with class averages calculated in previous studies of DNA-PK complexes (9,26,30,31) and with class averages obtained from our parallel analysis of dephosphorylated DNA-PK (Figures 3 and 4).
From visual comparison, we can conclude that class averages derived from Group 1A (Figure 3A) have appearances which correspond to those typical of the free Ku heterodimer [Figure 3B, (8,31)]. Their diameter measures 80–100 Å, and the class averages are consistent with projections of a structure with an almost symmetrical shape and are characterized by a prominent bridge across the Ku ring. The analysis of Group 1B (Supplementary Figure S1E) did not lead to very detailed class averages, probably because of the small size of the particles (56–74 Å). These dimensions are too small to be compatible with either the Ku dimer or DNA-PKcs, and at this stage of the analysis their identity is uncertain. It is unlikely that they are isolated subunits (Ku70 or Ku80) of the Ku heterodimer, since Ku exists as an obligate heterodimer in the cell. Even in recombinant production, it is prepared by co-infecting/co-expressing cells with DNA coding for both subunits or by using bicistronic vectors (8,37). We would therefore suggest that it is a small protein, which is co-purified with DNA-PK.
Class averages from the particles of Group 2 were identified as a mixture of free DNA-PKcs [Figure 3, panel C: current analysis, panel D: previous analyses (26,27)], and DNA-PK [Figure 3, panel E: current analysis; panel F: previous analysis (9)], where characteristic side views of the catalytic subunit are recognizable. The overall size variation between DNA-PKcs and DNA-PK complex was small but it allowed us to obtain interpretable class averages without further partitioning. In the class averages calculated from images in Group 2, the domain organization of the DNA-PKcs is clearly recognizable (26–28). The palm and arm domains within the N-terminal half of the protein are clearly defined, as is the head region, in which the location of the catalytic domain and the FRAP, ATM and TRRAP (FAT) and FAT-C-terminal (FATC) domains have been confirmed by crystallographic studies (29). These class averages have a radius between 88 and 100 Å. The class averages with an extra density adjacent to the palm domain of DNA-PKcs are easily interpreted as the assembled DNA-PK complex (9). These class averages have radius between 115 and 125 Å.
Dimeric particles similar to the putative synaptic dimers previously described (9) were recognizable in the subset of larger assemblies (Group 3, Figure 3I). In the previous analysis, dimeric particles were observed in which two DNA-PK holoenzymes interacted through the palm domains, corresponding to the N-terminal HEAT repeats of DNA-PKcs according to our modelling (31). The closeness of the dimer contacts to the likely positions of the DNA ends suggested that these correspond to synaptic complexes that keep broken DNA ends in proximity and supply a platform for access of the numerous enzymes required for DNA end processing and ligation. In the autophosphorylated sample, the dimeric images in Group 3 needed further analysis since it was hard to identify fine detail in the initial class averages (Figure 3I). To facilitate this, dimeric particles were aligned with their long axis vertical, and analysed by classification with a local mask centred on the densities of the upper DNA-PK complex (38). Next, 15 class averages were calculated. When applied to the dimeric particles from the fully dephosphorylated sample, both a mask around the two monomers (Figure 3G) and a local mask where one of the complexes was covered (Figure 3H), produced averages in which both the upper and lower complexes were quite well resolved. Nevertheless, it is apparent that the monomer, which is blanked off during classification, is less well-defined than the monomer, which is not blanked off. On the other hand, in the case of the dimer images from the autophosporylated sample the use of a local mask led to considerably enhanced blurring of the blanked off monomer (Figure 3J). Hence, our results suggest that there is some flexibility in the dephosphorylated dimer which is greatly accentuated upon autophosphorylation. The degree of blurring induced in the unmasked subunits of the autophosphorylated dimers suggests that phosphorylation may also induce some level of flexibility within the subunits.
Analysis of autophosphorylated, dephosphorylated and combined data sets
Analysis of the autophosphoryated DNA-PK data indicated the presence of a number of distinct molecular species, which correspond to previously identified DNA-PK complexes and subcomplexes. In order to verify that this is a particular property of autophosphorylated DNA-PK, the same procedures were used to analyse dephosphorylated DNA-PK particles both independently and as part of a merged data set containing both autophosphorylated and dephosphorylated DNA-PK. For the independent analysis of dephosphorylated DNA-PK, we initially performed an initial classification based on size variations using the first three eigenimages (Figure 2C) to produce 10 initial classes (Figure 2D). Further rounds of classification and multi-reference alignment as described above allowed the identification of two major partitions (summarized in Table 1), dimeric or large particles (12.5% of data) and medium-sized particles (87.5% of the data). Unlike the autophosphorylated DNA-PK, no small particles were observed in the dephosphorylated DNA-PK, since dephosphorylation favours the formation of the DNA-PK heterotrimer. The combined data set composed of both autophosphorylated and dephosphorylated DNA-PK was analysed using four eigenimages (Figure 2E) to produce 20 initial classes (Figure 2F) followed by rounds of classification and alignment. In the final class averages of the merged data set, small particles (14.1%), medium-sized particles (75.1%) and dimeric particles (10.8%) were identified. The relative abundance of the species identified in the dephosphosphorylated DNA-PK and merged data sets are compared with data from the autophosphorylated DNA-PKcs in Table 1. Here, it can be seen that autophosphorylation of DNA-PK is associated with an increase in the proportion of small particles and a decrease in the proportion of medium-sized particles and dimers. This is supported by results of the analysis of the merged data set in which intermediate values are observed for the proportion of small and medium-sized particles and dimers. Furthermore, if the two data sets are aligned against image class averages calculated from the merged data set and showing appearances typical of Ku, DNA-PKcs, DNA-PK and DNA-PK dimers, the same classes are obtained as described above, indicating that the absence of Ku and DNA-PK from the non-phosphorylated sample is not due to mis-alignment of the corresponding data set.
DISCUSSION
Autophosphorylation is a key event in the disassembly of DNA-PK from a repaired DSB and the regulation of the NHEJ repair pathway. This aspect of the functional modulation of DNA-PK has been extensively studied biochemically in the past (10–23). While a recent SAXS study analysed the structural consequence of autophosphorylation on the catalytic subunit of the DNA-PK enzyme purified from its DNA substrate (23), we focused on the effect of autophosphorylation on the DNA-PK complex loaded on DNA.
Single particle analysis of electron microscopy images can produce a wealth of biological information that goes beyond a static picture, since complex reaction mixtures can be analysed and interpreted. However, identifying and characterizing all the conformations and components within a single data set is technically very challenging. Here, we have applied classification and alignment procedures to characterize the heterogeneity of a DNA repair reaction mixture with known biochemical composition, and to sort out distinct species in the sample. Using this approach, we have been able to identify and characterize a number of key molecular species on the basis of their projection structures. It might be argued that further important details could be obtained from 3D analysis of the data. However, it is apparent that although we have selected over 12 000 particles from the autophosphorylated sample, it is very unlikely that these all derive from a single autophosphorylation state of the DNA-PKcs. DNA-PKcs has over 30 autophosphorylation sites (23), which can be modified in different combinations. This is likely to result in a multiplicity of conformations. A correct 3D analysis would require the recovery of individual 3D maps for each such conformation, and we therefore restricted ourselves to a 2D analysis. This allowed observing a number of interesting consequences of autophosphorylation.
Autophosphorylation generates heterogeneity
The previous studies of DNA-PKcs, Ku and dephosphorylated DNA-PK by single particle analysis dealt with samples characterized by compositional and conformational homogeneity (9,26,27,31). In the present study, the incubation of DNA-PK with ATP and MgCl2 led to incorporation of [γ-32P] in the DNA-PKcs and probably the Ku70 subunits. This gives rise to a heterogeneous population of single particles on the electron microscopy grids, as expected from previous biochemical studies (14). Visual inspection of the micrographs showed different appearances between the dephosphorylated and autophosphorylated samples (Figure 1B and C), although classification was required to clearly identify the constituent complexes. Importantly, because we have previously resolved the 3D structures of Ku, DNA-PKcs and DNA-PK, we can rule out that the different averages we now found could just arise from different orientations on the grid of the phosphorylated DNA-PK molecule. We can rather conclude that phosphorylation induces disassembly and conformational changes in the DNA-PK complex.
Partitioning a heterogeneous data set
We used classification and alignment procedures in order to identify the various types of complexes present in our preparation upon autophosphorylation. The procedure is described in the ‘Materials and Methods’ and ‘Results’ sections. This partition could in principle be done visually, but this would result in a tedious and very time-consuming procedure, which is difficult because of the high level of noise in individual single particles and the high level of heterogeneity of the sample. We found that in the DNA-PK autophosphorylated sample the heterogeneity lies on two different levels. The heterogeneity is first based on the oligomeric state and therefore a considerable variation in particle size (monomer–dimer). In this case, the partition would be feasible by visual inspection of raw particles, as in (9). The second degree of heterogeneity is based on a more subtle difference in size (large monomers–small monomers), which is more difficult to be identified ‘by eye’ at the single-image level.
Characterization of autophosphorylated DNA-PK by classification
In order to reveal all the information present in the three subsets of images, we classified each subgroup using a full set of 69 eigenimages. We interpreted our analysis by comparison of the projection images of the autophosphorylated DNA-PK sample with projections from the 3D reconstructions of the species calculated in previous studies (9,26,27,30,31). Moreover, we performed a quantitative comparison of the molecular species in the autophosphorylated and dephosphorylated samples.
Our results confirm that autophosphorylation is linked to the dissociation of the DNA-PK complex, as has been previously proposed (DNA-PK dimers, Figure 3I and J; DNA-PK, Figure 3E; DNA-PKcs, Figure 3C; and Ku70:80 heterodimers, Figure 3A). We also showed that in absence of other NHEJ factors, this process does not go to completion in vitro despite 1 mM ATP and MgCl2 being present in the sample all along the glycerol gradient. This would infer that the molecular species are characterized by different degrees of phosphorylation. Upon autophosphorylation, the number of dimers decreased to 6.8% from the 12.5% in the dephosphorylated sample (percentage calculated as the amount of dimers compared to the sum of DNA-PKcs + DNA-PK + DNA-PK dimers). This decrease in the proportion of dimers on autophosphorylation is likely to be related to their increased flexibility identified in Figure 3I and J.
Visualizing the plasticity of the autophosphorylated DNA-PK holo-enzyme
Biochemical studies have demonstrated that autophosphorylation of DNA-PK occurs in trans both in vitro and in vivo (19). The dimeric configuration of DNA-PK that we previously described (9), and that is also highlighted in SAXS studies of DNA-PK loaded on NHEJ-relevant substrate (23), is unlikely to be competent for intra-dimer autophosphorylation of its constituent DNA-PKcs components, as the kinase domains are facing outwards and cannot access the other monomer in that configuration (23,27,29). However, by using a local mask we were able to identify some flexibility in this complex. Such flexibility may be related to SAXS measurements (23) showing two possible orientations for DNA-PKcs molecules interacting to form a dimer depending on the type of DNA used in the incubation. Moreover, a flexible dimeric complex may be able to explore conformations compatible with intra-dimer autophosphorylation. Hence, the previously reconstructed synaptic complex formed by fully dephosphorylated DNA-PK is likely to represent a snapshot of an early state in a dynamic series of conformations and interactions that the DNA-PK-based NHEJ complex must pass through along the DNA–DSB repair pathway. Accordingly, upon autophosphorylation, the palm domain of DNA-PKcs does not always mediate the dimeric interaction, since the orientation of this component of the complex relative to the dimeric assembly changes in the different class averages (Figures 3I and J, 4D). It can be assumed that other dimeric interfaces are less stable and likely to be related with early stages of dissociation. Hence, autophosphorylation of DNA-PK appears to cause dimeric complexes to become more prone to dissociation and more flexibly linked. This is in agreement with the plasticity of the holo-enzyme observed by SAXS upon incubation with two different DNAs (23).
Figure 4.

Analysis of a combined (autophosphorylated + dephosphorylated) data set. Class averages calculated from segregated data composed of autophosphorylated (A–D) and dephosphorylated (E and F) particles. White arrows point to Ku densities, black arrows point to DNA-PKcs head domain.
In conclusion, we were able to image a range of dissociated subcomplexes of the DNA-PK complex that occur when the holo-enzyme is autophosphorylated. While Tainer et al. (23,32) analysed the structural effect of autophosphorylation on the chromatographically purified DNA-PKcs subunit, we studied the effect of autophosphorylation on the DNA-PK holo-enzyme in a NHEJ context. We obtained snapshots of different stages of this process with the application of classification protocols aimed at tackling the heterogeneity induced in this system by autophosphorylation. Of most significance for the NHEJ mechanism, the synaptic DNA-PK dimers previously observed in the fully dephosphorylated ‘starting’ state, acquire flexibility on autophosphorylation and the dimeric interaction appears able to adopt a range of different geometries compared to the dephosphorylated state.
SUPPLEMENTARY DATA
Supplementary Data are available at NAR Online.
FUNDING
The Spanish Ministry of Science and Innovation (SAF2008-00451 to O.L.); The Human Frontiers Science Program (RGP39/2008 to O.L.); Red Temática Investigación Cooperativa en Cáncer (RD06/0020/1001 to O.L.); Programme Grant from Cancer Research UK (to L.H.P.); The Spanish National Research Council, The European Social Fund (A.R.-C.); Cancer Research UK Project Grant (C17335/A10470 to L.S.). Funding for open access charge: Cancer Research UK Project (Grant C17335/A10470).
Conflict of interest statement. None declared.
Supplementary Material
REFERENCES
- 1.van Gent DC, Hoeijmakers JH, Kanaar R. Chromosomal stability and the DNA double-stranded break connection. Nat. Rev. Genet. 2001;2:196. doi: 10.1038/35056049. [DOI] [PubMed] [Google Scholar]
- 2.West SC. Molecular views of recombination proteins and their control. Nat. Rev. Mol. Cell Biol. 2003;4:435. doi: 10.1038/nrm1127. [DOI] [PubMed] [Google Scholar]
- 3.Lieber MR. NHEJ and its backup pathways in chromosomal translocations, Nat. Struct. Mol. Biol. 2010;17:393. doi: 10.1038/nsmb0410-393. [DOI] [PMC free article] [PubMed] [Google Scholar]
- 4.Gottlieb TM, Jackson SP. The DNA-dependent protein kinase: requirement for DNA ends and association with Ku antigen. Cell. 1993;72:131. doi: 10.1016/0092-8674(93)90057-w. [DOI] [PubMed] [Google Scholar]
- 5.Hartley KO, Gell D, Smith GC, Zhang H, Divecha N, Connelly MA, Admon A, Lees-Miller SP, Anderson CW, Jackson SP. DNA-dependent protein kinase catalytic subunit: a relative of phosphatidylinositol 3-kinase and the ataxia telangiectasia gene product. Cell. 1995;82:849. doi: 10.1016/0092-8674(95)90482-4. [DOI] [PubMed] [Google Scholar]
- 6.Abraham RT. PI 3-kinase related kinases: ‘big’ players in stress-induced signaling pathways. DNA Repair. 2004;3:883. doi: 10.1016/j.dnarep.2004.04.002. [DOI] [PubMed] [Google Scholar]
- 7.Downs JA, Jackson SP. A means to a DNA end: the many roles of Ku. Nat. Rev. Mol. Cell Biol. 2004;5:367. doi: 10.1038/nrm1367. [DOI] [PubMed] [Google Scholar]
- 8.Walker JR, Corpina RA, Goldberg J. Structure of the Ku heterodimer bound to DNA and its implications for double-strand break repair. Nature. 2001;412:607. doi: 10.1038/35088000. [DOI] [PubMed] [Google Scholar]
- 9.Spagnolo L, Rivera-Calzada A, Pearl LH, Llorca O. Three-dimensional structure of the human DNA-PKcs/Ku70/Ku80 complex assembled on DNA and its implications for DNA DSB repair. Mol. Cell. 2006;22:511. doi: 10.1016/j.molcel.2006.04.013. [DOI] [PubMed] [Google Scholar]
- 10.Merkle D, Douglas P, Moorhead GB, Leonenko Z, Yu Y, Cramb D, Bazett-Jones DP, Lees-Miller SP. The DNA-dependent protein kinase interacts with DNA to form a protein-DNA complex that is disrupted by phosphorylation. Biochemistry. 2002;41:12706. doi: 10.1021/bi0263558. [DOI] [PubMed] [Google Scholar]
- 11.Douglas P, Sapkota GP, Morrice N, Yu Y, Goodarzi AA, Merkle D, Meek K, Alessi DR, Lees-Miller SP. Identification of in vitro and in vivo phosphorylation sites in the catalytic subunit of the DNA-dependent protein kinase. Biochem. J. 2002;368:243. doi: 10.1042/BJ20020973. [DOI] [PMC free article] [PubMed] [Google Scholar]
- 12.Block WD, Yu Y, Merkle D, Gifford JL, Ding Q, Meek K, Lees-Miller SP. Autophosphorylation-dependent remodeling of the DNA-dependent protein kinase catalytic subunit regulates ligation of DNA ends. Nucleic Acids Res. 2004;32:4351. doi: 10.1093/nar/gkh761. [DOI] [PMC free article] [PubMed] [Google Scholar]
- 13.Chan DW, Chen BP, Prithivirajsingh S, Kurimasa A, Story MD, Qin J, Chen DJ. Autophosphorylation of the DNA-dependent protein kinase catalytic subunit is required for rejoining of DNA double-strand breaks. Genes Dev. 2002;16:2333. doi: 10.1101/gad.1015202. [DOI] [PMC free article] [PubMed] [Google Scholar]
- 14.Chan DW, Lees-Miller SP. The DNA-dependent protein kinase is inactivated by autophosphorylation of the catalytic subunit. J. Biol. Chem. 1996;271:8936. doi: 10.1074/jbc.271.15.8936. [DOI] [PubMed] [Google Scholar]
- 15.Cui X, Yu Y, Gupta S, Cho YM, Lees-Miller SP, Meek K. Autophosphorylation of DNA-dependent protein kinase regulates DNA end processing and may also alter double-strand break repair pathway choice. Mol. Cell. Biol. 2005;25:10842. doi: 10.1128/MCB.25.24.10842-10852.2005. [DOI] [PMC free article] [PubMed] [Google Scholar]
- 16.Ding Q, Reddy YV, Wang W, Woods T, Douglas P, Ramsden DA, Lees-Miller SP, Meek K. Autophosphorylation of the catalytic subunit of the DNA-dependent protein kinase is required for efficient end processing during DNA double-strand break repair. Mol. Cell. Biol. 2003;23:5836. doi: 10.1128/MCB.23.16.5836-5848.2003. [DOI] [PMC free article] [PubMed] [Google Scholar]
- 17.Goodarzi AA, Yu Y, Riballo E, Douglas P, Walker SA, Ye R, Harer C, Marchetti C, Morrice N, Jeggo PA, et al. DNA-PK autophosphorylation facilitates Artemis endonuclease activity. EMBO J. 2006;25:3880. doi: 10.1038/sj.emboj.7601255. [DOI] [PMC free article] [PubMed] [Google Scholar]
- 18.Lou Z, Chen BP, Asaithamby A, Minter-Dykhouse K, Chen DJ, Chen J. MDC1 regulates DNA-PK autophosphorylation in response to DNA damage. J. Biol. Chem. 2004;279:46359. doi: 10.1074/jbc.C400375200. [DOI] [PubMed] [Google Scholar]
- 19.Meek K, Douglas P, Cui X, Ding Q, Lees-Miller SP. trans Autophosphorylation at DNA-dependent protein kinase's two major autophosphorylation site clusters facilitates end processing but not end joining. Mol. Cell. Biol. 2007;27:3881. doi: 10.1128/MCB.02366-06. [DOI] [PMC free article] [PubMed] [Google Scholar]
- 20.Reddy YV, Ding Q, Lees-Miller SP, Meek K, Ramsden DA. Non-homologous end joining requires that the DNA-PK complex undergo an autophosphorylation-dependent rearrangement at DNA ends. J. Biol. Chem. 2004;279:39408. doi: 10.1074/jbc.M406432200. [DOI] [PubMed] [Google Scholar]
- 21.Uematsu N, Weterings E, Yano K, Morotomi-Yano K, Jakob B, Taucher-Scholz G, Mari PO, van Gent DC, Chen BP, Chen DJ. Autophosphorylation of DNA-PKCS regulates its dynamics at DNA double-strand breaks. J. Cell. Biol. 2007;177:219. doi: 10.1083/jcb.200608077. [DOI] [PMC free article] [PubMed] [Google Scholar]
- 22.Douglas P, Cui X, Block WD, Yu Y, Gupta S, Ding Q, Ye R, Morrice N, Lees-Miller SP, Meek K. The DNA-dependent protein kinase catalytic subunit is phosphorylated in vivo on threonine 3950, a highly conserved amino acid in the protein kinase domain. Mol. Cell. Biol. 2007;27:1581. doi: 10.1128/MCB.01962-06. [DOI] [PMC free article] [PubMed] [Google Scholar]
- 23.Hammel M, Yu Y, Mahaney BL, Cai B, Ye R, Phipps BM, Rambo RP, Hura GL, Pelikan M, So S, et al. Ku and DNA-dependent protein kinase dynamic conformations and assembly regulate DNA binding and the initial non-homologous end joining complex. J. Biol. Chem. 2010;285:1414. doi: 10.1074/jbc.M109.065615. [DOI] [PMC free article] [PubMed] [Google Scholar]
- 24.Leuther KK, Hammarsten O, Kornberg RD, Chu G. Structure of DNA-dependent protein kinase: implications for its regulation by DNA. EMBO J. 1999;18:1114. doi: 10.1093/emboj/18.5.1114. [DOI] [PMC free article] [PubMed] [Google Scholar]
- 25.Chiu CY, Cary RB, Chen DJ, Peterson SR, Stewart PL. Cryo-EM imaging of the catalytic subunit of the DNA-dependent protein kinase. J. Mol. Biol. 1998;284:1075. doi: 10.1006/jmbi.1998.2212. [DOI] [PubMed] [Google Scholar]
- 26.Boskovic J, Rivera-Calzada A, Maman JD, Chacon P, Willison KR, Pearl LH, Llorca O. Visualization of DNA-induced conformational changes in the DNA repair kinase DNA-PKcs. EMBO J. 2003;22:5875. doi: 10.1093/emboj/cdg555. [DOI] [PMC free article] [PubMed] [Google Scholar]
- 27.Rivera-Calzada A, Maman JD, Spagnolo L, Pearl LH, Llorca O. Three-dimensional structure and regulation of the DNA-dependent protein kinase catalytic subunit (DNA-PKcs) Structure. 2005;13:243. doi: 10.1016/j.str.2004.12.006. [DOI] [PubMed] [Google Scholar]
- 28.Williams DR, Lee KJ, Shi J, Chen DJ, Stewart PL. Cryo-EM structure of the DNA-dependent protein kinase catalytic subunit at subnanometer resolution reveals alpha helices and insight into DNA binding. Structure. 2008;16:468. doi: 10.1016/j.str.2007.12.014. [DOI] [PMC free article] [PubMed] [Google Scholar]
- 29.Sibanda BL, Chirgadze DY, Blundell TL. Crystal structure of DNA-PKcs reveals a large open-ring cradle comprised of HEAT repeats. Nature. 2010;463:118. doi: 10.1038/nature08648. [DOI] [PMC free article] [PubMed] [Google Scholar]
- 30.Llorca O, Pearl LH. Electron microscopy studies on DNA recognition by DNA-PK. Micron. 2004;35:625. doi: 10.1016/j.micron.2004.05.004. [DOI] [PubMed] [Google Scholar]
- 31.Rivera-Calzada A, Spagnolo L, Pearl LH, Llorca O. Structural model of full-length human Ku70-Ku80 heterodimer and its recognition of DNA and DNA-PKcs. EMBO Rep. 2007;8:56. doi: 10.1038/sj.embor.7400847. [DOI] [PMC free article] [PubMed] [Google Scholar]
- 32.Dobbs TA, Tainer JA, Lees-Miller SP. A structural model for regulation of NHEJ by DNA-PKcs autophosphorylation. DNA Repair. 2010;9:1307. doi: 10.1016/j.dnarep.2010.09.019. [DOI] [PMC free article] [PubMed] [Google Scholar]
- 33.Ludtke SJ, Baldwin PR, Chiu W. EMAN: semiautomated software for high-resolution single-particle reconstructions. J. Struct. Biol. 1999;128:82. doi: 10.1006/jsbi.1999.4174. [DOI] [PubMed] [Google Scholar]
- 34.van Heel M, Harauz G, Orlova EV, Schmidt R, Schatz M. A new generation of the IMAGIC image processing system. J. Struc. Biol. 1996;116:17. doi: 10.1006/jsbi.1996.0004. [DOI] [PubMed] [Google Scholar]
- 35.Frank J. Three-Dimensional Electron Microscopy of Macromolecular Assemblies: Visualization of Biological Molecules in their Native State. New York: Oxford University Press; 2006. [Google Scholar]
- 36.White HE, Saibil HR, Ignatiou A, Orlova EV. Recognition and separation of single particles with size variation by statistical analysis of their images. J. Mol. Biol. 2004;336:453. doi: 10.1016/j.jmb.2003.12.015. [DOI] [PubMed] [Google Scholar]
- 37.Hanakahi LA. 2-Step purification of the Ku DNA repair protein expressed in Escherichia coli. Protein Expr. Purif. 2007;52:139. doi: 10.1016/j.pep.2006.10.002. [DOI] [PMC free article] [PubMed] [Google Scholar]
- 38.Klaholz BP, Myasnikov AG, Van Heel M. Visualization of release factor 3 on the ribosome during termination of protein synthesis. Nature. 2004;427:862. doi: 10.1038/nature02332. [DOI] [PubMed] [Google Scholar]
Associated Data
This section collects any data citations, data availability statements, or supplementary materials included in this article.