Abstract
Gene expression array technology has reached the stage of being routinely used to study clinical samples in search of diagnostic and prognostic biomarkers. Due to the nature of array experiments, which examine the expression of tens of thousands of genes simultaneously, the number of null hypotheses is large. Hence, multiple testing correction is often necessary to control the number of false positives. However, multiple testing correction can lead to low statistical power in detecting genes that are truly differentially expressed. Filtering out non-informative genes allows for reduction in the number of null hypotheses. While several filtering methods have been suggested, the appropriate way to perform filtering is still debatable. We propose a new filtering strategy for Affymetrix GeneChips®, based on principal component analysis of probe-level gene expression data. Using a wholly defined spike-in data set and one from a diabetes study, we show that filtering by the proportion of variation accounted for by the first principal component (PVAC) provides increased sensitivity in detecting truly differentially expressed genes while controlling false discoveries. We demonstrate that PVAC exhibits equal or better performance than several widely used filtering methods. Furthermore, a data-driven approach that guides the selection of the filtering threshold value is also proposed.
INTRODUCTION
Microarrays are routinely used to simultaneously examine the expression of thousands or tens of thousands of genes in various tissues and species (1). In recent years, there has been an increase in the use of array technology to study clinical samples in search of biomarkers and gene expression signatures for improved diagnosis and prognosis (2–5). Hence, the quality and the reproducibility of the data become critically important (6,7).
One of the main applications of microarrays is to identify differentially expressed genes (DEGs) between two or more groups of biological samples. DEGs are identified through statistical testing on a gene by gene level. Given the nature of the array experiments where tens of thousands of genes (or probe sets) are printed on an array, the number of null hypotheses to be tested is large. Hence, multiple testing correction is often necessary in order to control for the number of false positives. One of the commonly used methods for multiple testing control is the false discovery rate (FDR) (8), which is the expected ratio of the number of false rejections among the total number of rejections. While FDR adjustment on raw P-values is effective in controlling false positives, it is associated with reduced power to detect truly DEGs. In a typical experiment, the percentage of true positives among all the genes present on an array is often times low (usually <10%). Detecting such a small percentage of DEGs with enough statistical power is clearly challenging.
One strategy to tackle the issue of low power is to reduce the number of null hypotheses by first filtering out non-informative genes and then perform hypothesis testing only on the genes that pass the filter (i.e. the so-called two-stage approach) (9,10). Filtering is motivated by the fact that most whole-genome arrays are designed to be used to detect changes in expression levels in all tissue types and treatment conditions. However, it is well-known that, under a given condition, many genes on an array are not expressed, expressed at low levels, or expressed at levels with no biological significance. In fact, it has been estimated that in a given tissue only 30–40% of the genes are expressed at array detectable levels (11). From a recent study using deep sequencing technology on multiple tissues and at the low threshold of 0.3 reads per kilobase exon model per million mapped reads (RPKM), the number of genes expressed in human and mouse tissues is estimated to be 60–70% of RefSeq coding genes (12). Given that the sensitivity of array platforms is generally considered lower than deep sequencing (with enough sequence depth), clearly a significant percentage of genes are either not expressed or beyond the detection limit in a typical array experiment. Filtering out this group of genes would potentially be beneficial to DEG detection. Furthermore, it has been shown that probe set filtering increases concordance between Affymetrix and quantitative reverse transcription–PCR (qRT–PCR) expression measurements (13).
There are a number of filtering methods available in the literature (9,10,14–16). The most commonly used filter statistics include the fraction of ‘Present’ calls for Affymetrix arrays, the overall mean and the overall variance. Note that these statistics are calculated across all samples (i.e. arrays) by ignoring the sample class labels. Therefore, these approaches are also called non-specific filters. It has been suggested that the non-specific filters should be preferred as they do not interfere with downstream statistical analyses (10,17). Based on several real and simulated data sets, Hackstadt and Hess (9) concluded that the variance filter is superior to the mean filter. Similarly, using a Leukemia data set Bourgon et al. (10) showed that the mean filter generally produced fewer rejections than the variance filter. Due to the subjective nature of filtering, comparing different methods can be difficult and additional comparisons using different control data sets are warranted. Moreover, questions still remain on how to select the threshold in filtering and whether further improvements can be made.
On the Affymetrix platform, one uses a probe set containing multiple 25-bp oligonucleotides probes to represent a gene. For this type of array, Talloen et al. (16) recently introduced a filtering technique named informative/non-informative calls (I/NI-calls). This method was derived from the summarization algorithm, factor analysis for robust microarray summarization (FARMS) (18). It entails the utilization of Bayesian factor analysis on probe level data and filtering out the genes by the variance of a factor. One nice feature about their method is that in their model the variance of the factor can capture the correlation between probes. As all probes in a probe set are designed to target the same transcript or a transcript cluster (19), these probes should largely perform concordantly when gene expression is measured. In this report, we propose a new strategy to filter non-informative features based on gene expression from Affymetrix arrays. We explore the correlation feature between probes by conducting principal component analysis (PCA) on the probe-level data, and use the variability captured by the first principal component (PC1) as a measure of consistency among probes in a probe set. Our strategy is in principle similar to Talloen’s method, but differs in several ways: (i) our method does not rely on any distribution assumptions, (ii) no selection of an informative prior is required and (iii) our approach is much simpler and thus potentially more practical for data analysts to use. Based on a well-defined spike-in control data set (where we know the true differences in transcript concentrations between the two groups) and a real data set from a diabetes study, we show that filtering by the proportion of variation accounted by PC1 (PVAC) provides increased sensitivity in detecting DEGs and is on par with, or outperforms several competing methods. Furthermore, a data-driven approach is developed to guide the selection of the filtering threshold value.
MATERIALS AND METHODS
Data sets
Affymetrix spike-in data set (20) is available from the NCBI Gene Expression Omnibus (GEO) (21) (accession number GSE21344). It includes a total of 18 samples divided into two groups. More than 5000 RNAs are spiked in at fold changes ranging from 1 to 4. In this experiment the RNA amount, direction and magnitude of fold change are balanced between the two groups. This data set is termed ‘Platinum Spike’, reflecting an improved experimental design over the previous design of the ‘Golden Spike’ data set (22).
The diabetes data set is also available from GEO (accession number GSE5606) (23). This data set includes 14 samples (seven diabetic rats and seven controls). Gene expression was measured using the Affymetrix Rat GeneChip® 230 2.0 array with a total of 31 099 probe sets on the chip.
Affymetrix data preprocessing
Data analysis was performed using R (24) with Bioconductor packages (25). Raw CEL files were processed using the robust multichip average (RMA) algorithm available in the affy package (26) with steps including background correction, quantile normalization and summarization by the median polish approach (27). The log2 scale data from RMA was used in statistical testing. The MAS5 presence/absence (P/A) calls were acquired using the affy package. The P/A detection call is based on the Wilcoxon signed rank tests for comparing perfect match (PM) and the corresponding mismatch (MM) probes in a probe set (19). Such calls are made for each probe set in every study sample.
PCA
We performed PCA (28) on probe-level data matrices. Given a probe set, the raw probe-level data were first background-corrected and quantile normalized as in the RMA procedure. We then applied the log2 transformation and transposed the data matrix to place the probes on the columns and the samples on the rows. Furthermore, we scaled the data matrix to have zero mean and unit variance for each data column before performing the PCA.
PCA is a commonly used technique for dimension reduction (28,29). Consider a probe set with n probes, a data set with m samples and the dimension of the scaled probe-level data matrix X is m × n. The singular value decomposition (SVD) of X is: X = UΣV, where the matrix U is orthonormal (UT U = I, the identity matrix), Σ is a diagonal matrix containing the associated singular values λ, and the rows of matrix V are also orthonormal (VVT = I). The singular values, {λ1, λ2, λ3, … , λk}, are often ranked (from highest to lowest), with the largest squared value representing the amount of variation accounted for by the first PC (PC1). Given the fact that all probes are designed to detect the same target message RNA level, the full probe level data matrix should be largely approximated by PC1. Hence, we chose the ratio:
 |
i.e. the proportion of variance accounted for by the PC1 among the total variance, as a measure of probe consistency, and used it as our filter criteria. The R code for performing the full analysis is available from the Bioconductor repository (version 2.8 and later) (25).
Evaluating statistical significance and power comparison
For comparison purposes, we used the same statistic, the t-test with equal variance as used in (9) and (10), to rank genes in each hypothesis test. For the spike-in data set, statistical significance was also evaluated using the limma t-statistic available in the package limma (30). For a given gene g, limma fits a linear model and tests the null hypothesis H0:βg = 0, where βg is the contrast of interest. To test this hypothesis, a moderated t-statistic  is constructed as:
 |
where  and vg is the scaling factor of the variance estimates of
  This statistic is derived based on a hierarchical model where unknown gene-level variances
  are modeled by a scaled inverse chi-square distribution, with d0 and
  as hyperparameters.
The power of tests after various filtering was compared by receiver operating characteristic curves (ROC) (22,31). Specifically, given the true differential expression status of each probe set, we computed and plotted the proportion of true positives being detected against the proportion of false discoveries among the total rejections at various t-statistic threshold values.
RESULTS
An overview of PCA-based filtering
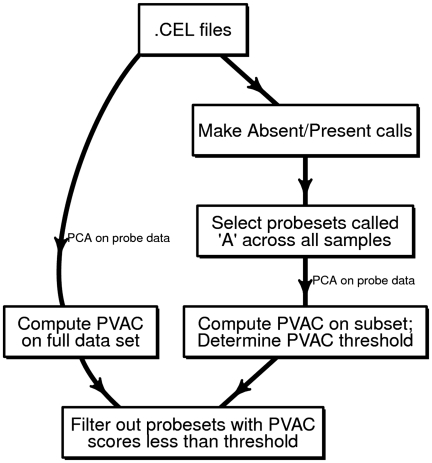
Two steps are involved in PCA-based filtering (Figure 1). First, for each individual probe set, PCA is performed on a transposed probe-level data matrix (i.e. samples on rows and probes on columns), including all the study samples. The probe data matrices are derived from the CEL files after the steps of RMA background correction and quantile normalization. We performed PCA and used the proportion of variation explained by PC1 (PVAC) to measure the degree of consistency among probes within a probe set. Second, we derived an empirical distribution of the PVAC scores of the probe sets that are called ‘Absent’ by the Affymetrix MAS5.0 calling algorithm (19) across all the study samples. We then chose the 99% percentile value of this distribution (with a maximum value of 0.5, i.e. 50% of the total variation) as the threshold, and applied it to all the probe sets on the chip (i.e. filtering out probe sets with PVAC scores less than the threshold value).
Figure 1.
A diagram of the work-flow for performing PCA-based filtering. For each probe set, the PCA is performed on the background corrected, quantile normalized probe-level data matrix, where the probes are in columns and samples in rows. The proportion of variation accounted by PC1 was extracted and used for measuring concordance of probes. A cutoff was chosen based on the distribution of the same statistic among a subset of probe sets that are called ‘Absent’ across all samples by the MAS5 algorithm. See the ‘Materials and Methods’ section for details.
Power assessment of filtering methods using a spike-in data set
Given the subjective nature of filtering, it is impractical to compare every scenarios (e.g. at various threshold values) with different methods. Here, we conducted a basic comparison between PVAC and the two most commonly used filtering strategies, under a reasonable threshold: (i) Filtering by the Present/Absent calls—we used the same criterion as in (9), i.e. filter out a probe set if there are no ‘Present‘calls for the probe set in any of the study samples. (ii) Filtering by overall variance—first the overall variance was calculated for each probe set and then the variances were ranked. Then, any probe set with its variance ranked below the median (50%) value was filtered out. The same criterion was recommended by (9) and was used in (10).
We compared these filtering methods based on a well-defined spike-in experiment (20). This data set contains a total of 18 samples (with nine in each group) and about 18 707 probe sets, among which 1944 are truly differently expressed (i.e. spike-ins with fold changes ranging from 1.2- to 4-fold), 3426 were spiked-in at an equal amount between the two groups, and the remaining 13 337 probe sets are considered non-expressed genes. For comparison, we used the same t-test for differential expression detection as in (9) and (10).
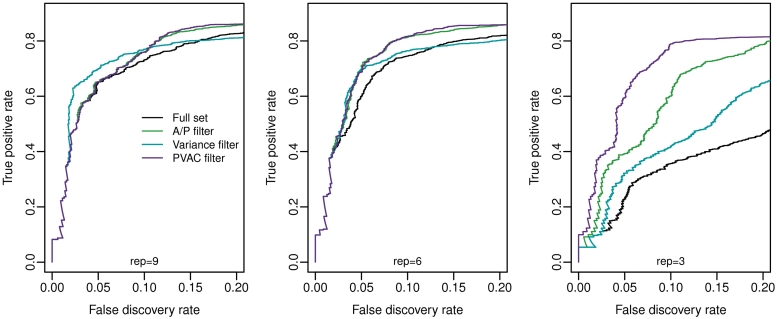
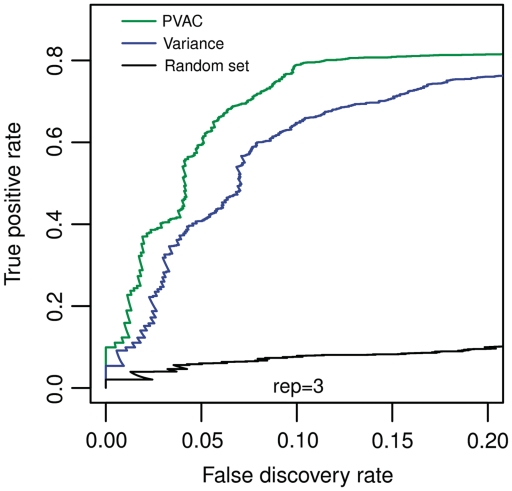
The performance of the filtering methods was compared based on ROC curves where we plotted the true positive rate (on y-axis) against the observed FDR (on x-axis) calculated on the known status of each probe set. Figure 2 shows the ROC curves drawn based on all the data (nine replicates, n = 18, panel A), and on subsets of data with six replicates (n = 12, panel B) and with three replicates (n = 6, panel C). Random sampling of independent subsets of data (i.e. n = 12 and n = 6) produced similar results (data not shown). In all three data sets, each filtering method being evaluated showed increased power compared to that without filtering. For data sets with a large number of replicates (nine or six), variance-based filtering seems to have slightly better performance at a low FDR threshold. However, overall it is similar to the other filtering strategies. In contrast, for the data set with three replicates, PVAC consistently outperformed both the A/P-call based and variance based filtering approaches. The increased power from the PVAC score-based method is not due to the shorter gene list after filtering. Filtering out the same number of genes with the variance filter does not attain the same level of statistical power as the PVAC approach (Figure 3). We consider such an improvement in power for small sample-size experiments significant as few replicates are commonly used in biological experiments mainly due to cost constraints.
Figure 2.
Power comparisons of different filtering methods by ROC curves based on the spike-in data set. Here the proportions of true DEGs detected are drawn against the observed FDRs, derived from applying various filters and performing the two-sample t-test. Note that the comparisons were performed on the full data set with nine replicates in each group (left), a subset of samples with six replicates (middle) and a subset with three replicates (right).
Figure 3.
Power comparison between the variance and the PCA-based filters given a fixed number of filter-passing genes. By adjusting the threshold value of the ranked overall gene-level variances, the same number of genes as those passing the PVAC filter (n = 3 848) were chosen for statistical testing. The power comparison through ROC curves is based on the same subset of data (with n = 3) as shown in Figure 2, right hand side. For comparison, a random set with the same number of probe sets were drawn and compared to those from the variance and PVAC filters.
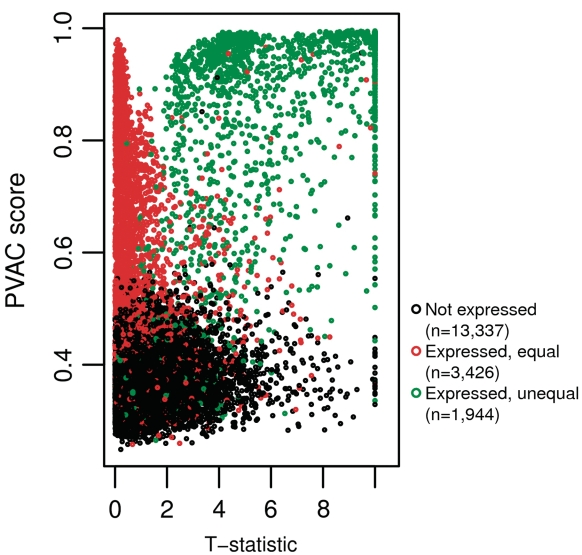
To further examine the effect of PVAC score-based filtering, we plotted the PVAC scores against the t-statistics for all the probe sets with known expression states (Figure 4). Overall, scores from the vast majority of non-expressed probe sets are relatively low, and the scores as well as the t-statistics from DEGs are relatively high. The probe sets that were spiked-in with equal amounts in the two groups showed low t-statistics, but nearly uniform distribution on the PVAC scores. These results suggest that the benefits of filtering seem to largely result from filtering out non-expressed genes.
Figure 4.
PVAC scores versus t-statistics. Here the PVAC scores and the t-statistics were calculated on the subset of data with three replicates in each group. Each dot in the figure represents a probe set, colored by one of the three possible states (i.e. no expression, expressed but no difference between the two groups, and differentially expressed). The t-statistics were set to 10 if values >10.
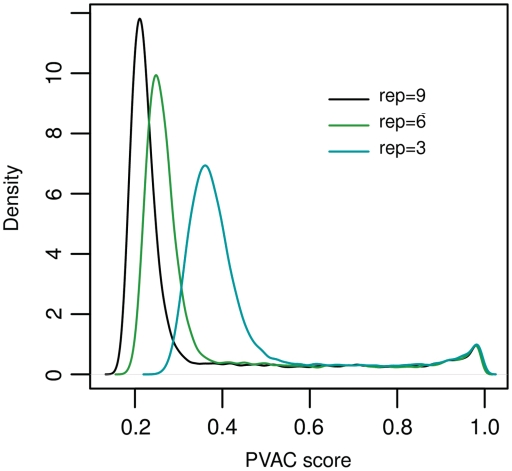
Next we investigated the effect of sample size on the distribution of PVAC scores which is directly relevant to the selection of cutoff values for filtering. Figure 5 illustrates the distribution of PVAC scores for the data sets with different sample sizes. It can be seen that the overall distribution of PVAC scores shifts to the left as the sample size increases. Note that the small peak in the distribution at the far right of the histogram could be due to singularity in the data. In general, the increase in sample size often leads to a higher total number of principal components in PCA (with a maximum being the number of probes in a probe set). This in general leads to a lower PVAC score. Therefore, the change in the distribution of scores with different data sets requires a data-dependent adjustment of threshold values for filtering.
Figure 5.
Influence of the sample size on the distribution of PVAC scores. Here the overall distribution of the PVAC scores are plotted based on the full data set (n = 9) and subsets of the spike-in data set (n = 6 and n = 3). rep denotes replicates.
A case study: diabetes data set
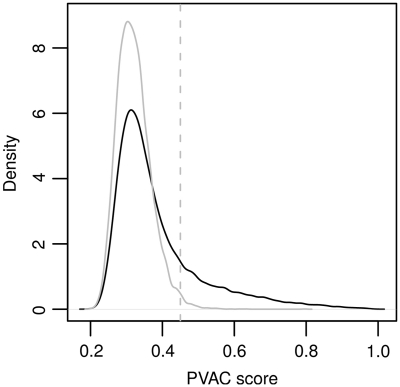
Using a rodent model of diabetic cardiomyopathy (DCM), Glyn-Jones et al. (23) compared gene expression in the cardiac left ventricles of seven diabetic rats with seven controls. There are a total of 31 099 probe sets on the chip (Affymetrix, Rat GeneChip 230 2.0 array). This data set was also analyzed by Hackstadt and Hess (9) in order to evaluate variance-based filtering using a two-sample t-test with equal variance. Here, we applied the same strategy but with PVAC. The distribution of PVAC scores is shown in Figure 6. Applying the strategy described previously, we set the PVAC score cutoff value at 0.45 in order to filter out low-consistency probe sets.
Figure 6.
Overall distribution of the PVAC scores from the diabetes data set. The distribution of the observed PVAC scores is plotted (in dark), along with the density of the PVAC scores from the probe sets called ‘Absent’ across all samples, i.e. the non-expressed sets (in gray). The gray vertical line indicates the 99 percentile value from the non-expressed sets, which is chosen as the threshold for filtering.
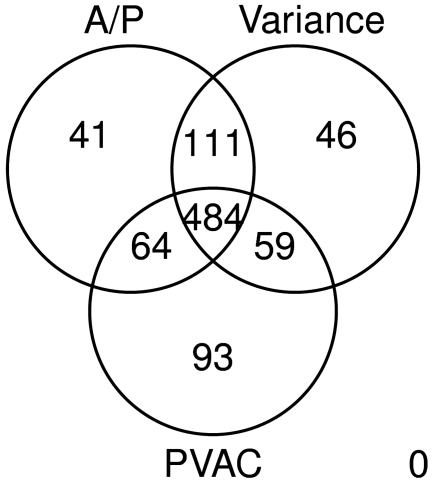
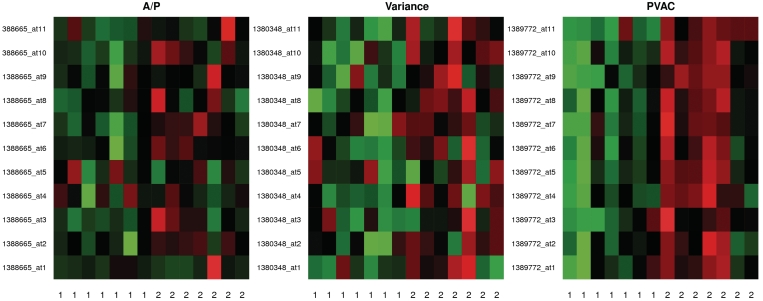
Using RMA preprocessed values and at a 5% Benjamini and Hochberg adjusted FDR, Hackstadt and Hess identified 710 DEGs using variance-based filtering, and 781 by applying A/P call based-filtering. Applying PVAC to the same preprocessed data set and with the same criteria, we identified 20% more (855) DEGs than applying the variance filter method. Besides the difference in numbers, we also examined the lists of the top 700 genes from the three methods (Figure 7). While about 70% (484) of the genes can be found by either of the three filters, using PVAC seemed to be able to identify more unique genes than those from applying the other two filters (93 versus 41 and 46). We examined the probe-level expression of the probe sets uniquely identified by each of the three methods (Figure 8). As expected, the probe sets identified by PVAC tend to show more consistent probe performance (i.e. similar consistent expression) than those identified by either the A/P call filter or the variance filter.
Figure 7.
Venn diagram of the lists of top ranked genes from various filters. Here the top ranked genes (n = 700) identified as differentially expressed (FDR < 0.05) in the diabetes data set are compared after applying the A/P filter, the variance and the PVAC filters. The same filtering procedure were chosen as those used in Figure 2 (see ‘Results’ section for details).
Figure 8.
Heatmap of probe-level data for genes selected by each filtering method. The probe-level data are shown for the differentially expressed probe sets uniquely identified by the A/P filter (388665_at), the variance filter (1380348_at), and by the PVAC filter (1389772_at). For each probe set, the probe-level data (on each row) were scaled to mean 0 and unit variance for displaying in the heatmap, with the groups labeled as 1 and 2 and the probe identifiers shown on each row. The red and green colors represent high and low probe intensity, respectively.
DISCUSSION
Bourgon et al. (10) pointed out that an ideal filtering criterion should be independent of test statistics under the null hypothesis (i.e. no differential expression), but correlated under the alternative. Our approach to gene filtering, based on PCA on the probe-level data, fits well in this category (Figure 4). Besides the increase in statistical power as demonstrated by the spike-in data set, our filtering method has two major advantages compared to the variance- and A/P call-based filtering approaches: (i) unlike the filtering criteria used in the other two methods, the one used here (the PVAC score) is interpretable. It represents the percentage of total variation in the probe data explained by the PC1. As all probes in a probe set are designed to target a common mRNA transcript (or a common cluster of transcripts), the PVAC score also measures the degree of consistency among the probes in a probe set. High level of probe consistency in a probe set is desirable, whereas probe sets containing low consistency probes would be difficult to validate experimentally. (ii) Although a subjective cutoff is utilized, we have provided an intrinsic way to guide the selection of a threshold for filtering based on the distribution of PVAC scores in a subset of probe sets selected by the MAS5 calls. In this regard, we have taken a hybrid approach to gene filtering.
Most of our attention has been directed to comparing our PVAC method to the A/P call- and variance-based filtering approaches using RMA summarized values. We also compared our PVAC-based filtering with the I/NI-calls method based on the spike-in data sets. Here, the FARMS summarized values with either a Laplacian or a normal prior for the factor were used as inputs for I/NI-calls, but the same RMA summarized values (of only the informative probe sets) were used for subsequent statistical testing and comparison with the PVAC filtering approach. For the case of the normal prior of the factor (Supplementary Data Figure S1), I/NI-calls filtering seems to be too stringent in the case of replicates (rep) = 9 and rep = 6, but perform slightly better than the PVAC with rep = 3. For the case of the Laplacian prior of the factor (Supplementary Data Figure S2), the I/NI-calls method shows similar performance with rep = 9 and rep = 6, but performs slightly worse than PVAC with rep = 3. A limitation of the Bayesian factor analysis approach is that the selection of an informative prior may not always be easy. Although similar in overall performance, the PVAC method seems to show a slight edge in selecting the filtering threshold value than the I/NI-calls method. Also, unlike the I/NI-calls, the PVAC approach does not rely on any distribution assumptions which can be difficult to verify for real data.
Here, the comparison between different filtering methods is based on a simple two-sample t-test. We also performed the same comparison on the spike-in data set using the limma moderated t-statistic, where an empirical Bayesian approach was used to model the gene-specific variances with an inverse χ2 distribution (30). We observed a similar improvement in power with filtering, although the increase in power is less dramatic than that from the regular t-test (Supplementary Data Figure S3). As expected, even without filtering, the limma t-statistic performs significantly better than the two-sample t-test, implying that the limma t-statistic has overlapping but a somewhat different role than filtering in identifying the non-expressed genes or those beyond the detection limit. Bourgon et al. (10) argued against combining the limma t-statistic with filtering, as filtering may lead to a skewed distribution of the gene-level error variances. From the empirical data, it is clear that both the limma moderated t-statistic and filtering show some strength in improving power (Supplementary Data Figure S3). Further investigation on how to best combine the two procedures is warranted.
Another remaining question is how filtering affects multiple testing correction for controlling the experiment-wide Type-I error. It has been pointed out that applying the FDR adjustment to post-filtered P-values is closely related to weighted FDR control (WFDR) (32), where a common weight is assigned to genes passing the filter and weight zero for the genes that are filtered out (10). It is worth mentioning that using the same spike-in data set, Zhu et al. (20) showed that, even without filtering, there are discrepancies between the observed FDR and predicted FDR. This indicates that further research on FDR control is still needed.
One obvious limitation with filtering by PVAC is that it can only be applied to the Affymetrix array platform, as the probe-level data is needed. Also, it may be useful to explore robust methods for PCA, although this could be challenging with a small sample data set. Besides being an effective filter, it should be pointed out that a probe set PVAC score derived from the probe-level data can also be used as a quality measure of the probe set. This would generally be useful in selecting genes for further experimental validation, even in situations where no filtering is performed.
SUPPLEMENTARY DATA
Supplementary Data are available at NAR online.
FUNDING
This research was supported, in part by, the Intramural Research Program of the National Institutes of Health (NIH) and National Institute of Environmental Health Sciences (NIEHS) (Z01 ES102345-04 and Z01 ES101744-04). Funding for open access charge: NIEHS-NIH.
Conflict of interest statement. None declared.
Supplementary Material
ACKNOWLEDGEMENT
We thank Jennifer Fostel and Weichun Huang for their critical review of the manuscript.
REFERENCES
- 1.Lockhart DJ, Dong H, Byrne MC, Follettie MT, Gallo MV, Chee MS, Mittmann M, Wang C, Kobayashi M, Horton H, et al. Expression monitoring by hybridization to high-density oligonucleotide arrays. Nat. Biotechnol. 1996;14:1675–1680. doi: 10.1038/nbt1296-1675. [DOI] [PubMed] [Google Scholar]
- 2.Berry MPR, Graham CM, McNab FW, Xu Z, Bloch SAA, Oni T, Wilkinson KA, Banchereau R, Skinner J, Wilkinson RJ, et al. An interferon-inducible neutrophil-driven blood transcriptional signature in human tuberculosis. Nature. 2010;466:973–977. doi: 10.1038/nature09247. [DOI] [PMC free article] [PubMed] [Google Scholar]
- 3.Boutros PC, Lau SK, Pintilie M, Liu N, Shepherd FA, Der SD, Tsao M-S, Penn LZ, Jurisica I. Prognostic gene signatures for non-small-cell lung cancer. Proc. Natl Acad. Sci. USA. 2009;106:2824–2828. doi: 10.1073/pnas.0809444106. [DOI] [PMC free article] [PubMed] [Google Scholar]
- 4.Iqbal J, Weisenburger DD, Greiner TC, Vose JM, McKeithan T, Kucuk C, Geng H, Deffenbacher K, Smith L, Dybkaer K, et al. Molecular signatures to improve diagnosis in peripheral T-cell lymphoma and prognostication in angioimmunoblastic T-cell lymphoma. Blood. 2010;115:1026–1036. doi: 10.1182/blood-2009-06-227579. [DOI] [PMC free article] [PubMed] [Google Scholar]
- 5.McWeeney SK, Pemberton LC, Loriaux MM, Vartanian K, Willis SG, Yochum G, Wilmot B, Turpaz Y, Pillai R, Druker BJ, et al. A gene expression signature of CD34 + cells to predict major cytogenetic response in chronic-phase chronic myeloid leukemia patients treated with imatinib. Blood. 2010;115:315–325. doi: 10.1182/blood-2009-03-210732. [DOI] [PMC free article] [PubMed] [Google Scholar]
- 6.Shi L, Reid LH, Jones WD, Shippy R, Warrington JA, Baker SC, Collins PJ, de Longueville F, Kawasaki ES, Lee KY, et al. The MicroArray Quality Control (MAQC) project shows inter- and intraplatform reproducibility of gene expression measurements. Nat. Biotechnol. 2006;24:1151–1161. doi: 10.1038/nbt1239. [DOI] [PMC free article] [PubMed] [Google Scholar]
- 7.Shi L, Campbell G, Jones WD, Campagne F, Wen Z, Walker SJ, Su Z, Chu T-M, Goodsaid FM, Pusztai L, et al. The MicroArray Quality Control (MAQC)-II study of common practices for the development and validation of microarray-based predictive models. Nat. Biotechnol. 2010;28:827–838. doi: 10.1038/nbt.1665. [DOI] [PMC free article] [PubMed] [Google Scholar]
- 8.Benjamini Yoav. Controlling the False Discovery Rate: a Practical and Powerful Approach to Multiple Testing. J. Roy. Stat. Soc. 1995;57:289–300. [Google Scholar]
- 9.Hackstadt A, Hess A. Filtering for increased power for microarray data analysis. BMC Bioinformatics. 2009;10:11. doi: 10.1186/1471-2105-10-11. [DOI] [PMC free article] [PubMed] [Google Scholar]
- 10.Bourgon R, Gentleman R, Huber W. Independent filtering increases detection power for high-throughput experiments. Proc. Natl Acad. Sci. USA. 2010;107:9546–9551. doi: 10.1073/pnas.0914005107. [DOI] [PMC free article] [PubMed] [Google Scholar]
- 11.Su AI, Cooke MP, Ching KA, Hakak Y, Walker JR, Wiltshire T, Orth AP, Vega RG, Sapinoso LM, Moqrich A, et al. Large-scale analysis of the human and mouse transcriptomes. Proc. Natl Acad. Sci. USA. 2002;99:4465–4470. doi: 10.1073/pnas.012025199. [DOI] [PMC free article] [PubMed] [Google Scholar]
- 12.Ramsköld D, Wang ET, Burge CB, Sandberg R. An Abundance of Ubiquitously Expressed Genes Revealed by Tissue Transcriptome Sequence Data. PLoS Comput. Biol. 2009;5:e1000598. doi: 10.1371/journal.pcbi.1000598. [DOI] [PMC free article] [PubMed] [Google Scholar]
- 13.Mieczkowski J, Tyburczy ME, Dabrowski M, Pokarowski P. Probe set filtering increases correlation between Affymetrix GeneChip and qRT-PCR expression measurements. BMC Bioinformatics. 2010;11:104. doi: 10.1186/1471-2105-11-104. [DOI] [PMC free article] [PubMed] [Google Scholar]
- 14.McClintick JN, Edenberg HJ. Effects of filtering by Present call on analysis of microarray experiments. BMC Bioinformatics. 2006;7:49. doi: 10.1186/1471-2105-7-49. [DOI] [PMC free article] [PubMed] [Google Scholar]
- 15.Calza S, Raffelsberger W, Ploner A, Sahel J, Leveillard T, Pawitan Y. Filtering genes to improve sensitivity in oligonucleotide microarray data analysis. Nucleic Acids Res. 2007;35:e102. doi: 10.1093/nar/gkm537. [DOI] [PMC free article] [PubMed] [Google Scholar]
- 16.Talloen W, Clevert D-A, Hochreiter S, Amaratunga D, Bijnens L, Kass S, Göhlmann HWH. I/NI-calls for the exclusion of non-informative genes: a highly effective filtering tool for microarray data. Bioinformatics. 2007;23:2897–2902. doi: 10.1093/bioinformatics/btm478. [DOI] [PubMed] [Google Scholar]
- 17.Gentleman R. Bioinformatics and computational biology solutions using R and Bioconductor. 2005 Birkhäuser Basel. [Google Scholar]
- 18.Hochreiter S, Clevert D-A, Obermayer K. A new summarization method for affymetrix probe level data. Bioinformatics. 2006;22:943–949. doi: 10.1093/bioinformatics/btl033. [DOI] [PubMed] [Google Scholar]
- 19.Affymetrix, Inc. Statistical Algorithms Description Document. 2002 Technical report. [Google Scholar]
- 20.Zhu Q, Miecznikowski J, Halfon M. Preferred analysis methods for Affymetrix GeneChips. II. An expanded, balanced, wholly-defined spike-in data set. BMC Bioinformatics. 2010;11:285. doi: 10.1186/1471-2105-11-285. [DOI] [PMC free article] [PubMed] [Google Scholar]
- 21.Barrett T, Troup DB, Wilhite SE, Ledoux P, Rudnev D, Evangelista C, Kim IF, Soboleva A, Tomashevsky M, Marshall KA, et al. NCBI GEO: archive for high-throughput functional genomic data. Nucleic Acids Res. 2009;37:D885–D890. doi: 10.1093/nar/gkn764. [DOI] [PMC free article] [PubMed] [Google Scholar]
- 22.Choe SE, Boutros M, Michelson AM, Church GM, Halfon MS. Preferred analysis methods for Affymetrix GeneChips revealed by a wholly defined control data set. Genome Biol. 2005;6:R16. doi: 10.1186/gb-2005-6-2-r16. [DOI] [PMC free article] [PubMed] [Google Scholar]
- 23.Glyn-Jones S, Song S, Black MA, Phillips ARJ, Choong SY, Cooper GJS. Transcriptomic analysis of the cardiac left ventricle in a rodent model of diabetic cardiomyopathy: molecular snapshot of a severe myocardial disease. Physiol. Genomics. 2007;28:284–293. doi: 10.1152/physiolgenomics.00204.2006. [DOI] [PubMed] [Google Scholar]
- 24.Ihaka R, Gentleman R. R: A Language for Data Analysis and Graphics. J. Comp. Graph. Stat. 1996;5:299–314. [Google Scholar]
- 25.Gentleman RC, Carey VJ, Bates DM, Bolstad B, Dettling M, Dudoit S, Ellis B, Gautier L, Ge Y, Gentry J, et al. Bioconductor: open software development for computational biology and bioinformatics. Genome Biol. 2004;5:R80. doi: 10.1186/gb-2004-5-10-r80. [DOI] [PMC free article] [PubMed] [Google Scholar]
- 26.Gautier L, Cope L, Bolstad BM, Irizarry RA. affy—analysis of Affymetrix GeneChip data at the probe level. Bioinformatics. 2004;20:307–315. doi: 10.1093/bioinformatics/btg405. [DOI] [PubMed] [Google Scholar]
- 27.Irizarry RA, Hobbs B, Collin F, Beazer-Barclay YD, Antonellis KJ, Scherf U, Speed TP. Exploration, normalization, and summaries of high density oligonucleotide array probe level data. Biostatistics. 2003;4:249–264. doi: 10.1093/biostatistics/4.2.249. [DOI] [PubMed] [Google Scholar]
- 28.Jolliffe IT. 2nd edn. New York: Springer; 2002. Principal Component Analysis. [Google Scholar]
- 29.Strang G. 3rd edn. Wellesley, MA: Wellesley Cambridge Press; 2003. Introduction to Linear Algebra. [Google Scholar]
- 30.Smyth GK. Linear models and empirical Bayes methods for assessing differential expression in microarray experiments. Stat. Appl. Gen. Mol. Biol. 2004;3 doi: 10.2202/1544-6115.1027. Article 3. [DOI] [PubMed] [Google Scholar]
- 31.Shapiro DE. The interpretation of diagnostic tests. Stat. Methods Med. Res. 1999;8:113–134. doi: 10.1177/096228029900800203. [DOI] [PubMed] [Google Scholar]
- 32.Benjamini Y, Yekutieli D. The control of the false discovery rate in multiple testing under dependency. Ann. Stat. 2001;29:1165–1188. [Google Scholar]
Associated Data
This section collects any data citations, data availability statements, or supplementary materials included in this article.


