


Abstract
Gene ontology analysis has become a popular and important tool in bioinformatics study, and current ontology analyses are mainly conducted in individual gene or a gene list. However, recent molecular network analysis reveals that the same list of genes with different interactions may perform different functions. Therefore, it is necessary to consider molecular interactions to correctly and specifically annotate biological networks. Here, we propose a novel Network Ontology Analysis (NOA) method to perform gene ontology enrichment analysis on biological networks. Specifically, NOA first defines link ontology that assigns functions to interactions based on the known annotations of joint genes via optimizing two novel indexes ‘Coverage’ and ‘Diversity’. Then, NOA generates two alternative reference sets to statistically rank the enriched functional terms for a given biological network. We compare NOA with traditional enrichment analysis methods in several biological networks, and find that: (i) NOA can capture the change of functions not only in dynamic transcription regulatory networks but also in rewiring protein interaction networks while the traditional methods cannot and (ii) NOA can find more relevant and specific functions than traditional methods in different types of static networks. Furthermore, a freely accessible web server for NOA has been developed at http://www.aporc.org/noa/.
INTRODUCTION
The concept of biological function is fundamental for the genome research. Gradual accumulation of biological knowledge inspirits the emergence of Gene Ontology (GO) project which allows annotating tens of thousands of genes in various species. Up to 26 October 2010, there have been more than 2 753 338 annotations in 48 species available in GO database (1), which provide considerable knowledge for biologists to understand the behavior of a specific gene or gene product in a biological system.
These gene annotations provided by GO project describe the function of a single gene or gene product, but biologists are more interested in the GO enrichment analysis of a large gene list since widely applied high-throughput genomic, proteomic and bioinformatics scanning technologies, such as DNA microarray and protein mass spectrometry, usually result in a set of differentially expressed genes or proteins under studied biological conditions; that is, the follow-up functional analysis of this large gene list becomes important in revealing biological meanings and allowing further experimental validation. To address this challenge, a number of GO functional enrichment tools have been developed. Recently, Huang et al. (2) comprehensively reviewed 68 bioinformatics enrichment tools and classified them into three classes: singular enrichment analysis, gene set enrichment analysis and modular enrichment analysis. Khatri et al. (3) generally compared the limitations and characteristics of 14 tools in terms of scope of analysis, visualization capabilities, statistical model and correction for multiple comparisons, etc. Although each tool has distinct strengths (4–8), the common motivation behind these tools is to list the associated GO terms for the interesting gene list and then statistically identify the most enriched or significant biological annotations.
However, an important lesson from network biology is that molecular interactions in addition to single molecules can be biologically meaningful (9). To be precise, genes carry out their specific functions by their temporal interactions and may change function by interacting with different neighbors (10). This implicates that functional analysis of gene list (without considering interactions) is still far from the ‘optimal annotation’. Therefore, there is a clear need to annotate functions by simultaneously considering molecules and their interactions (11), i.e. to annotate biological function to biomolecular networks or biological networks (9,12). A biological network is defined as a set of nodes and links (edges). Usually, nodes represent genes or their products and if two nodes have some type of interactions, there will be a link (an edge) between them. Currently, many biological networks have been extensively studied, such as protein interaction networks (13), gene regulatory networks (14) and metabolic networks (15). In particular, some condition-specific sub-networks have been constructed to investigate fundamentally important biological problems, such as the disease-aging network (16), human liver metabolic network (17) and B-cell transcriptional regulatory networks (18).
Furthermore, recent studies reveal that biological network is dynamic with network rewiring under different external responses and emergence or vanishing of edges along with temporal or spatial changes. An example for transcriptional network dynamics in the yeast transcriptional regulatory networks at different conditions is indicated in ref. 19, and an example for protein–protein interaction network dynamic in the tissue-specific protein interaction networks in ref. 20. These examples imply that the same gene list with different ways of interactions in different conditions has significantly different biological meanings or functions. Thus, functional analysis on biological networks (considering both genes and interactions) would surpass the ability of current function enrichment analysis tools on gene list (considering only genes). To show this, we present several examples in Figure 1. The first example is that two protein interaction networks, derived from the same set of proteins, may have different functions due to different mode of connection. As shown in Figure 1(A1), a typical example reported in the disease research is the so-called ‘edgetic’, which finds that many human inherited disorders are caused not by a gene removal (node removal) but by an edge removal (21). Gene networks of patients and healthy people have the same gene list. But the connections are different, and therefore they have fundamentally different phenotypes. In this situation, current gene list methods (GLMs) clearly cannot tell the difference because the edge information is not considered. Another example is from transcription regulatory process. As shown in Figure 1(A2), TBL1 can be a repressor of RARB when forming a complex with GPS2, TBLR1, HDAC3 and NCoR, and it can also be an activator of pS2 cooperating with others (22). This suggests that the function of a gene depends on its interacting partners. Furthermore, many networks are shown to be dynamic. For example in Figure 1(A3), the regulatory network of yeast can be very different in different conditions (19). Taken together, it is in an exigent need to develop new analysis methods to analyze function of biological networks by fully exploiting network topological information.
Figure 1.

Schematic examples to illustrate the motivation of NOA. (A) Schematic examples to illustrate the motivation of considering interactions in functional enrichment analysis. Here, we list three situations where gene list based methods fail. (A1) illustrates the concept of ‘edgetic’ (21). Many complex diseases are caused by edge removal instead of node removal from wild type. The red node is an important protein related to some kind of disease. Although the concentration of the protein does not change, mutation causes an interaction broken, and leads to disease. This cannot be detected by single gene or gene list based analysis. (A2) shows that TBL1 has fundamentally different functions when joining different transcriptional complexes by acting as either co-repressor or co-activator (22). The blue line stands for DNA. (A3) is an example for network rewiring of yeast transcriptional networks (19). We show the yeast transcriptional regulatory network in the left and the corresponding TF co-regulatory network in the right. Interactions or genes are colored as red if they are active in cell cycle, blue in sporulation, and black in both processes. (B) Three levels of ontology analysis. Gene ontology is based on the information of sequence, structure, phenotype, etc. to infer the function of single genes or gene products. Gene list ontology analysis performs enrichment analysis in a gene list based on hypothesis testing. Most tools such as FatiGO, DAVID, g:profiler and BiNGO are in this level. Our NOA addresses the problem of network ontology analysis and conceptually belongs to the biological network level.
In this paper, we introduce a novel Network Ontology Analysis (NOA) method. Given a biological network, NOA first retrieves all available GO annotations of individual genes from GO database, and then assigns GO terms to links between two genes through optimizing two indexes: ‘Diversity’ and ‘Coverage’. Then two alternative strategies, whole-net and sub-net, are applied to choose the reference set to statistically test which functions (GO terms) are significantly enriched. In Figure 1(B), we conceptually compare our method with the existing methods. We classify ontology analysis methods into three levels: individual gene, gene set and network. Individual gene annotation is based on the available gene information such as DNA sequence, protein structure and associated phenotype to infer the functions of a single gene or a gene product. Software, such as Blast2GO (23) and GoAnnotator (24), helps to annotate genes at this level. GLMs conduct enrichment analysis in a gene set based on hypothesis testing. Tools such as FatiGO (4), DAVID (5), g:profiler (6) and BiNGO (7) belong to this category. Fundamentally different from the existing methods, our NOA is the first computational tool to focus on the functional analysis of link and network. We will show that NOA can find more relevant and specific enriched GO functions and, in particular, can capture the functional change with network rewiring.
METHODS
Link ontology analysis
Links or biomolecular interactions are the building blocks of a biological network. To analyze the function of a network, the first step is to investigate the function of links in the network. As shown in Figure 2, gene ontology is illustrated in rectangles and represented as a directed acyclic graph. The annotation of each node in the network can be obtained from the existing GO annotation database. As a result, genes are annotated by black terms in the corresponding directed acyclic graph. Then our task at hand is to properly define the annotation of link with GO terms from the nodes.
Figure 2.

The schematic plot of the definition of link ontology. Gene ontology is structured as a directed acyclic graph illustrated in rectangle. The annotation of each gene in the network is from GO database. For example, gene gm is annotated by black terms t1, t2, t3, t5 in tree Tm. Our task is to define the function annotation of interactions, e.g. emn based on the annotations of genes. One simple way to annotate links is to calculate the overlap of GO term sets Tm and Tn of the interacting nodes gm and gn, e.g. Tmn = Tm∩Tn.
Mathematically, a given biological network is represented as  , where V is the set of all genes and E is all interactions. For each gene gm∈V, we first retrieve all relevant GO annotations on this gene, and propagate these annotations upward through the GO term hierarchy, i.e. any gene annotated to a certain term tk is also explicitly annotated by all the ancestors of tk. As a result, we have a term list Tm representing all known terms annotating gene gm. Our task is to determine the GO term assignments on all link i.e.
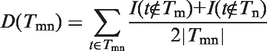
  , where emn represents an edge connecting gm and gm in E, and Tmn represents the set of all terms assigned to the edge emn. Intuitively, reasonable assignment Tmn on emn should be consistent with the gene assignment Tm and Tn on gm and gm. Given Tmn, to quantitatively measure the functional inconsistency, we define the ‘Diversity’ of Tmn as
 |
(1) |
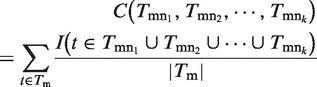
where I is an indicative function, i.e. I equals to one when the corresponding event is true and zero otherwise;  represents the number of terms assigned to the edge emn. We can conclude from the definition that
  should be small in an efficient assignment. Furthermore, the ‘Diversity’ of the assignment on network (all links), i.e.
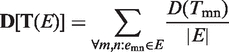
  is defined as the average
  :
:
 |
(2) |
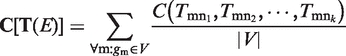
Similarly, we define the ‘Coverage’ of  , which is the average
  , where
  are the indexes of k genes connecting to gene gm.
 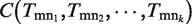 implies the coverage ratio of all functions on node gm, covered by the functions of all edges connecting to gm. Particularly,
 |
(3) |
where  represent function assignments of all edges connecting gm, and
 |
(4) |
From the definition of ‘Coverage’, an efficient assignment should maximize ‘Coverage’. Obviously, both ‘Coverage’ and ‘Diversity’ are within  .
.
Actually, the problem of link ontology analysis is the process of balance ‘Coverage’ and ‘Diversity’. It can be easily proved that the simply GO term overlap strategy Tmn = Tm ∩ Tn is in fact an optimal solution by maximizing ‘Coverage’ subject to ‘Diversity’ at zero (see Supplementary Text S1 for detail). As shown in Figure 2,  ,
,  , but
, but  since t6 is not covered by the union of Tmn and Tnp. Therefore, we have D = 0, and C = 17/18.
Hence, the straightforward way to calculate the overlap of GO term sets for the interacting nodes, naturally assigns functions to a link by maximizing ‘Coverage’ meanwhile minimizing ‘Diversity’. Biologically, this strategy implies that two genes interact with each other to perform a same biological function together. In this paper, we use this simple strategy to define the link ontology in a biological network. Next, we can further define network ontology via regarding the network as a set of links.
Network ontology analysis
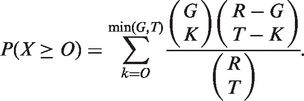
With the above definition for link ontology, we treat the biological network as a set of links. Then network ontology analysis is essentially a statistical test to assess the enrichment of GO terms in this set of links. The calculation procedure is shown in Figure 3. Given two networks, one is the input test network to be annotated and we collect the links in the network as a test set. The other is the reference network as the control for statistical test and we collect the links as a reference set. Given a GO term tk, we count the number of occurrence of tk in the test and reference set respectively. A Venn diagram shows the relationship between the frequency of this GO term in the reference set and the one in the test set. From the diagram, we will infer whether or not the GO term tk is enriched in the test set. There are several statistical models to test this, including but not limited to, hypergeometric test, Fisher’s exact test, binomial and χ². Here, we introduce one of the most popular and powerful methods, hypergeometric test. We suppose there are T links in the test set. Also there are R links in the reference set, and G links in them are annotated by term tk,. Here the null hypothesis is that links with annotation tk have the same probability to fall in the reference set and in the test set. We then treat the overlapping number of links X as a random variable. Under the null hypothesis, X follows a hypergeometric distribution. Then we can calculate a P-value score, which is defined as the probability that the overlapping number would assume a value greater than or equal to the observed value, O, by chance:
 |
(5) |
Figure 3.

Illustration of the network ontology analysis by statistically testing the function enrichment. Simple Venn diagram is drawn for statistical test of network ontology analysis. The test set is all links in the input networks. The reference set is all possible links among genes in the test network for whole-net method by default, or a given background network for sub-net method. Given a GO term, the null hypothesis of the test is that genes with this GO term have the same probability to fall in the reference set and in the test set. R denotes the number of elements in the reference set; G means the number of elements annotated by the given GO term in the reference set; T indicates the number of elements in the test set; O denotes the number of elements annotated by the given GO term in the test set.
The overlapping number is statistically significant if the P-value score is smaller than a chosen cutoff. This process is applied for each GO term to pick out significant ones.
The choice of the reference set is important in the statistical test. We provide two alternative methods in our implementation: whole-net and sub-net method. In the whole-net method, the reference set is chosen as all possible links in the test network, while in the sub-net method, it is chosen as all links in the pre-given background network. Therefore, we can perform two types of NOA, i.e. whole-net NOA and sub-net NOA. As to the correction for multiple hypothesis testing (25), we used the frequently used correction methods: Bonferroni correction.
RESULTS
NOA captures functions in response to network dynamics
One of the important advantages of NOA is that it can monitor the link dynamics in networks. More and more evidence shows that the same set of genes may form different networks in response to temporal and spatial conditions (19–21,26,27). In this case, the traditional gene list-based functional enrichment analysis always reports the same result when the networks have the same node set but rewired structures. In contrast, NOA can detect such function changes caused by network structure change, and further capture the functional differences by fully taking advantage of the topology information of networks. In this section, we will introduce two applications to illustrate the advantage of NOA.
Example 1: dynamic transcription factor cooperation networks
Recently, Luscombe et al. (19) developed a method to uncover the conditional-specific transcription regulatory network by integrating transcriptional regulatory information and gene expression data in yeast. Particularly, they first constructed a static background network which contains 7074 regulatory interactions among 142 transcription factors and 3420 target genes by assembling known regulatory interactions from the results of genetic, biochemical and chromatin immunoprecipitation (ChIP)–chip experiments, and then integrated gene expression data of five conditions including cell cycle, sporulation, diauxic shift, DNA damage and stress response to reconstruct regulatory networks in each condition. As shown in Figure 1(A3), there are large changes of the regulatory network architecture in cell cycle and sporulation processes of Saccharomyces cerevisiae. Their results provide strong evidence that most gene functions arise in response to changing conditions and the rewired network structures.
Here, we study whether or not the change of networks can be revealed by gene ontology enrichment analysis. Not surprisingly, both GLM and NOA can capture the difference between the two types of biological processes (cell cycle and sporulation) because significantly expressed genes are different in the two stages [refer to left figure of Figure 1(A3)]. Particularly, we use NOA and GLM to test whether GO term ‘cell-cycle process- is enriched in cell-cycle regulatory network comparing with the background network. The P-value is 3.6e-27 for NOA and 2.4e-23 for GLM. Similarly, P-values for GO term ‘sporulation’ in sporulation transcription regulatory network is 1.3e-14 for NOA and 3.8e-20 for GLM. Both the methods work well, because the main differences between the two networks are basically in nodes.
However, our question is if or not we can judge the stage of a cell with relatively incomplete information, e.g. without the information of target genes. We further construct transcription factor (TF) co-regulatory networks (28) via adding an edge between two TFs if they have at least one common target gene. This process is carried out in cell cycle, sporulation and background transcription regulatory networks, and correspondingly results in the three TF co-regulatory networks, i.e. cell cycle co-regulatory network [Figure 4(A1)], sporulation co-regulatory network [Figure 4(B1)], and background co-regulatory network [right figure of Figure 1(A3)]. As shown in Figure 4(A1) and (B1), cell-cycle TF co-regulatory network contains 67 TFs and 319 co-regulations, while sporulation TF co-regulatory network contains 70 TFs and 302 cooperations (refer to Supplementary Table S1 for detail). Most of the nodes in the two networks are the same (black nodes). Given this, we compare results of four methods, i.e. whole-net NOA, sub-net NOA, whole-net GLM and sub-net GLM, in TF co-regulatory networks in response to both cell cycle and sporulation. As shown in Table 1, the four methods are different in terms of the choice of test set and reference set. Here, the test set is chosen as all links in NOA, and all genes with links in GLM. Sub-net means choosing background network (union of all possible co-regulatory networks) as the reference set in NOA, and choosing all TFs in the background network in GLM. Whole-net means choosing clique (there is a link between every two nodes) as the reference set in NOA, and choosing all yeast genes in GLM. The comparison results are shown in Figure 4 (refer to Supplementary Table 2S for detailed results). Figure 4(A2) shows the rank of all related terms by different methods in cell-cycle co-regulatory network. Pink bar stands for significant terms with P-value less than 0.05, and red horizontal bar shows the position of GO:0022402 (cell-cycle process). We can find that whole-net NOA, whole-net GLM and sub-net NOA report this term as significant term, but sub-net GLM fails. The corresponding P-value of this term is shown in Figure 4(A3). Additionally, whole-net NOA ranks GO:0022402 as top 5% which is much better than whole-net GLM 20%, although both of them report GO:0022402 as significant. Similarly, Figure 4(B2) and (B3) shows the significant tendency that NOA methods are better than GLM methods in identifying biologically reasonable functions of rewiring regulatory networks. To further prove the efficiency of NOA in rewiring networks, we compare NOA and GLM in a rewiring protein interaction network as follows.
Figure 4.

Applications of NOA on yeast TF co-regulatory networks. (A) NOA results on the yeast TF co-regulatory network in response to cell-cycle condition. (A1) illustrates the TF co-regulatory network. We construct TF co-regulatory networks by defining the TF co-regulation relationship if two TFs regulate at least one common target. (A2, A3) shows the comparison between NOA and gene list methods (GLM). (A2) presents the rank of all related GO terms in the four methods. Pink part represents significant terms with P-value less than 0.05, and the position of GO:0022402 (cell-cycle process) is shown by a red horizontal bar. (A3) shows P-values of GO:0022402 reported by the four methods. (B) NOA results on the yeast TF co-regulatory network in response to sporulation condition. (B2) The position of GO:0043934 (sporulation) is shown by a blue horizontal bar. (B3) shows P-values of GO:0043934 reported by four methods. The red dash line is the base line of –log(0.05).
Table 1.
Test set and reference set of the four types of GO analysis methods: whole-net NOA, sub-net NOA, whole-net gene list method and sub-net gene list method
| Whole-net | Sub-net | |
|---|---|---|
| NOA | ||
| Test set | Link list | Link list |
| Reference set | Clique | Background network |
| GLM | ||
| Test set | Gene list | Gene list |
| Reference set | Yeast gene | Gene in background network |
NOA denotes the method we proposed in this article and GLM means gene list-based method.
Example 2: rewiring protein interaction networks
We identified the rewired protein interaction networks during the progression of Alzheimer’s disease (AD), which is a complex genetic disorder on nervous system affecting millions of elderly individuals worldwide (29). Clinically, AD is categorized into three stages: incipient, moderate and severe stages. More and more evidence indicates that the three stages have different features in molecular level (30,31). In our previous research work, we identified the different protein interaction networks in the three development stages via an edge-expansion scheme by combining protein interaction and microarray data (26). Traditional gene list-based methods can give enriched GO terms, such as regulation of transcription and DNA-dependent (refer to Table 2), which are, however, identical on all of the three stages, i.e. they cannot distinguish the dysfunctional differences among the three stages. By comparison, we use whole-net NOA to analyze the three networks respectively. The results show different enriched biological processes for the protein interaction networks in three different stages. For instance, in the incipient stage, the protein interactions are annotated to perform the processes of vesicle-medicated transport and regulation of phosphorylation, etc., which implies AD dysfunctional progression of peptide cleavage and deposition (32). Regulation of kinase activity becomes the most enriched GO function which indicates the importance of regulation of phosphorylation in neurons during the AD development stage (33). Sterol transport, apoptosis and proteolysis are identified as the top-three ranked terms for the protein network in the severe stage. This provides evidence for neuron cell death and protein degradation in the serious disease stage of AD (30). Collectively, we can monitor the function change in various disease stages by NOA, which outperforms GLM.
Table 2.
The functional characterization of protein interaction networks during Alzheimer’s disease progression revealed by NOA and GLM
| Network type | GO term (BP) | Description |
|---|---|---|
| Incipient | ||
| NOA | GO:0016192 | Vesicle-mediated transport |
| GO:0042325 | Regulation of phosphorylation | |
| GO:0005979 | Regulation of glycogen biosynthetic process | |
| GLM | GO:0006355 | Regulation of transcription, DNA dependent |
| GO:0045944 | Positive regulation of transcription from RNA polymerase II promoter | |
| GO:0007242 | Intracellular signaling cascade | |
| Moderate | ||
| NOA | GO:0043549 | Regulation of kinase activity |
| GO:0048589 | Developmental growth | |
| GO:0006897 | Endocytosis | |
| GLM | GO:0006916 | Anti-apoptosis |
| GO:0007165 | Signal transduction | |
| GO:0006355 | Regulation of transcription, DNA dependent | |
| Severe | ||
| NOA | GO:0015918 | Sterol transport |
| GO:0006915 | Apoptosis | |
| GO:0006509 | Membrane protein ectodomain proteolysis | |
| GLM | GO:0006355 | Regulation of transcription, DNA dependent |
| GO:0006629 | Lipid metabolic process | |
| GO:0045944 | Positive regulation of transcription from RNA polymerase II promoter |
We manually choose top three non-reduplicated terms in the results by these two methods. Here, AD means Alzheimer’s disease and BP means biological process.
NOA identifies specific functions
In addition to capture the function difference due to network rewiring, NOA can also be used in traditional static networks to find more specific GO annotations. The rationale is that NOA considers the interactions among the genes to allow the biological interpretation to be focused at the ‘biological network’ level. In this section, we will introduce two applications to demonstrate such an advantage of NOA.
Example 1: KEGG pathway
The first example is the comparison of NOA and GLM in Kyoto Encyclopedia of Genes and Genomes (KEGG) pathway (34,35). KEGG aims to uncover higher-order systemic behaviors of the cell by collecting reliable pathways, which is a valuable material for assessing NOA because the functions of the pathways have been well studied (34,35).
As a proof-of-concept example, we focus on a specific pathway hsa05212, which is related to pancreatic cancer in Homo sapiens, and consists of 33 interactions. It is well known that tumor-related genes are important and tend to have many functions (36). So, we use this example to show that NOA can capture specified functions of the cancer by considering links among genes. Since one interactor in KEGG pathway may consist of multiple genes (in total there are 70 genes involved), we define the functions of an interactor by uniting functions of all related genes, and then apply whole-net NOA to analyze the function of the pathway. For comparison, we use g:profiler (6) to annotate the genes involved in this pathway. Top 20 significant biological processes terms of the two approaches are extracted and listed in Supplementary Table S3. NOA captures the main feature of cancer, regulation of signal transduction, regulation of signaling process and anti-apoptosis (37), while g:profiler annotates these cancer genes by terms such as intracellular signaling cascade, positive regulation of cellular process and signaling.
To quantitatively show the difference of the results generated by the two methods, we define ‘specificity’ for each GO term as the distance between the given term and the top term (biological process) in the GO hierarchy, i.e. in which level the term locates in GO directed acyclic graph. As shown in Figure 5(A), clearly NOA can identify the term which has much deeper level than GLMs (P-value = 0.0028 by rank-sum test). To visualize the comparison, we pick out and side by side compare the top five significant GO terms by NOA and by GLM, respectively, in the subgraph of GO-directed acyclic structure (refer to Figure 6). Specifically, we first retrieve all ancestors of the 10 terms according to GO structure, and add relationships among these terms by directed edges. Then we highlight the top five terms of NOA, top five terms of GLM, top 20 terms of NOA (without top five) and top 20 terms of GLM (without top five) with dark yellow, dark green, buff and light green, respectively. Figure 6 clearly shows that NOA tends to give more specific annotations than GLM. For example, tumor is related to apoptosis, GLM ranks the term ‘regulation of apoptosis’ as top 20, but GLM cannot tell whether the pathway promotes apoptosis or represses apoptosis. NOA can be more specific according to rank ‘anti-apoptosis’ as top 5.
Figure 5.

Box plot to compare the specificity of the functional annotations revealed by NOA and gene list method. (A) Top 20 functional terms revealed by NOA and gene list method for pancreatic cancer pathway. (B) Top 20 functional terms identified by NOA and gene list method for aging network. The y-axis means the distance from a given term to the top term in GO structure, i.e. in which level the term locates to indicate the specificity of the functional term. Terms in deeper level are considered more specific.
Figure 6.

Comparison of results by NOA and GLM in pancreatic cancer pathway. Specifically we pick out the top five GO terms revealed by NOA and GLM [g:profiler (6)] and then side by side compare them in the GO-directed acyclic structure. Top five terms of NOA are highlighted by dark yellow, while top five by GLM are colored in dark green. Besides, terms labeled as buff are within top 20 in NOA results, and light green ones are within top 20 by GLM. The results show that NOA identifies more specific annotations in deeper levels of the GO hierarchy.
Furthermore, to check whether NOA is better than GLM in other KEGG pathways, we try these two methods in all human KEGG pathways to evaluate the statistical efficiency of the methods. There are totally 226 human pathways collected in KEGG by now, during which 91 contain more than 30 interactions. Both NOA and GLM are applied on these 91 pathways to rank related GO terms. All top 10 terms reported by NOA for these pathways are extracted and compared with that reported by GLM in specificity. Supplementary Figure S1 shows that results of NOA have a significantly higher specificity than GLM, and the corresponding P-value is <2.7e-6 by Wilcoxon rank-sum test. This large-scale study strongly supports our conclusion that NOA outperforms GLM by revealing more specific functions for biological networks.
Example 2: aging network
Another example is the analysis of aging network (refer to Supplementary Table S4). We assembly the aging network by identifying the genes related to aging then add a link if two genes interact with each other (16). In our previous work, we have shown that aging networks have close relationship with disease networks (16). Here, perform ontology enrichment analysis with NOA and traditional GLM, respectively, and compare them. We find that two methods give different rank of GO terms (detailed results can be found in Supplementary Table S5). For instance, GLM prioritizes cell death, while NOA prioritizes metabolic process, which is biologically more reasonable. Furthermore, we compare the specificity of the function annotations revealed by the two methods. As shown in Figure 5(B), GO terms identified by NOA are averagely more specific than GLM, i.e. these terms are in much deeper levels in GO hierarchy (P-value = 0.0051 by rank-sum test).
Web server for NOA
Based on the above result, we believe that NOA is a potential powerful tool to study the condition-specific function of subnetworks and capture the function dynamics by network rewiring. Given the rapid advances of network biology studies, it is in pressing need for network ontology analysis. Thus, we implement NOA as a freely accessible web server, which is a collection of tools for whole-net NOA, sub-net NOA, whole-net GLM and subnet GLM. For whole-net methods, users can input either a gene list or a gene network, i.e. a link list by pasting in the text box or uploading a data file from their local disk, and then the web server will return the resulting rank of GO terms. Differently, for sub-net methods, reference gene list or reference network is also necessary in addition to the input of test gene list or test gene network.
It is worth mentioning that reference set is required to contain test set to make the Equation (5) valid to ensure biologically meaningful results. The default reference set is the fully connected network. Two parameters, species and cutoff for P-value, should be specified by users according to their own needs. Currently, NOA supports four types of species including H. sapiens, Mus musculus, Rattus norvegicus and Saccharomyces cerevisiae.
As shown in Figure 7, the output of NOA is a ranked GO term list of biological processes (BP), cellular components (CC) and molecular functions (MF), additional with corresponding value of G, R, T, O in Formula (1), P-values, corrected P-values and related genes or links. Top 10 GO terms are highlighted in the resulting table. In addition, the rank of the significant GO terms can be downloaded via a hyperlink provided in the web page.
Figure 7.

The interface of web server for NOA. NOA is designed as a web tool to provide public service for network ontology analysis. Users can input networks via either directly pasting link list or uploading files. The web server will output all significant GO terms of biological processes (BP), cellular components (CC) and molecular functions (MF).
DISCUSSION
In this paper, we propose a novel function annotation tool for biological network, which is able to provide specific function annotations for the corresponding biological system. One of the main contributions of our new method is to alleviate the nonspecificity problem due to the redundant nature of functional annotations. Usually when we obtain a large ‘interesting’ gene list by high-throughput techniques, the real biological insights are hidden in the large amount of general, redundant and nonspecific GO function annotations. We note that there are a lot of efforts to deal with this problem. For example, the newly developed Functional Annotation Clustering of DAVID (5) groups similar annotations together to reduce the redundancy. Here, our NOA adopts a very different strategy by highlighting the interactions among the genes (edges) for a given large gene list. We believe that the interactions among genes are biological meaningful and make the biology insights clearer and more focused in a specific condition.
NOA is also helpful to reveal more specific function annotation. In many cases, one single gene can be annotated by multiple functions. There is plenty of evidence to show that interactions play important biological roles to further make a distinction between the functions of single genes. For example, Cmd1 in ref. 38 is a date hub and connecting with four modules, homeostasis of other cations, cell polarity and filament formation, endoplasmic reticulum and protein folding and stabilization in four different conditions. We do not know precisely the biological function of Cmd1 if we only check individual gene. To overcome such difficulty, NOA infers specific functions by considering these neighbor genes interacting with Cmd1 in different conditions. Another example is that gene or protein may take several part-time jobs. For instance, eIF3f is an important housekeeping gene and is necessary for initiation of translation. Recent study shows that eIF3f has also dual role acting positively on Notch signal transduction by interacting with other genes (39). NOA can recognize its correct function by examining its neighbor molecules in different working environment.
The link ontology is important in the concept of our network ontology analysis. Therefore, it is crucial to well define functions of links. In fact, a similar concept ‘edge ontology’ or ‘arrow ontology’ has been suggested by a forward-looking work (40). Inspired by the gene ontology, Lu et al. aim to build a similar hierarchical term structure for edges. In their prototype of edge ontology, edges are partitioned in four levels: direction, type, sub-type and specification. The complete edge ontology will provide a relatively explicit representation of the connections among genes in addition to revealing relationships among edges. However, edge ontology is still far from complete to describe the functional relationship in the network. In contrast, we note that gene ontology has contained 32 862 terms and 2 753 338 annotations up to now. Therefore, NOA takes different strategy to define the function of edges based on existing rich GO terms instead of making a fresh start. To distinguish with previous edge ontology definition, we name the ontology defined in this paper as ‘link ontology’. Here, we simply take the overlap of the GO term set of the two nodes to define the GO annotation of a link. This strategy is simple, easy to implement and accurate. The possible disadvantage is that the ‘Coverage’ may be low. In fact, we can also build a general integer programming model to define link ontology by optimizing both D and C and considering the GO hierarchical structure (41,42) (refer to the Supplementary Text S2 for detail). Importantly, our new model can integrate more information to predict link ontology in a larger ‘Coverage’ without a significant increase of computational cost. Given the fact that the annotations of gene function are far from complete (43), NOA is an important step toward annotating functions on a biological system since it actually offers a novel way to infer edge function additional with gene function.
The choice of reference set allows NOA to report specific significant terms in different levels according to the users’ need. Choosing all possible links within given nodes as the background is to avoid possible bias. For example, some genes such as P53 and c-Myc are very important; so, many studies focus on these kinds of genes (44). Accordingly, many functions are annotated on these genes. On the other hand, functions of other genes are barely characterized. To our knowledge some methods, such as BiNGO, try to reduce this bias via choosing an appropriate subnetwork. The choice of a reference set is still an open problem in the functional enrichment analysis. Currently, the computational complexity of NOA is O(n2), where n is the number of genes in the input network. There is still room for further improvement by sampling random networks, which seem to be more reasonable since the random process has no bias.
In our paper, we showed that NOA is helpful to capture the function change by network rewiring. Here, network rewiring means the change of existence for the links. However, in many cases, biological networks change by the weights of links instead of their existence; so it is necessary to further extend NOA to handle weighted networks. An intuitive idea is to enhance the role of links with larger weights by duplicating the GO terms annotated on them. As a result, the numbers in Equation (5) can be recounted accordingly for the statistical test. In addition to weighted networks, we note that directed networks are also important in many biological systems. In the current NOA, we handle directed networks by treating them as its corresponding undirected network. This will not fully utilize the edge information, and we will introduce more precise model to functionally annotate directed network in our further work.
Another direction of improvement is to consider more about the relationships or correlations among GO terms. This is important because relationships among GO terms are represented by an acyclic digraph, and simply propagating these annotations upward through the GO term hierarchy or treating the GO terms independently in statistical test will lose certain information. If more information can be added in the analysis process, the results will be more meaningful. Besides, the concept of network ontology on edge can be extended to super-graph whose edge may be consisted of more than two nodes. If we consider a module as a basic element to carry out functions, it will be plausible to define ‘module ontology’ rather than ‘link ontology’ to do supergraph ontology analysis. Lastly, in our model, we consider a network as a collection of links. It may also be meaningful to consider node and edge at the same time. In summary, there is still much room to extent the current network ontology analysis framework.
CONCLUSIONS
We proposed a novel GO functional enrichment analysis method for biological network analysis. Our method is different from the traditional methods by considering the additional biological significance of molecular interactions. First, we proposed a novel scheme to infer link ontology from gene ontology by optimizing two indexes ‘Diversity’ and ‘Coverage’. Based on the link ontology, we gave two alternative approaches to implement network ontology analysis, i.e. whole-net and sub-net NOA. To prove the effectiveness of NOA, we applied it in several real biological networks. The results show that NOA can reveal much reasonable biological meanings than GLM in both dynamic networks and static networks. Furthermore, we developed a freely accessible web server for NOA, which allows network ontology analysis online and can help researchers to identify specific and efficient GO terms in their practical usage.
SUPPLEMENTARY DATA
Supplementary Data are available at NAR Online.
FUNDING
This work is supported by grant no. 60873205 (to X.S.Z. and J.W.); grant No. 10801131 (to Z.P.L. and Y.W.); grant no. 60970091 from NSFC (to Y.W. and L.Y.W.); grant kjcs-yw-s7 from CAS (to X.S.Z., L.Y.W. and Y.W.); the Chief Scientist Program of SIBS from CAS under (grant no. 2009CSP002), the Knowledge Innovation Program of CAS under (grant no. KSCX2-EW-R-01 and NSFC under grants no. 61072149 and 91029301); Shanghai NSF under (grant no.11ZR1443100 to Z.P.L. and L.C); and by FIRST Program of Japan. Funding for open access charge: NSFC (grant no. 91029301 and grant no. 60873205).
Conflict of interest statement. None declared.
Supplementary Material
ACKNOWLEDGEMENTS
We thank the anonymous reviewers for useful suggestions. J.W. and L.C. conceived and designed the experiments. J.W. performed the experiments. Q.H. and J.W. constructed the web server. J.W., Z.-P.L. and Y.W. analyzed the data and wrote the paper. X.-S.Z. and L.C. revised the manuscript. L.-Y.W. read the manuscript, and gave valuable suggestions.
REFERENCES
- 1.Ashburner M, Ball CA, Blake JA, Botstein D, Butler H, Cherry JM, Davis AP, Dolinski K, Dwight SS, Eppig JT, et al. Gene Ontology: tool for the unification of biology. Nat. Genet. 2000;25:25–29. doi: 10.1038/75556. [DOI] [PMC free article] [PubMed] [Google Scholar]
- 2.Huang DW, Sherman BT, Lempicki RA. Bioinformatics enrichment tools: paths toward the comprehensive functional analysis of large gene lists. Nucleic Acids Res. 2009;37:1–13. doi: 10.1093/nar/gkn923. [DOI] [PMC free article] [PubMed] [Google Scholar]
- 3.Khatri P, Draghici S. Ontological analysis of gene expression data: current tools, limitations, and open problems. Bioinformatics. 2005;21:3587–3595. doi: 10.1093/bioinformatics/bti565. [DOI] [PMC free article] [PubMed] [Google Scholar]
- 4.Al-Shahrour F, Diaz-Uriarte R, Dopazo J. FatiGO: a web tool for finding significant associations of Gene Ontology terms with groups of genes. Bioinformatics. 2004;20:578–580. doi: 10.1093/bioinformatics/btg455. [DOI] [PubMed] [Google Scholar]
- 5.Dennis G, Jr, Sherman BT, Hosack DA, Yang J, Gao W, Lane HC, Lempicki RA. DAVID: database for annotation, visualization, and integrated discovery. Genome Biol. 2003;4:3. [PubMed] [Google Scholar]
- 6.Reimand J, Kull M, Peterson H, Hansen J, Vilo J. g:Profiler – a web-based toolset for functional profiling of gene lists from large-scale experiments. Nucleic Acids Res. 2007;35:W193–W200. doi: 10.1093/nar/gkm226. [DOI] [PMC free article] [PubMed] [Google Scholar]
- 7.Maere S, Heymans K, Kuiper M. BiNGO: a Cytoscape plugin to assess overrepresentation of Gene Ontology categories in Biological Networks. Bioinformatics. 2005;21:3448–3449. doi: 10.1093/bioinformatics/bti551. [DOI] [PubMed] [Google Scholar]
- 8.Du Z, Zhou X, Ling Y, Zhang Z, Su Z. agriGO: a GO analysis toolkit for the agricultural community. Nucleic Acids Res. 2010;38:W64–W70. doi: 10.1093/nar/gkq310. [DOI] [PMC free article] [PubMed] [Google Scholar]
- 9.Chen L, Wang RS, Zhang XS. Biomolecular Networks: Methods and Applications in Systems Biology. Hoboken, NJ: John Wiley & Sons; 2009. [Google Scholar]
- 10.Kitano H. Systems biology: a brief overview. Science. 2002;295:1662–1664. doi: 10.1126/science.1069492. [DOI] [PubMed] [Google Scholar]
- 11.Barabasi AB, Oltvai ZN. Network biology: understanding the cell’s functional organization. Nat. Rev. 2004;5:101–113. doi: 10.1038/nrg1272. [DOI] [PubMed] [Google Scholar]
- 12.Chen L, Wang RQ, Aihara K. Modeling Biomolecular Networks in Cells: Structures and Dynamics. London: Springer; 2010. [Google Scholar]
- 13.Stelzl U, Worm U, Lalowski M, Haenig C, Brembeck FH, Goehler H, Stroedicke M, Zenkner M, Schoenherr A, Koeppen S, et al. Human protein–protein interaction network: a resource for annotating the proteome. Cell. 2005;122:957–968. doi: 10.1016/j.cell.2005.08.029. [DOI] [PubMed] [Google Scholar]
- 14.Hasty J, McMillen D, Isaacs F, Collins JJ. Computational studies of gene regulatory networks: in numero molecular biology. Nat. Rev. Genet. 2001;2:268–279. doi: 10.1038/35066056. [DOI] [PubMed] [Google Scholar]
- 15.Ravasz E, Someraz AL, Mongru DA, Oltvai ZN, Barabasi AL. Hierarchical organization of modularity in metabolic networks. Science. 2002;297:1551–1555. doi: 10.1126/science.1073374. [DOI] [PubMed] [Google Scholar]
- 16.Wang J, Zhang S, Wang Y, Chen L, Zhang XS. Disease-aging network reveals significant roles of aging genes in connecting genetic diseases. PLoS Comput. Biol. 2009;5:e1000521. doi: 10.1371/journal.pcbi.1000521. [DOI] [PMC free article] [PubMed] [Google Scholar]
- 17.Jerby L, Shlomi T, Ruppin E. Computational reconstruction of tissue-specific metabolic models: application to human liver metabolism. Mol. Syst. Biol. 2010;6:401. doi: 10.1038/msb.2010.56. [DOI] [PMC free article] [PubMed] [Google Scholar]
- 18.Wang K, Saito M, Bisikirska BC, Alvarez MJ, Lim WK, Rajbhandari P, Shen Q, Nemenman I, Basso K, Margolin AA, et al. Genome-wide identification of posttranslational modulators of transcription factor activity in human B cells. Nat. Biotechnol. 2009;27:829–837. doi: 10.1038/nbt.1563. [DOI] [PMC free article] [PubMed] [Google Scholar]
- 19.Luscombe NM, Babu MM, Yu H, Snyder M, Teichmann SA, Gerstein MA. Genomic analysis of regulatory network dynamics reveals large topological changes. Nature. 2004;431:308–312. doi: 10.1038/nature02782. [DOI] [PubMed] [Google Scholar]
- 20.Bossi A, Lehner B. Tissue specificity and the human protein interaction network. Mol. Syst. Biol. 2009;5:260. doi: 10.1038/msb.2009.17. [DOI] [PMC free article] [PubMed] [Google Scholar]
- 21.Zhang Q, Simonis N, Li QR, Charloteaux B, Heuze F, Klitgord N, Tam S, Yu H, Venkatesan K, Mou D, et al. Edgetic perturbation models of human inherited disorders. Mol. Syst. Biol. 2009;5:321. doi: 10.1038/msb.2009.80. [DOI] [PMC free article] [PubMed] [Google Scholar]
- 22.Perissi V, Aggarwal A, Glass CK, Rose DW, Rosenfeld MG. A corepressor/coactivator exchange complex required for transcriptional activation by nuclear receptors and other regulated transcription factors. Cell. 2004;116:511–526. doi: 10.1016/s0092-8674(04)00133-3. [DOI] [PubMed] [Google Scholar]
- 23.Conesa A, Gotz S, Garcia-Gomez JM, Terol J, Talon M, Robles M. Blast2GO: a universal tool for annotation, visualization and analysis in functional genomics research. Bioinformatics. 2005;21:3674–3676. doi: 10.1093/bioinformatics/bti610. [DOI] [PubMed] [Google Scholar]
- 24.Couto FM, Silva MJ, Lee V, Dimmer E, Camon E, Apweiler R, Kirsch H, Rebholz-Schuhmann D. GOAnnotator: linking protein GO annotations to evidence text. J. Biomed. Discov. Collab. 2006;1:19. doi: 10.1186/1747-5333-1-19. [DOI] [PMC free article] [PubMed] [Google Scholar]
- 25.Shaffer JP. Multiple hypothesis testing. Ann. Rev. Psych. 1995;46:561–584. [Google Scholar]
- 26.Liu ZP, Wang Y, Wen T, Zhang ZS, Xia W, Chen L. Dynamically dysfunctional protein interactions in the development of Alzheimer’s disease. Proceedings of the 2009 IEEE International Conference on Systems, Man, and Cybernetics. 2009:4262–4267. [Google Scholar]
- 27.Kirouac DC, Ito C, Csaszar E, Roch A, Yu M, Sykes EA, Bader GD, Zandstra PW. Dynamic interaction networks in a hierarchically organized tissue. Mol. Syst. Biol. 2010;6:417. doi: 10.1038/msb.2010.71. [DOI] [PMC free article] [PubMed] [Google Scholar]
- 28.Wang Y, Zhang XS, Xia Y. Predicting eukaryotic transcriptional cooperativity by Bayesian network integration of genome-wide data. Nucleic Acids Res. 2009;37:5943–5958. doi: 10.1093/nar/gkp625. [DOI] [PMC free article] [PubMed] [Google Scholar]
- 29.Goedert M, Spillantini MG. A century of Alzheimer’s disease. Science. 2006;314:777–781. doi: 10.1126/science.1132814. [DOI] [PubMed] [Google Scholar]
- 30.Blalock EM, Geddes JW, Chen KC, Porter NM, Markesbery WR, Landfield PW. Incipient Alzheimer's disease: microarray correlation analyses reveal major transcriptional and tumor suppressor responses. Proc. Natl Acad. Sci. USA. 2004;101:2173–2178. doi: 10.1073/pnas.0308512100. [DOI] [PMC free article] [PubMed] [Google Scholar]
- 31.Leroy K, Yilmaz Z, Brion JP. Increased level of active GSK-3β in Alzheimer’s disease and accumulation in argyrophilic grains and in neurones at different stages of neurofibrillary degeneration. Neuropathol. Appl. Neurobiol. 2007;33:43–55. doi: 10.1111/j.1365-2990.2006.00795.x. [DOI] [PubMed] [Google Scholar]
- 32.Selkoe DJ. Alzheimer’s disease: genes, proteins, and therapy. Physiol. Rev. 2001;81:741–766. doi: 10.1152/physrev.2001.81.2.741. [DOI] [PubMed] [Google Scholar]
- 33.Grant P, Pant HC. Topographic regulation of kinase activity in Alzheimer’s disease brains. J. Alzheimers Dis. 2002;4:269–281. doi: 10.3233/jad-2002-4402. [DOI] [PubMed] [Google Scholar]
- 34.Kanehisa M, Goto S, Furumichi M, Tanabe M, Hirakawa M. KEGG for representation and analysis of molecular networks involving diseases and drugs. Nucleic Acids Res. 2010;38:D355–D360. doi: 10.1093/nar/gkp896. [DOI] [PMC free article] [PubMed] [Google Scholar]
- 35.Kanehisa M, Goto S. KEGG: Kyoto encyclopedia of genes and genomes. Nucleic Acids Res. 2000;28:27–30. doi: 10.1093/nar/28.1.27. [DOI] [PMC free article] [PubMed] [Google Scholar]
- 36.Jonsson PF, Bates PA. Global topological features of cancer proteins in the human interactome. Bioinformatics. 2006;22:2291. doi: 10.1093/bioinformatics/btl390. [DOI] [PMC free article] [PubMed] [Google Scholar]
- 37.Kerr JF, Winterford CM, Harmon BV. Apoptosis. its significance in cancer and cancer therapy. Cancer. 1994;73:2013–2026. doi: 10.1002/1097-0142(19940415)73:8<2013::aid-cncr2820730802>3.0.co;2-j. [DOI] [PubMed] [Google Scholar]
- 38.Han JD, Bertin N, Hao T, Goldberg DS, Berriz GF, Zhang LV, Dupuy D, Walhout AJ, Cusick ME, Roth FP, et al. Evidence for dynamically organized modularity in the yeast protein–protein interaction network. Nature. 2004;430:88–93. doi: 10.1038/nature02555. [DOI] [PubMed] [Google Scholar]
- 39.Inman M. Protein’s “part-time job” reveals new facet of signaling pathway. PLoS Biol. 2010;8:e1001001. doi: 10.1371/journal.pbio.1001001. [DOI] [PMC free article] [PubMed] [Google Scholar]
- 40.Lu LJ, Sboner A, Huang YJ, Lu HX, Gianoulis TA, Yip KY, Kim PM, Montelione GT, Gerstein MB. Comparing classical pathways and modern networks: towards the development of an edge ontology. Trends Biochem. Sci. 2007;32:320–331. doi: 10.1016/j.tibs.2007.06.003. [DOI] [PubMed] [Google Scholar]
- 41.Lerman G, Shakhnovich BE. Defining functional distance using manifold embeddings of gene ontology annotations. Proc. Natl Acad. Sci. USA. 2007;104:11334–11339. doi: 10.1073/pnas.0702965104. [DOI] [PMC free article] [PubMed] [Google Scholar]
- 42.Couto FM, Silva MJ, Coutinho PM. Measuring semantic similarity between Gene Ontology terms. Data & knowledge engineering. 2007;61:137–152. [Google Scholar]
- 43.Sharan R, Ulitsky I, Shamir R. Network-based prediction of protein function Mol. Syst. Biol. 2007;3:88. doi: 10.1038/msb4100129. [DOI] [PMC free article] [PubMed] [Google Scholar]
- 44.Hollstein M, Sidransky D, Vogelstein B, Harris CC. p53 mutations in human cancers. Science. 1991;253:49–53. doi: 10.1126/science.1905840. [DOI] [PubMed] [Google Scholar]
Associated Data
This section collects any data citations, data availability statements, or supplementary materials included in this article.