

Abstract
Rare circulating tumor cells (CTCs) are present in the blood of patients with metastatic epithelial cancers but have been difficult to measure routinely. We report a quantitative automated imaging system for analysis of prostate CTCs, taking advantage of prostate-specific antigen (PSA), a unique prostate tumor–associated marker. The specificity of PSA staining enabled optimization of criteria for baseline image intensity, morphometric measurements, and integration of multiple signals in a three-dimensional microfluidic device. In a pilot analysis, we detected CTCs in prostate cancer patients with localized disease, before surgical tumor removal in 8 of 19 (42%) patients (range, 38 to 222 CTCs per milliliter). For 6 of the 8 patients with preoperative CTCs, a precipitous postoperative decline (<24 hours) suggests a short half-life for CTCs in the blood circulation. Other patients had persistent CTCs for up to 3 months after prostate removal, suggesting early but transient disseminated tumor deposits. In patients with metastatic prostate cancer, CTCs were detected in 23 of 36 (64%) cases (range, 14 to 5000 CTCs per milliliter). In previously untreated patients followed longitudinally, the numbers of CTCs declined after the initiation of effective therapy. The prostate cancer–specific TMPRSS2-ERG fusion was detectable in RNA extracted from CTCs from 9 of 20 (45%) patients with metastatic disease, and dual staining of captured CTCs for PSA and the cell division marker Ki67 indicated a broad range for the proportion of proliferating cells among CTCs. This method for analysis of CTCs will facilitate the application of noninvasive tumor sampling to direct targeted therapies in advanced prostate cancer and warrants the initiation of long-term clinical studies to test the importance of CTCs in invasive localized disease.
INTRODUCTION
Circulating tumor cells (CTCs) are shed by both primary and metastatic cancers and they are thought to mediate the hematogenous spread of cancer to distant sites, including bone, lung, brain, and liver. Because these cells are extremely rare and mixed with normal blood components, technological hurdles have limited their isolation and characterization. Little is known about the timing of CTC release from primary tumors, their heterogeneity, their functional properties, and the degree to which they are representative of either primary or metastatic tumor deposits. However, CTCs are a potential source of cells derived from metastatic cancers that can be analyzed repeatedly and noninvasively (that is, a “liquid biopsy” for epithelial cancers), and their presence in early cancers that have not yet metastasized may indicate vascular invasion; these features could prove useful in the clinical management of cancer.
Multiple approaches have been used to detect CTCs, ranging from cell size–based separation to the use of immunomagnetic beads conjugated with an antibody to EpCAM, a commonly expressed epithelial cell surface marker (1–6). Each of these approaches has intrinsic limitations: CTCs are not universally larger than all leukocytes, and cell surface expression of EpCAM is heterogeneous and even absent in some tumor types. Most CTC isolation technologies require cell fixation, which restricts detailed RNA-based molecular assays and precludes functional analyses. Moreover, most approaches have been hampered by low yield and low purity of isolated CTCs, reflecting the fact that these cells are very rare (1 in 109 blood cells) and do not readily survive multistep batch purification. To date, the low number of isolated CTCs (median, ≤1 CTC/ml) has restricted most studies to the use of prognostic endpoints rather than quantitating CTC concentrations to monitor therapeutic responses in individual patients; thus, the detection of CTCs by immunomagnetic enrichment in patients with metastatic prostate cancer is associated with poor overall survival, but monitoring CTCs to guide therapeutic choices has not been established (3, 5, 7–9). In localized prostate cancer, immunomagnetic enrichment is less useful because the numbers of CTCs in these patients were similar to numbers of CTCs in men without prostate cancer (10).
We recently developed a microfluidic device that provides improved yield and purity of captured CTCs (11). This CTC-Chip has a surface area of 970 mm2 containing an array of 78,000 microposts, which are made chemically active by coating them with antibodies to EpCAM. The flow kinetics of the device are optimized for minimal shear forces and maximal contact between cells and the functionalized microposts; EpCAM-expressing CTCs bind to the microposts, whereas leukocytes and red blood cells are washed from the chip. In an initial cohort of patients with different metastatic epithelial cancers, CTCs were detected (mean, 86 cells/ml) by EpCAM-mediated capture followed by staining with an antibody to cytokeratin (11). In lung cancers carrying EGFR mutations, CTC-based cell isolation by EpCAM capture and cytokeratin staining allowed noninvasive serial genotyping during the course of therapy with targeted kinase inhibitors (12). Despite these initial demonstrations, microfluidic CTC capture requires highly skilled specimen handling and analysis. To improve and standardize CTC imaging analysis, which is the most variable parameter and limits high-throughput applications, we focused on detection of CTCs in patients with localized and metastatic prostate cancer. This cancer type was attractive for this purpose because of the availability of a unique tumor-specific marker [prostate-specific antigen (PSA)] and potential applications of CTC detection to the management of prostate cancer.
Prostate cancer is the most common malignancy in men, with more than 186,000 new cases in the United States in 2008 and more than 28,000 deaths from metastatic disease (13). Most patients are diagnosed with localized disease and undergo either surgical resection (prostatectomy) or radiation therapy. Given the indolent nature of many prostate cancers affecting elderly men, however, the benefit of general PSA screening for early detection of prostate cancer has been called into doubt (14, 15). No standard histological markers reliably distinguish indolent from potentially invasive prostate cancer. About one-third of patients treated for localized disease develop a recurrence of prostate cancer, most frequently with metastases resulting from blood-borne spread to bone (16). Standard therapy for metastatic disease involves withdrawal of androgenic signals that drive proliferation of prostate cancer cells. Response to such therapy is profound and nearly universal but is invariably followed by the development of castration-resistant disease, which is only modestly responsive to cytotoxic chemotherapy (16).
Prostate cancer that is metastatic to bone is not readily biopsied, and only a few immortalized cell lines have been derived from prostate cancer cells, limiting molecular insights into disease progression and drug susceptibility (17). Chromosomal translocations that fuse the androgen-responsive TMPRSS2 promoter with ERG, an ETS family transcription factor, occur in about half of advanced prostate cancers (18, 19), but their functional consequences remain to be defined (20–24). Primary prostate cancers may harbor multiple cancerous foci with distinct translocations (25), suggesting that the specific cells that eventually cause metastatic disease may not be readily identifiable at the time of resection.
Here, we apply the unique markers available for prostate cancer to establish an imaging strategy for precise, automated quantification and molecular characterization of CTCs. We were able to estimate their half-life after removal of the primary tumor, as well as the amount of cell proliferation in this poorly understood tumor cell population.
RESULTS
Detection of PSA-stained CTCs in localized and metastatic prostate cancer using an automated image analysis platform
To date, antigen-based CTC isolation strategies, including the CTC-Chip, have made use of the transmembrane protein EpCAM for cell capture, followed by staining for cytoplasmic keratins (CKs) ubiquitously expressed by epithelial cell types. While providing a detection strategy broadly applicable across multiple cancers, the variable expression of cytokeratins in epithelial tumors limits their utility in establishing automated imaging of tumor-derived cells. Such an automated platform is essential for strategies involving high-throughput complex analysis of rare cells that are captured in a three-dimensional matrix within the CTC-Chip.
In our previous work, each CTC-Chip was scanned on a stereo microscope outfitted with a fluorescent lamp and automated stage, resulting in thousands of images for each chip that required hand counting by the investigator (11, 12). Although this system was sufficient to complete proof-of-principle studies with the CTC-Chip, it limited the ability to increase scanning throughput and prohibited complex characterization using fluorescent dyes. The optics for this system required long dwell times for each wavelength (~6 s) and provided low image resolution, whereas the lack of automation in the z plane prevented the use of autofocus algorithms and multiplane scans. Thus, imaging one chip in one z plane with two colors required more than 8 hours of scanning time and resulted in some cells being out of the imaging focal plane. These scanning limitations and the necessity of manual enumeration of the images prevented standardization of image analysis.
To develop a robust and automated platform capable of high-throughput complex analysis of rare cells captured in a three-dimensional matrix, we developed image processing algorithms and scoring criteria for CTCs, taking advantage of the uniquely sensitive and specific marker expressed by prostate cancer cells, PSA. After microfluidic capture of EpCAM-expressing CTCs on the CTC-Chip, a rabbit polyclonal antibody to PSA, previously characterized using LNCaP cells (see fig. S1), was flowed through the Chip, followed by a fluorescent-tagged goat antibody to rabbit immunoglobulin G; this procedure enabled secondary antibody signal amplification.
A digital imaging system with integration of the complete CTC-Chip footprint, analysis of multiple vertical focal planes, and standardized signal thresholds for multiple emission spectra was developed (see Supplementary Material) to quantify the number of captured CTCs. These improvements resulted in multiplane scanning capacity, a 75% reduction in scanning time, increased image quality, and reduced interoperator variability.
After image acquisition, all data were processed with an algorithm to quantify size, shape, and fluorescent signal intensity that was specifically created for this application, in which isolated cells with heterogeneous properties are captured in a three-dimensional space. Each image was converted to binary segments using a manual threshold based on signal intensity, specifically selected for each stain on the basis of average signal intensity and background fluorescence levels from control samples. The resulting postsegmentation objects (that is, cells) were analyzed with a custom algorithm to identify cells on the basis of size, shape, and colocalization of fluorescent signals (see Materials and Methods and Supplementary Material for algorithm derivation). Automated analysis of the signals in different channels allowed precise calculation of the position coordinates for the center of each cell, such that superimposed images were positively scored only if the center of 4′,6-diamidino-2-phenylindole (DAPI)–stained nuclei was within 2.5 μm of the cell center calculated from PSA cytoplasmic antibody staining (Fig. 1A). An electronic data report for each Chip analyzed contains images and metrics for the CTCs (cell area, perimeter, and spatial location on chip), enabling rapid visual review and validation to ensure that enumerated CTCs are intact cells (Fig. 1B). Additionally, the location of each CTC was plotted on a “heat map,” providing a chip-wide view of cell capture positions. The CTC capture profile has a characteristic decay pattern from chip inlet to outlet, indicative of specific cell capture (Fig. 1C).
Fig. 1.

Automated image processing for detection and enumeration of PSA-positive CTCs captured by the CTC-Chip. (A) CTCs captured from prostate cancer patients by adhesion to EpCAM antibody–coated microposts were fixed and stained for DNA content (DAPI) and PSA expression. The schematic diagram shows the steps involved in the semiautomated imaging process used for CTC enumeration. The entire CTC-Chip was serially imaged in multiple dimensions by means of an automated microscopic platform. After acquisition, all images were analyzed with a custom image processing algorithm, using a fluorescence intensity threshold for acquired PSA and DAPI signals. Binarized cell signals were quantified and sorted on the basis of area, shape, and morphometry, and those meeting preset selection criteria were further filtered to ensure that the separate DNA and PSA signals were precisely colocalized (that is, multidimensional coordinates of the center for each cell in both images were within 2.5 μm). (B) Representative low-magnification images and corresponding high-resolution images of PSA-positive CTCs isolated from three different prostate cancer patients. Scale bars, 10 μm. (C) Representative heat map and corresponding decay profile of an entire CTC-Chip, showing the distribution of capture of PSA-positive CTCs from a 2-ml blood specimen of a prostate cancer patient.
Quantitative analysis of PSA staining intensity in prostate cancer–derived CTCs revealed significant heterogeneity in the degree of PSA expression among CTCs from individual patients. We therefore optimized the detection algorithm to select a signal intensity threshold at which both male and female healthy controls had insignificant counts (median, 0.7 CTCs/ml; range, 0 to 12; mean, 2.2 ± 0.8) (Fig. 2A). The number of PSA-positive cells in females was very low (0 to 1 PSA-positive cells/ml) relative to healthy males (0 to 12 PSA-positive cells/ml). Whereas females should represent the true absence of signal, low concentrations of PSA-positive prostate epithelial cells might be shed from healthy prostate glands in males. For consistent analysis of CTC counts in patients with prostate cancer, we set a threshold of detection in patients that was higher than any count noted in any healthy donor. Thirty-one of 55 (56%) patients with known prostate cancer had detectable concentrations of CTCs relative to 0 of 17 healthy controls (Fig. 2A) using these imaging criteria and a threshold for positive detection set at ≥14 CTCs/ml. Among men with prostate cancer, CTCs were detected in 8 of 19 (42%) patients with localized disease (median, 95 CTCs/ml; range, 38 to 222; mean, 107 ± 24 for patients with detectable CTCs) and in 23 of 36 (64%) patients with metastatic disease (median, 32 CTCs/ml; range, 14 to >5000; mean, 116 ± 35 for CTC-positive cases excluding an outlier with 5000 CTCs/ml). This included cases responsive to androgen deprivation therapy (ADT) with declining serum PSA concentrations [7 of 14 (50%) patients] and untreated or castration-resistant cases on other therapies [16 of 22 (73%) patients]. Across different patients with different stages of disease (see table S1 for clinical characteristics), serum PSA concentrations were poorly correlated with the number of PSA-positive circulating cells (Fig. 2B).
Fig. 2.

Enumeration of PSA-positive CTCs in patients with prostate cancer and correlation with serum PSA concentrations. (A) CTC quantification in 17 healthy donors (13 males and 4 females) and 55 prostate cancer patients at various clinical stages. PSA staining of EpCAM antibody–captured cells corrected as CTCs/ml is shown. (B) Enumeration of PSA-positive CTCs from 19 patients with localized prostate cancer (untreated) and 36 patients with metastatic prostate cancer (14 responsive to ADT; 22 untreated or castration-resistant). The number of CTCs/ml is plotted against simultaneously obtained serum PSA values.
Longitudinal monitoring of CTCs after resection of localized prostate cancer
The sensitive CTC detection platform made it possible to undertake longitudinal studies in patients with localized prostate cancer after surgical resection of the primary tumor. Nineteen patients scheduled for curative-intent laparoscopic prostatectomy by the same surgeon were tested for the presence of CTCs preoperatively and at serial intervals after resection. PSA-expressing CTCs were detected in eight cases (42%; median, 95 CTCs/ml; range, 38 to 222; mean, 107 ± 24) (Table 1). The presence or absence of CTCs was not correlated with preoperative serum PSA concentrations or with standard measures of tumor grade (Gleason score), either from the preoperative biopsy or from the more complete pathological analysis of the resected tumor specimen. The presence of preoperative CTCs was also not associated with other currently known prognostic markers, including the size of the primary tumor, or with histopathological measures of invasiveness, such as extracapsular extension, lymphatic or perineural invasion, or positive surgical margins (Table 1).
Table 1.
Enumeration of CTCs and serum PSA concentrations in 19 patients with localized prostate cancer before and at serial intervals after resection of the primary tumor. The pathological features and standard markers of tumor invasiveness and prognosis are shown for each case, including analysis of the initial tumor biopsy (bx) and the fully resected pathological specimen (path). Evaluated parameters include Gleason score (GS; a measure of histological grade), prostate weight (in grams), pathologic stage (pTNM), percentage of gland infiltrated with cancer (% of Ca), presence of perineural invasion (PNI), and lymphatic vessel invasion (LVI). In all cases, surgical margins were negative. N/A, not available.
| CTCs/ml
|
Serum PSA
|
Pathology
|
|||||||||||
|---|---|---|---|---|---|---|---|---|---|---|---|---|---|
| Patient no. | Before surgery | Day 1 | Day 9 | Day 50+ | Before surgery | Day 50+ | GS (bx) | GS (path) | Prostate weight | pTNM | % of Ca | PNI | LVI |
| 37 | 84 | 20 | N/A | N/A | 5.8 | <0.1 | 7 | 7 | 44.6 | T2cN0 | 15% | + | − |
| 38 | 109 | 34 | N/A | 8 | 2.8 | <0.1 | 6 | 6 | 40 | T2cNx | 5% | − | − |
| 39 | 197 | 2 | N/A | N/A | 6.8 | <0.1 | 6 | 7 | 48 | T2CNx | 25% | + | − |
| 40 | 106 | 2 | 0 | 1 | 5.8 | <0.1 | 7 | 7 | 56 | T2cN0 | 15% | + | − |
| 41 | 38 | 1 | 47 | 1 | 3.7 | <0.1 | 6 | 6 | 41 | T2bN0 | 3% | − | − |
| 42 | 45 | 23 | N/A | 196 | 4.3 | <0.1 | 7 | 7 | 56 | T2cN0 | 7% | + | − |
| 43 | 222 | 215 | 38 | 0 | 4.5 | <0.1 | 7 | 7 | 51 | T2cN0 | 15% | + | − |
| 44 | 57 | 157 | N/A | 20 | 5.5 | <0.1 | 9 | 9 | 42.6 | T3aN0 | 15% | + | − |
| 45 | 13 | 28 | 0 | 3 | 11.8 | <0.1 | 7 | 7 | 98 | T2aN0 | 1% | + | − |
| 46 | 2 | 1 | 25 | 5 | 2.2 | <0.01 | 6 | 6 | 31 | T2cNx | 5% | − | − |
| 47 | 2 | 315 | N/A | 0 | 9.8 | <0.1 | 9 | 9 | 58.5 | T3aN0 | 50% | + | + |
| 48 | 2 | 0 | 0 | 29 | 3 | <0.04 | 8 | 7 | 54 | T3aNx | <10% | + | − |
| 49 | 0 | 4 | 30 | 2 | 5.1 | <0.1 | 6 | 6 | 66 | T2Nx | 5% | + | − |
| 50 | 7 | 9 | 1 | 1 | 4.5 | <0.1 | 8 | 8 | 41.5 | T2cN0 | 15% | − | − |
| 51 | 2 | 2 | 8 | N/A | 7.4 | 0.1 | 7 | 7 | 32 | T3aN0 | 15% | + | − |
| 52 | 8 | 7 | 0 | 0 | 2.8 | <0.01 | 7 | 7 | 48.5 | T3aN0 | 5% | + | − |
| 53 | 4 | 4 | 3 | 5 | 3.9 | <0.1 | 6 | 6 | 51.9 | T2cNx | 5% | + | − |
| 54 | 8 | 1 | N/A | 0 | 3.4 | <0.1 | 6 | 6 | 40 | T2aNx | 5% | − | − |
| 55 | 6 | 3 | N/A | 2 | 1.5 | <0.1 | 7 | 7 | 17 | T2cN0 | 10% | + | − |
CTCs were examined the day after surgical resection, at postoperative day 9, and at ≥3 months, coincident with scheduled postoperative clinical visits. Among the eight patients who had preoperatively detectable CTCs, the rate of decline after prostatectomy varied according to two general patterns: A rapid decline (<24 hours) in CTC counts was evident in six patients, and a more delayed postsurgical reduction in CTC counts was observed in the other two patients (<3 months). Of the 11 patients with preoperative CTC counts below the cutoff, 4 had transient elevations in CTCs during the follow-up period (Table 1). No evident differences in tumor pathology or operative procedure distinguished patients with a rapid versus delayed postoperative CTC decline. The disappearance of CTCs immediately after surgical resection of the primary prostate tumor in the majority of patients identifies the origin of these rare circulating cells. Moreover, the two distinct patterns of CTC decline after prostatectomy (that is, immediate versus delayed decline) may provide insight into the biology of early prostate cancer.
Serial monitoring of prostate CTCs after systemic therapy
In most patients with metastatic prostate cancer, CTCs are presumably derived from bone metastases. To test whether CTC counts in such cases correlate with response to therapy, we analyzed six patients with previously untreated metastatic prostate cancer before initiation of ADT using the gonadotropin-releasing hormone agonist leuprolide and at subsequent clinical visits. Within this cohort of patients, isolated CTCs were stained with PSA, keratin 7/8 (using previous enumeration methods), or both markers. A marked decline in CTC numbers was evident in all patients and coincident with the treatment-induced drop in serum PSA concentrations (Fig. 3, A to C, and fig. S3). Profound reductions in CTCs were evident even in a patient with diffuse bone metastases and an initial CTC count of >5000 CTCs/ml who had a marked response to ADT (Fig. 3B).
Fig. 3.

Serial enumeration and molecular analysis of CTCs in metastatic prostate cancer. Changes in CTC counts are shown for four patients with metastatic prostate cancer after initiation of therapy. Type of treatment and duration are noted for each case, including androgen deprivation therapy (ADT) with leuprolide, chemotherapy with docetaxel, and/or radiation therapy (XRT). During the course of the study, some patients developed progressive disease after an initial response to ADT (such as bicalutamide) and were subsequently treated with either chemotherapy or radiation. CTCs were stained with antibodies to either PSA (green) or cytokeratin 7/8 [blue, previous enumeration method (11, 12)], with CTCs/ml plotted as a function of time from initiation of therapy, along with standard serum PSA protein measurements (red). Patients shown are (A) patient 1, (B) patient 3, (C) patient 2, and (D) patient 26. Data from additional patients are shown in fig. S3 (ADT) and fig. S4 (chemotherapy).
Prostate cancer that has progressed despite hormonal therapy is considered to be castration-resistant and is commonly treated with docetaxel chemotherapy or radiation to sites of metastatic disease (16). Responses in these patients, as measured by PSA concentrations, are far less marked and durable than responses to initial hormonal therapy. We serially monitored CTCs in three patients with castration-resistant metastatic prostate cancer receiving either radiation or chemotherapeutic regimens (Fig. 3D and fig. S4), and continued to monitor patient 2 (Fig. 3C) after chemotherapy was initiated due to progression on leuprolide. In contrast to the marked decline in CTC numbers observed after initial androgen withdrawal therapy, chemotherapy-induced changes in CTC counts were modest, consistent with the limited reduction in serum PSA concentration (Fig. 3, C and D). Thus, whereas we observed a poor correlation between baseline pretreatment serum PSA levels and CTC counts in different patients with prostate cancer (Fig. 2B), longitudinal monitoring of individual patients after therapeutic interventions showed a close correlation between these two markers. There was a poor correlation between the baseline number of keratin-positive and PSA-positive CTCs in patients where both were assayed simultaneously (see Fig. 3, A and B, and fig. S2), which suggests that there is considerable heterogeneity of marker gene expression among CTCs. Nonetheless, after effective therapy, both keratin-stained and PSA-stained CTC numbers promptly declined in parallel (Fig. 3, A and B).
Molecular characterization of prostate cancer CTCs
The characteristic dissemination of prostate cancer to bone has made it difficult to sample and analyze metastatic deposits, which often appear many years after resection of the primary tumor and may therefore have undergone genetic evolution. To define the molecular composition of prostate cancer CTCs, we first tested for the TMPRSS2-ERG translocation (18, 26) in 20 patients with metastatic prostate cancer. On-chip lysis of CTCs generated RNA of sufficient quality for reverse transcription polymerase chain reaction (RT-PCR) analysis in all specimens, identifying the chimeric transcript in 9 of 20 (45%) cases (Fig. 4, A and B). The characteristic T1:E4 breakpoint was confirmed in all nine cases subjected to nucleotide sequencing analysis, with one case also having the T1:E5 variant generated by alternative splicing of the fused TMPRSS2 and ERG genes. Recent results from Attard et al. (26) and our data concordantly demonstrate the presence of the specific TMPRSS2-ERG chromosomal translocations in prostate CTCs, which definitively identifies their derivation from malignant prostatic epithelial cells.
Fig. 4.

Molecular analysis of CTCs in metastatic prostate cancer. (A) cDNAs generated from prostate CTCs were analyzed by PCR for the presence of the TMPRSS2-ERG fusion transcript. Two representative patient samples, one positive for the translocation (patient 6) and one negative (patient 56), are shown, along with VCaP, a prostate cancer cell line known to harbor the translocation (positive control). The nucleotide sequence of the translocation breakpoint is shown for the CTC sample, along with FISH analysis of the primary prostate tumor specimen surgically resected from this patient at the time of initial clinical presentation with localized disease (arrows point to the fused TMPRSS2-ERG locus). (B) Presence or absence of the TMPRSS2-ERG fusion transcript in CTCs from 20 metastatic prostate cancer patients, determined by RT-PCR analysis of RNA isolated from captured CTCs. For comparison, the translocation status of the originally resected primary tumor is shown. Translocation status of the primary tumor was determined using both RT-PCR and FISH analysis. The time interval between the initial surgical resection for localized prostate cancer and the CTC analysis in the setting of metastatic disease is shown in addition to the Gleason sum.
Archival specimens of the primary prostate cancer were available for all 20 cases, with a range of 6 months to 12 years between the time of resection of the primary tumor and that of CTC analysis in the setting of metastatic disease. Fluorescence in situ hybridization (FISH) analysis for the chromosomal TMPRSS2-ERG rearrangement identified 9 (45%) tumors as translocation-positive and 11 (55%) as translocation-negative. RT-PCR amplification for the fusion transcript also identified positive and negative cases at the same prevalence, but the two assays were concordant for only 14 of 20 (70%) cases (Fig. 4A). This apparent discrepancy may result from technical as well as biological considerations because prostate cancer is frequently multi-focal and the TMPRSS2-ERG translocation may be present in a subset of cancer cells within the primary tumor. Overall, the presence or absence of the translocation in CTCs from patients with metastatic cancer was concordant with analysis of the originally resected primary tumor specimen in 14 cases (70%) using FISH or 12 cases (60%) using RT-PCR assays (Fig. 4B). Although the clinical importance of the TMPRSS2-ERG translocation in metastatic prostate cancer is currently unknown, the divergence between molecular analyses of primary tumor and metastatic CTCs in some cases suggests that dominant tumor populations may evolve during the metastatic process.
Although the cellular composition of CTCs within individual patients is unknown, it is likely that these represent heterogeneous populations, including presumed metastatic precursors that are capable of invading through blood vessel endothelium and giving rise to independent metastatic lesions, as well as nonproliferating cells that may have passively entered the circulation through a leaky tumor vasculature. To obtain initial insight into such CTC heterogeneity, we adapted the automated imaging platform for triple staining of cells with PSA, DAPI, and the proliferation marker Ki67. Criteria were standardized for measurement of Ki67 signal intensity and localization relative to both cytoplasmic PSA and nuclear DAPI staining. Remarkably, a wide range of Ki67 positivity (1 to 81%) was evident among CTCs from patients with metastatic prostate cancer (Fig. 5). Three patients whose cancers were responding to ADT had total CTC counts ranging from 116 to 235 CTCs/ml, of which only 1 to 2% were positive for Ki67 staining. In contrast, three patients with progressive castration-resistant prostate cancer had 14 to 38 CTCs/ml, but 27 to 73% of these were positive for Ki67 staining, consistent with a considerably higher proliferative index. Of note, a fourth castration-resistant, docetaxel-refractory patient (patient 4) was analyzed in the setting of prolonged PSA stabilization attributed to an experimental second-line hormonal agent. His Ki67 fraction was only 7%. Of three patients with treatment-naïve metastatic disease, two had counts ranging from 250 to 260 CTCs/ml, of which 1 to 4% were Ki67-positive, whereas the third had 18 CTCs/ml, of which 81% were positive for this proliferation marker. Thus, although larger and longer-term clinical studies are essential to confirm these initial observations, the subdivision of CTCs into proliferative and nonproliferative subsets may provide important additional insight into the dynamic state of prostate cancer beyond simple enumeration of cells.
Fig. 5.
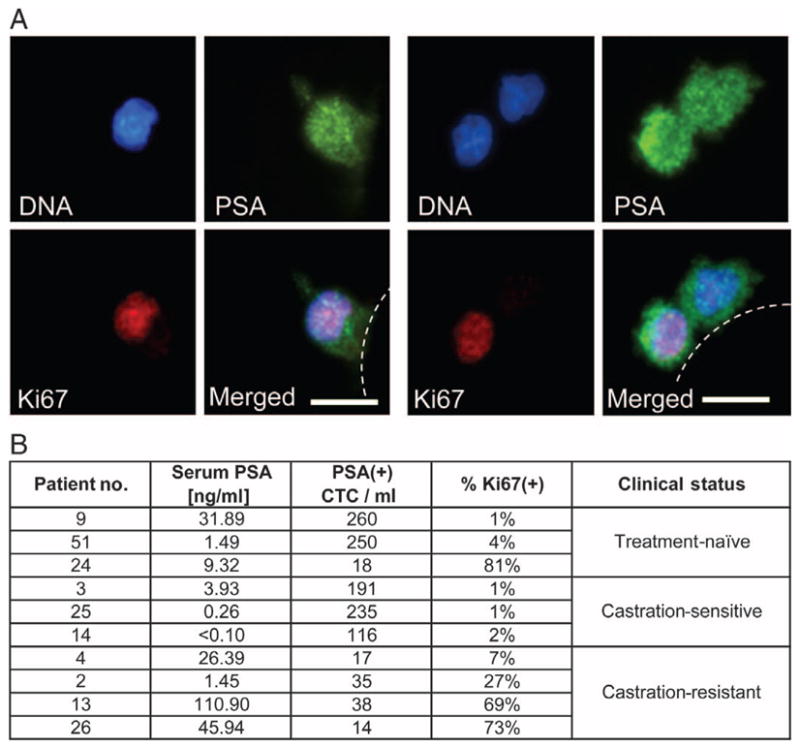
Proliferative index of PSA-positive prostate CTCs. (A) CTCs isolated from two patients with metastatic prostate cancer costained using antibodies against PSA and the proliferation marker Ki67. Representative high-resolution images of CTCs costained with DAPI (nuclear stain), PSA (cytoplasmic stain, green), and Ki67 (nuclear stain, red) are shown. Scale bars, 10 μm. (B) Numerical analysis of 10 patients with metastatic prostate cancer showing the concentration of serum PSA, number of PSA-stained CTCs, and the fraction of PSA-positive CTCs that are also positive for Ki67 [proliferative fraction; % Ki67(+)]. The clinical status of each patient at the time of analysis—untreated, responsive to ADT (castration-sensitive), or castration-resistant—is indicated.
DISCUSSION
The study of CTCs is essential to understanding the vascular spread of cancer to distant sites and for making use of these cells for real-time, noninvasive tumor monitoring but has been hindered by the absence of reliable and sensitive methods to detect rare cells. Relative to multistep batch purification strategies such as immunomagnetic bead capture, microfluidic approaches have the advantage of simpler processing steps and isolation of viable cells at higher sensitivity and purity (11). The use of optimized flow kinetics allows the processing of milliliter quantities of whole unprocessed blood in a microfluidic device and is critical to the ability of the CTC-Chip to maximize physical interactions between these rare cells and the antibody-coated microposts. However, the constraints inherent in imaging rare cells captured in a three-dimensional array provided a technological challenge to high-throughput, quantifiable analysis with such a microfluidic device. Here, we have demonstrated the application of automated imaging and standardized scoring algorithms for CTCs, taking advantage of the specific prostate cancer marker PSA. Relative to manual enumeration (11), automated imaging is more stringent in that it requires the establishment of strict thresholding parameters for signal intensity and morphometric measurements, which are then applied consistently across multiple specimens and set the stage for the high-throughput analyses required for clinical trials.
Staining of prostate CTCs for PSA expression, after their capture by microposts coated with antibody to EpCAM, offers a signal-to-noise ratio that is ideal for optimizing image analysis. Calibration of digital image intensity in female controls lacking PSA expression established the background signal, and a low number of PSA-expressing cells were detectable in healthy males. The threshold CTC number chosen to optimally distinguish between patients with prostate cancer and cancer-free males (14 CTCs/ml) may underestimate CTCs in some cancer patients with a few true PSA-positive cells, but it ensures a low likelihood of false positives. Although we have established this approach using PSA-based detection of prostate cancer CTCs, other equally sensitive and specific antibodies could in theory be used for the detection of circulating cells from other cancers, such as HER2 staining in subsets of breast cancer or neural crest markers for capture and staining in melanoma.
The numbers of CTCs identified by PSA staining of individual cells were highly concordant with serum PSA protein concentrations during longitudinal follow-up of individual patients treated with ADT. Thus, both of these biomarkers reflect tumor cell response to effective therapy. In contrast to these therapy-induced changes within individual patients, baseline CTC numbers and serum PSA concentrations among different patients were poorly correlated. This result is consistent with a previous study of CK8-, CK18-, and CK19-positive CTCs scored by immunomagnetic bead sorting, which showed only a very modest correlation with serum PSA concentrations (5). Hence, circulating cell numbers and serum PSA are likely to measure distinct biological properties of tumors. CTC numbers may reflect tumor vascularity and tumor cell invasiveness in addition to the overall tumor burden traditionally measured by serum PSA. Although post-therapy PSA changes have been widely used as a measure of clinical response for the past 20 years, whether such changes are surrogates for true clinical benefits and improved survival has remained a matter of controversy. In the setting of second-line hormonal therapy or chemotherapy, where clinical benefit is more uncertain, the significance of transient PSA declines has been questioned [see recent review (27)]. Thus, long-term studies addressing the utility of CTC enumeration for disease prognosis and as a marker of treatment benefit will be important because reliable surrogate markers for improved long-term survival are essential to developing new therapeutic options in advanced prostate cancer.
The increased detection sensitivity and the molecular characterization of prostate cancer CTCs resulted in two unexpected findings in our study. First, we were able to estimate the half-life of CTCs in the blood circulation after surgical resection of the primary tumor. The very rapid postoperative decline in CTC counts in a subset of patients (six of eight) indicates that an individual CTC is likely to be present in the blood for less than 24 hours, and if all sources of tumor cell shedding have been eliminated, the number of CTCs in blood should rapidly drop. This estimate of CTC half-life in the circulation is consistent with some past modeling predictions in breast cancer (28). In contrast, 2 of 8 patients with preoperative CTCs had a slower decline in numbers after surgical resection, and 6 of 19 patients had a transient presence of CTCs during their postoperative follow-up. Given the clinical annotation in these cases, it is unlikely that differences in primary tumor characteristics or surgical procedure account for the presence of CTCs up to 3 months after prostatectomy in these patients. Rather, it is likely that the postoperative CTCs in these cases are derived from extraprostatic sites of disease that continue to shed CTCs into the circulation for a limited time after resection of the primary tumor. This hypothesis is consistent with observations that show that patients with apparently localized prostate cancer may also have cancer cells in the bone marrow, as detected either visually (29) or by RT-PCR amplification of epithelial markers (30, 31). In these cases, it is therefore possible that sites of micrometastatic disease are established early in the course of prostate cancer but that most of these extraprostatic deposits are of limited long-term viability; hence, they appear to eventually resolve after resection of the primary tumor. If confirmed, this hypothesis would also support the potential application of CTC monitoring as a marker of invasive localized disease before the establishment of viable metastatic lesions. At present, the short-term follow-up (about 16 to 20 months) of the small number of patients described in this study is insufficient to derive conclusions about the prognostic or predictive utility of CTC monitoring. These observations, however, support the initiation of long-term clinical studies to test the utility of preoperative and postoperative CTC quantitation in predicting the risk of prostate cancer recurrence after surgical resection.
The second unexpected finding relates to the fraction of prostate CTCs representing proliferating cells, as indicated by the fact that they are positive for Ki67, the standard marker for dividing cells used in histopathological analyses. To date, limited information has been available about the types of tumor cells constituting CTCs and the extent to which they are representative of the proliferative and quiescent components of either primary or metastatic tumor deposits. The ability to reliably quantify superimposed signals provided by the automated CTC imaging platform enabled an analysis of proliferative fraction within PSA-positive prostate CTCs. Dual staining of CTCs for both PSA and Ki67 demonstrated a significant variation in the proliferative index (from 1 to 81%) of CTCs among patients at different stages of disease. Patients with metastatic prostate cancer who were highly responsive to androgen withdrawal had a low Ki67-positive fraction, whereas those with progressive castration-resistant disease had a considerably higher proliferative index. Although further clinical studies will be required to confirm this correlation and determine its predictive value for clinical outcome, these observations raise the possibility that CTC numbers alone may be only partially informative as to the proliferative state of the tumor, whereas subdivision of CTCs into molecularly defined populations may provide insight into its biological properties and may constitute a potentially informative tool for studying tumor response to therapeutic interventions.
The technology we have described here requires further optimization before it can be considered for point-of-care applications, including scaled-up device manufacture, chemical functionalization, and blood processing. Moreover, comprehensive analysis of the entire population of heterogeneous CTCs will require the use of multiple capture antibodies and integration of multiple fluorophores to interrogate diverse cellular pathways within these CTCs. Nonetheless, the automation and standardization of CTC imaging criteria presented here, together with their application in patients with localized and metastatic prostate cancer, provide a step toward the eventual clinical deployment of microfluidic CTC technologies. The combination of tissue-specific biomarkers with characteristic genetic abnormalities may enable sensitive and detailed analyses of CTCs in additional tumor types.
MATERIALS AND METHODS
Patients and clinical specimens
Patients with advanced and localized prostate cancer were recruited according to a protocol approved by the institutional review board (IRB). Blood specimens from healthy volunteers were collected under a separate IRB-approved protocol. A total of 36 metastatic prostate cancer patients (patients 1 to 36) and 19 patients with localized disease (patients 37 to 55), who were treated at the Massachusetts General Hospital Cancer Center, donated 20 ml of blood on one or more occasions for CTC-Chip analysis. An additional seven metastatic prostate cancer patients (patients 56 to 62) were also run on the CTC-Chip, but only enough volume was supplied for RNA extraction. Serum PSA analysis, abdominal-pelvic computed tomography scans, bone scans, and prostatectomies were performed per routine clinical practice. All specimens for CTC analyses were collected into Vacutainer (Becton-Dickinson) tubes containing the anticoagulant EDTA and were processed through the CTC-Chip within 6 hours of blood draw. For a subset of the metastatic cancer patients (n = 20), we analyzed CTCs and matched archival paraffin-embedded prostatectomy specimens for the presence of the TMPRSS2-ERG translocation with the use of RT-PCR. Additionally, FISH was used to identify the presence of the TMPRSS2-ERG with the use of in the paraffin-embedded tumor tissues. For statistical analyses, unless otherwise noted, measurements of continuous variables are reported as median and mean ± SEM.
CTC analysis and staining
Whole blood (2 to 3 ml) was processed through the CTC-Chip at flow rates of 1 to 2 ml per hour. After a wash with saline (10 ml per hour) to remove nonspecifically bound leukocytes, captured CTCs were fixed with 4% paraformaldehyde and subsequently per-meabilized with 0.2% Triton X-100 in 1% bovine serum albumin, all in phosphate-buffered saline. Cells were immunostained with either a phycoerythrin-conjugated monoclonal antibody against cytokeratin 7/8 (BD Biosciences), or a primary rabbit antibody to PSA (DAKO) followed by a secondary Alexa Fluor 488–conjugated goat antibody to rabbit (Invitrogen) to identify epithelial cells. Ki67 expression was detected using a mouse antibody to Ki67 (Zymed) followed by Alexa Fluor 594–conjugated goat antibody to mouse (Invitrogen). Nuclei were stained with DAPI. See Supplementary Materials and Methods for RT-PCR and FISH analyses of TMPRSS2-ERG fusion.
Automated imaging and enumeration of CTCs
The imaging platform consisted of an upright fluorescence microscope (Eclipse 90i, Nikon) fitted with a precision motorized stage (H101A ProScan II, Prior Scientific) and fluorescent system with built-in dc power stabilization for consistent illumination (Lumen 200, Prior Scientific). The fluorescent lamp intensity was calibrated weekly for each wavelength used. Using a 10× objective (CFI Plan APO; numerical aperture, 0.45; Nikon), we imaged the entire footprint of the chip under three emission spectra with a 12-bit charge-coupled device camera (Retiga 2000R Fast 1394, QImaging). All chips were stored at 4°C after staining and scanned within 48 hours. The motorized stage allowed imaging of the entire footprint of the Chip at multiple focal planes along the 100-μm vertical axis of the micro-posts. Before the initiation of the Chip scan, the first focal plane for each field of view was set using a multipoint planar surface approximation (see Supplementary Material). Three different emission spectra (DAPI, fluorescein isothiocyanate, and Texas Red) were captured using predetermined exposure times to allow simultaneous analysis of stains. After acquisition, images (~6000 per chip for a multiplane scan) were analyzed using an algorithm developed in LabView 8.5 with IMAQ 3.5 (National Instruments). For each spectral wavelength, the 12-bit images were converted to binary format based on absolute signal intensity. The resulting postsegmentation objects (that is, cells) were sorted according to size (for DAPI: >17 μm2 area), and any objects touching one another were separated using a particle separation algorithm (number of erosions set to 1). Any empty pixels inside the objects were removed using a “fill holes” algorithm, with the remaining objects filtered according to area (for DAPI: >21 and <150 μm2). Objects were filtered on the basis of their elongation factor (maximum intercept/mean perpendicular intercept, maximum set to 3.6). Segments or cells were determined to be positive for both PSA and DNA (PSA+ CTC) when the center of mass of each signal colocalized within 2.5 μm; that is, |(x1,y1)DNA − (x2,y2)PSA| ≤ 2.5 μm. Detection algorithms were adjusted until blinded manual counts were within 10% agreement of the automated counts. See Supplementary Material for additional details.
Supplementary Material
Fig. S1. Characterization of antibodies for detection of PSA in CTCs.
Fig. S2. Enumeration of PSA-positive CTCs in patients with prostate cancer and correlation with CK-positive CTCs.
Fig. S3. Serial monitoring of CTCs in additional metastatic prostate cancer patients receiving ADT.
Fig. S4. Serial monitoring of CTCs in metastatic prostate cancer patients receiving radiation or experimental chemotherapy regimens.
Fig. S5. Flow chart representing the image processing stream for each individual channel.
Table S1. Clinical characteristics and PSA-positive CTC counts for all metastatic patients presented in Fig. 2B.
Acknowledgments
We thank all patients who participated in this study; healthy donors who contributed blood samples; and K. Isselbacher, J. Engelman, M. Doughty, C. Collura, and J. Wong.
Funding: Dream Team Award, Prostate Cancer Foundation, Howard Hughes Medical Institute (D.A.H.), Quantum Grant, National Institute of Biomedical Imaging and Bioengineering (M.T.), Stand Up to Cancer Award (D.A.H. and M.T.), NIH–National Cancer Institute grant CA89138 (S.M.), American Cancer Society New England Division Research Grant (S.L.S.), Ellison Foundation, AstraZeneca, Martell Foundation, Alex and Sonja Spier, Monell Foundation, and Massachusetts General Hospital Institutional Support.
Footnotes
Author contributions: S.L.S., R.J.L., S.N., M.Y., L.U., D.M.D., C.-L.W., A.J.I., M.R.S., R.G.T., L.V.S., M.T., D.A.H., and S.M. designed research; S.L.S., R.J.L., S.N., M.Y., D.T.M., L.U., E.J.I., M.U., S.S., Z.N., A.L.M., D.I.T., and M.E.K. performed research; S.L.S., R.J.L., S.N., M.Y., D.T.M., L.U., A.J.I., M.R.S., M.T., D.A.H., and S.M. analyzed research; and S.L.S., R.J.L., S.N., M.R.S., M.T., D.A.H., and S.M. wrote the paper.
Competing interests: M.T. holds patents “Microfluidic device for cell separation and uses thereof” and “Devices and methods for enrichment and alteration of circulating tumor cells and other particles.”
REFERENCES AND NOTES
- 1.Fehm T, Sagalowsky A, Clifford E, Beitsch P, Saboorian H, Euhus D, Meng S, Morrison L, Tucker T, Lane N, Ghadimi BM, Heselmeyer-Haddad K, Ried T, Rao C, Uhr J. Cytogenetic evidence that circulating epithelial cells in patients with carcinoma are malignant. Clin Cancer Res. 2002;8:2073–2084. [PubMed] [Google Scholar]
- 2.Moreno JG, O’Hara SM, Gross S, Doyle G, Fritsche H, Gomella LG, Terstappen LW. Changes in circulating carcinoma cells in patients with metastatic prostate cancer correlate with disease status. Urology. 2001;58:386–392. doi: 10.1016/s0090-4295(01)01191-8. [DOI] [PubMed] [Google Scholar]
- 3.Moreno JG, Miller MC, Gross S, Allard WJ, Gomella LG, Terstappen LW. Circulating tumor cells predict survival in patients with metastatic prostate cancer. Urology. 2005;65:713–718. doi: 10.1016/j.urology.2004.11.006. [DOI] [PubMed] [Google Scholar]
- 4.Fizazi K, Morat L, Chauveinc L, Prapotnich D, De Crevoisier R, Escudier B, Cathelineau X, Rozet F, Vallancien G, Sabatier L, Soria JC. High detection rate of circulating tumor cells in blood of patients with prostate cancer using telomerase activity. Ann Oncol. 2007;18:518–521. doi: 10.1093/annonc/mdl419. [DOI] [PubMed] [Google Scholar]
- 5.Danila DC, Heller G, Gignac GA, Gonzalez-Espinoza R, Anand A, Tanaka E, Lilja H, Schwartz L, Larson S, Fleisher M, Scher HI. Circulating tumor cell number and prognosis in progressive castration-resistant prostate cancer. Clin Cancer Res. 2007;13:7053–7058. doi: 10.1158/1078-0432.CCR-07-1506. [DOI] [PubMed] [Google Scholar]
- 6.Wang ZP, Eisenberger MA, Carducci MA, Partin AW, Scher HI, Ts’o PO. Identification and characterization of circulating prostate carcinoma cells. Cancer. 2000;88:2787–2795. doi: 10.1002/1097-0142(20000615)88:12<2787::aid-cncr18>3.0.co;2-2. [DOI] [PubMed] [Google Scholar]
- 7.de Bono JS, Scher HI, Montgomery RB, Parker C, Miller MC, Tissing H, Doyle GV, Terstappen LW, Pienta KJ, Raghavan D. Circulating tumor cells predict survival benefit from treatment in metastatic castration-resistant prostate cancer. Clin Cancer Res. 2008;14:6302–6309. doi: 10.1158/1078-0432.CCR-08-0872. [DOI] [PubMed] [Google Scholar]
- 8.Olmos D, Arkenau HT, Ang JE, Ledaki I, Attard G, Carden CP, Reid AH, A’Hern R, Fong PC, Oomen NB, Molife R, Dearnaley D, Parker C, Terstappen LW, de Bono JS. Circulating tumour cell (CTC) counts as intermediate end points in castration-resistant prostate cancer (CRPC): A single-centre experience. Ann Oncol. 2009;20:27–33. doi: 10.1093/annonc/mdn544. [DOI] [PubMed] [Google Scholar]
- 9.Scher HI, Jia X, de Bono JS, Fleisher M, Pienta KJ, Raghavan D, Heller G. Circulating tumour cells as prognostic markers in progressive, castration-resistant prostate cancer: A reanalysis of IMMC38 trial data. Lancet Oncol. 2009;10:233–239. doi: 10.1016/S1470-2045(08)70340-1. [DOI] [PMC free article] [PubMed] [Google Scholar]
- 10.Davis JW, Nakanishi H, Kumar VS, Bhadkamkar VA, McCormack R, Fritsche HA, Handy B, Gornet T, Babaian RJ. Circulating tumor cells in peripheral blood samples from patients with increased serum prostate specific antigen: Initial results in early prostate cancer. J Urol. 2008;179:2187–2191. doi: 10.1016/j.juro.2008.01.102. [DOI] [PubMed] [Google Scholar]
- 11.Nagrath S, Sequist LV, Maheswaran S, Bell DW, Irimia D, Ulkus L, Smith MR, Kwak EL, Digumarthy S, Muzikansky A, Ryan P, Balis UJ, Tompkins RG, Haber DA, Toner M. Isolation of rare circulating tumour cells in cancer patients by microchip technology. Nature. 2007;450:1235–1239. doi: 10.1038/nature06385. [DOI] [PMC free article] [PubMed] [Google Scholar]
- 12.Maheswaran S, Sequist LV, Nagrath S, Ulkus L, Brannigan B, Collura CV, Inserra E, Diederichs S, Iafrate AJ, Bell DW, Digumarthy S, Muzikansky A, Irimia D, Settleman J, Tompkins RG, Lynch TJ, Toner M, Haber DA. Detection of mutations in EGFR in circulating lung-cancer cells. N Engl J Med. 2008;359:366–377. doi: 10.1056/NEJMoa0800668. [DOI] [PMC free article] [PubMed] [Google Scholar]
- 13.Jemal A, Siegel R, Ward E, Hao Y, Xu J, Murray T, Thun MJ. Cancer statistics, 2008. CA Cancer J Clin. 2008;58:71–96. doi: 10.3322/CA.2007.0010. [DOI] [PubMed] [Google Scholar]
- 14.Schröder FH, Hugosson J, Roobol MJ, Tammela TL, Ciatto S, Nelen V, Kwiatkowski M, Lujan M, Lilja H, Zappa M, Denis LJ, Recker F, Berenguer A, Määttänen L, Bangma CH, Aus G, Villers A, Rebillard X, van der Kwast T, Blijenberg BG, Moss SM, de Koning HJ, Auvinen A ERSPC Investigators. Screening and prostate-cancer mortality in a randomized European study. N Engl J Med. 2009;360:1320–1328. doi: 10.1056/NEJMoa0810084. [DOI] [PubMed] [Google Scholar]
- 15.Andriole GL, Crawford ED, Grubb RL, III, Buys SS, Chia D, Church TR, Fouad MN, Gelmann EP, Kvale PA, Reding DJ, Weissfeld JL, Yokochi LA, O’Brien B, Clapp JD, Rathmell JM, Riley TL, Hayes RB, Kramer BS, Izmirlian G, Miller AB, Pinsky PF, Prorok PC, Gohagan JK, Berg CD PLCO Project Team. Mortality results from a randomized prostate-cancer screening trial. N Engl J Med. 2009;360:1310–1319. doi: 10.1056/NEJMoa0810696. [DOI] [PMC free article] [PubMed] [Google Scholar]
- 16.Agarwal PK, Sadetsky N, Konety BR, Resnick MI, Carroll PR. Cancer of the Prostate Strategic Urological Research Endeavor (CaPSURE), Treatment failure after primary and salvage therapy for prostate cancer: Likelihood, patterns of care, and outcomes. Cancer. 2008;112:307–314. doi: 10.1002/cncr.23161. [DOI] [PubMed] [Google Scholar]
- 17.Taplin ME, Bubley GJ, Shuster TD, Frantz ME, Spooner AE, Ogata GK, Keer HN, Balk SP. Mutation of the androgen-receptor gene in metastatic androgen-independent prostate cancer. N Engl J Med. 1995;332:1393–1398. doi: 10.1056/NEJM199505253322101. [DOI] [PubMed] [Google Scholar]
- 18.Tomlins SA, Rhodes DR, Perner S, Dhanasekaran SM, Mehra R, Sun XW, Varambally S, Cao X, Tchinda J, Kuefer R, Lee C, Montie JE, Shah RB, Pienta KJ, Rubin MA, Chinnaiyan AM. Recurrent fusion of TMPRSS2 and ETS transcription factor genes in prostate cancer. Science. 2005;310:644–648. doi: 10.1126/science.1117679. [DOI] [PubMed] [Google Scholar]
- 19.Helgeson BE, Tomlins SA, Shah N, Laxman B, Cao Q, Prensner JR, Cao X, Singla N, Montie JE, Varambally S, Mehra R, Chinnaiyan AM. Characterization of TMPRSS2:ETV5 and SLC45A3:ETV5 gene fusions in prostate cancer. Cancer Res. 2008;68:73–80. doi: 10.1158/0008-5472.CAN-07-5352. [DOI] [PubMed] [Google Scholar]
- 20.Perner S, Demichelis F, Beroukhim R, Schmidt FH, Mosquera JM, Setlur S, Tchinda J, Tomlins SA, Hofer MD, Pienta KG, Kuefer R, Vessella R, Sun XW, Meyerson M, Lee C, Sellers WR, Chinnaiyan AM, Rubin MA. TMPRSS2:ERG fusion-associated deletions provide insight into the heterogeneity of prostate cancer. Cancer Res. 2006;66:8337–8341. doi: 10.1158/0008-5472.CAN-06-1482. [DOI] [PubMed] [Google Scholar]
- 21.Mehra R, Tomlins SA, Shen R, Nadeem O, Wang L, Wei JT, Pienta KJ, Ghosh D, Rubin MA, Chinnaiyan AM, Shah RB. Comprehensive assessment of TMPRSS2 and ETS family gene aberrations in clinically localized prostate cancer. Mod Pathol. 2007;20:538–544. doi: 10.1038/modpathol.3800769. [DOI] [PubMed] [Google Scholar]
- 22.Demichelis F, Fall K, Perner S, Andrén O, Schmidt F, Setlur SR, Hoshida Y, Mosquera JM, Pawitan Y, Lee C, Adami HO, Mucci LA, Kantoff PW, Andersson SO, Chinnaiyan AM, Johansson JE, Rubin MA. TMPRSS2:ERG gene fusion associated with lethal prostate cancer in a watchful waiting cohort. Oncogene. 2007;26:4596–4599. doi: 10.1038/sj.onc.1210237. [DOI] [PubMed] [Google Scholar]
- 23.Attard G, Clark J, Ambroisine L, Fisher G, Kovacs G, Flohr P, Berney D, Foster CS, Fletcher A, Gerald WL, Moller H, Reuter V, De Bono JS, Scardino P, Cuzick J, Cooper CS Transatlantic Prostate Group. Duplication of the fusion of TMPRSS2 to ERG sequences identifies fatal human prostate cancer. Oncogene. 2008;27:253–263. doi: 10.1038/sj.onc.1210640. [DOI] [PMC free article] [PubMed] [Google Scholar]
- 24.Gopalan A, Leversha MA, Satagopan JM, Zhou Q, Al-Ahmadie HA, Fine SW, Eastham JA, Scardino PT, Scher HI, Tickoo SK, Reuter VE, Gerald WL. TMPRSS2-ERG gene fusion is not associated with outcome in patients treated by prostatectomy. Cancer Res. 2009;69:1400–1406. doi: 10.1158/0008-5472.CAN-08-2467. [DOI] [PMC free article] [PubMed] [Google Scholar]
- 25.Clark J, Attard G, Jhavar S, Flohr P, Reid A, De-Bono J, Eeles R, Scardino P, Cuzick J, Fisher G, Parker MD, Foster CS, Berney D, Kovacs G, Cooper CS. Complex patterns of ETS gene alteration arise during cancer development in the human prostate. Oncogene. 2008;27:1993–2003. doi: 10.1038/sj.onc.1210843. [DOI] [PubMed] [Google Scholar]
- 26.Attard G, Swennenhuis JF, Olmos D, Reid AH, Vickers E, A’Hern R, Levink R, Coumans F, Moreira J, Riisnaes R, Oommen NB, Hawche G, Jameson C, Thompson E, Sipkema R, Carden CP, Parker C, Dearnaley D, Kaye SB, Cooper CS, Molina A, Cox ME, Terstappen LW, de Bono JS. Characterization of ERG, AR and PTEN gene status in circulating tumor cells from patients with castration-resistant prostate cancer. Cancer Res. 2009;69:2912–2918. doi: 10.1158/0008-5472.CAN-08-3667. [DOI] [PubMed] [Google Scholar]
- 27.Fleming MT, Morris MJ, Heller G, Scher HI. Post-therapy changes in PSA as an outcome measure in prostate cancer clinical trials. Nat Clin Pract Oncol. 2006;3:658–667. doi: 10.1038/ncponc0664. [DOI] [PubMed] [Google Scholar]
- 28.Meng S, Tripathy D, Frenkel EP, Shete S, Naftalis EZ, Huth JF, Beitsch PD, Leitch M, Hoover S, Euhus D, Haley B, Morrison L, Fleming TP, Herlyn D, Terstappen LW, Fehm T, Tucker TF, Lane N, Wang J, Uhr JW. Circulating tumor cells in patients with breast cancer dormancy. Clin Cancer Res. 2004;10:8152–8162. doi: 10.1158/1078-0432.CCR-04-1110. [DOI] [PubMed] [Google Scholar]
- 29.Morgan TM, Lange PH, Porter MP, Lin DW, Ellis WJ, Gallaher IS, Vessella RL. Disseminated tumor cells in prostate cancer patients after radical prostatectomy and without evidence of disease predicts biochemical recurrence. Clin Cancer Res. 2009;15:677–683. doi: 10.1158/1078-0432.CCR-08-1754. [DOI] [PMC free article] [PubMed] [Google Scholar]
- 30.Berg A, Berner A, Lilleby W, Bruland ØS, Fosså SD, Nesland JM, Kvalheim G. Impact of disseminated tumor cells in bone marrow at diagnosis in patients with nonmetastatic prostate cancer treated by definitive radiotherapy. Int J Cancer. 2007;120:1603–1609. doi: 10.1002/ijc.22488. [DOI] [PubMed] [Google Scholar]
- 31.Wood DP, Jr, Banerjee M. Presence of circulating prostate cells in the bone marrow of patients undergoing radical prostatectomy is predictive of disease-free survival. J Clin Oncol. 1997;15:3451–3457. doi: 10.1200/JCO.1997.15.12.3451. [DOI] [PubMed] [Google Scholar]
Associated Data
This section collects any data citations, data availability statements, or supplementary materials included in this article.
Supplementary Materials
Fig. S1. Characterization of antibodies for detection of PSA in CTCs.
Fig. S2. Enumeration of PSA-positive CTCs in patients with prostate cancer and correlation with CK-positive CTCs.
Fig. S3. Serial monitoring of CTCs in additional metastatic prostate cancer patients receiving ADT.
Fig. S4. Serial monitoring of CTCs in metastatic prostate cancer patients receiving radiation or experimental chemotherapy regimens.
Fig. S5. Flow chart representing the image processing stream for each individual channel.
Table S1. Clinical characteristics and PSA-positive CTC counts for all metastatic patients presented in Fig. 2B.