

Abstract
Here we present a microfluidic method for the analysis of single cell secretions. The method co-encapsulates cells with microspheres conjugated with capture antibodies and detection fluorescence-labeled antibodies. The secreted substance captured on the microsphere surface and detected via detection antibodies generating a localized fluorescent signal on a microsphere surface. Using this method, CD4+CD25+ regulatory T cells were encapsulated and assayed to detect IL-10 secreting cell in population.
Keywords: Microfluidic, Droplets, Single cell, Cell secretion, Microsphere
1. Introduction
Flow cytometry can acquire statistical information from a large population of cells and thus has contributed significantly to the field of diagnostics and the study of cellular function. A flow cytometer or fluorescence-activated cell sorter (FACS) generally identifies and/or sorts cells by using cell surface markers rather than by the molecules they secrete (Köster et al., 2008; Herzenberg et al., 2002; Carroll and Al-Rubeai, 2004). The ability of the sorted population of cells to secrete cytokines is then determined by additional tests such as the enzyme-linked immunosorbent assay (ELISA), or by intracellular cytokine staining. Other methods for the analysis of individual cells in large populations, like microfluidic devices (He et al., 2005; Khademhosseini et al., 2005) cell-based microarrays (Yamamura et al., 2005; Ostuni et al., 2001; Kim et al., 2004; Xua et al., 2010) enzyme-linked immunospot (ELISPOT) and hemolytic plaque assays, do not allow for both high-throughput analysis of a secreted product and simultaneous recovery of living cells for clonal expansion. To overcome this limitation, we present a simple, one-step micro droplet-based method for single cell secretion analysis with simple device handling and elimination of numerous washing procedures required by other approaches for measuring cellular secretion.
Recently, microfluidic droplets have attracted significant interest because they allow pico- or nano-liter volumes of samples and reagents to be confined in droplets to function as extremely high density microreactors (Wang et al., 2010). Such well-defined miniaturized systems prevent sample loss, cross contamination, achieve fast mixing, enhance thermal transfer, and chemical reaction rates (Wang et al., 2010). Previously, droplet-based microfluidic device was shown for encapsulation of single mouse hybridoma cells in distinct pL-sized drops, where they remain viable for several hours while secreting antibodies. However, in this study the secretion of encapsulated cell population was measured via ELISA after breaking the emulsion of droplets and therefore did not allow single cell secretion measurement.
In our method, a microfluidic droplet system was utilized for analyzing single cell secretion within the droplets. Each cell was encapsulated in its own defined liquid microenvironment within a single droplet together with fluorescent detection antibodies and microspheres previously conjugated with an analyte-specific antibody. Because the volume of each droplet is restricted, molecules secreted by an individual cell rapidly attain detectable concentrations. Using a custom optics system previously shown in literature for interrogation of fluorescent signal within the droplets (Clausell-Tormos et al., 2008) and droplets-base single cell secretion method presented here, one could determine the secretion pattern in the nanoliter droplets in a time-dependent fashion and sort the secreting cells to establish the hydrogenous in the population.
2. Experimental
2.1. Microfluidic device fabrication
Microfluidic flow chambers are fabricated by soft lithography. Negative photo resist SU-8 2025 or SU-8 2100 (MicroChem, Newton, MA) is deposited onto clean silicon wafers to a thickness of 50 μm, and patterned by exposure to UV light through a transparency photomask (CAD/Art Services, Bandon, OR). The Sylgard 184 poly(dimethylsiloxane) (PDMS) (Dow Corning, Midland, MI) is mixed with crosslinker (ratio 10:1), poured onto the photoresist patterns, degassed thoroughly and cured for at least 1 h at 65 °C. The PDMS devices are peeled off the wafer and bonded to glass slides after oxygen-plasma activation of both surfaces. To improve the wetting of the channels with mineral oil in the presence (1%, w/w) of the surfactant (span80), prior to the experiments the microfluidic channels are treated with Aquapel (PPG Industries, Pittsburgh, PA) by filling the channels with the solution as received and then flushing them with air. Polyethylene tubing with an inner diameter of 0.38 mm and an outer diameter of 1.09 mm (Becton Dickinson, Franklin Lakes, NJ) connects the channels to the syringes. Syringes are used to load the fluids into the devices, while the flow rates are controlled by syringe pumps.
2.2. CD4+CD25 high regulatory T cell cloning
Whole mononuclear cells were isolated from human blood drawn from healthy control donors by Ficoll-Hypaque (Amersham Biosciences) gradient centrifugation, total CD4 T cells were isolated by negative selection using the CD4+ T cell isolation kit II (Miltenyi Biotec, Bergisch Gladbach, Germany) and stained for fluorescence-activated cell sorting (FACS) with antibodies against CD45RA (HI100), CD25 (M-A251) and HLA-DR (L-243). The specific DR–Treg (CD45RA–CD25highDR–), and memory T responder (CD45RA–CD25med) populations were sorted in a FACS Aria (BD Biosciences) at one cell per well in XVIVO-15 (Lonza) medium containing 5% human serum and stimulated with soluble anti-CD3 (clone Hit3a, BD Biosciences) and anti-CD28 (clone 28.2) (both at 1 μg/mL), irradiated APCs (105/well) and IL-2 (50 U/mL). Half of the medium was replaced with fresh medium containing IL-2 (50 U/mL) starting at day 10 and every 3 to 4 days thereafter. After 4 weeks of expansion, each clone was tested for FoxP3 expression and IL-10 production.
2.3. Preparation of microsphere sensors
SPHERO™ Avidin Coated Particles (0.9 μm) were conjugated with 40 μg Biotinylated IL-10 monoclonal capture antibodies (Invitrogen AHC7109) in PBS suspension (Konry et al., 2009). The microcentrifuge tube containing the mixture was shaken at RT for 4 h. The microspheres were washed once with 300 μL Tris-Starting Block (blocking buffer), and then were suspended in 300 μL blocking buffer. The suspension was shaken at RT for 30 min, and then washed once with 300 μL blocking buffer. The microsphere probes were suspended and stored in 100 μL blocking buffer at 4 °C. The combined mixture of cells (105 cells mL−1), anti-IL-10 conjugated microspheres (5 × 10⁸ particles/mL) and rat anti-human IL-10 FITC conjugated antibodies (1 μg/mL, Invitrogen RHCIL1001) were encapsulated in droplets using previously described PDMS microfluidic platform.
2.4. Image analysis
Fluorescence images were captured on a Zeiss 200 Axiovert microscope using an AxioCAM MRm digital camera. FITC fluorescence (excitation 488 nm/emission 525 nm) was monitored to evaluate the microsphere assay. Just ImageJ software was used for the image processing.
3. Results and discussion
Fig. 1B schematically illustrates the polydimethylsiloxane-based (PDMS) microfluidic platform for droplet generation. This basic cell encapsulation device uses a flow focusing geometry to produce droplets (Fig. 1A(1, 2)) (Brouzes et al., 2009; Edd et al., 2009; Wan et al., 2008). Three perpendicular inlet channels form a nozzle shown in Fig. 1A(1). The center stream contains a mixture of microspheres, cells (105 cells mL−1) and secondary antibodies, while the two opposing side streams contain the oil phase. Individual syringe pumps are used to control flow rates of the oil phase and the cell suspension. To form droplets, the flow-rate-ratio of water-to-oil is adjusted to Qw/Qo = 0.5, where Qw = 1 μL/min and Qo = 2 μL/min, generating a droplet volume of ~1.8 nL and corresponding to a spherical drop diameter of 150 μm. While the reported frequency of single-cell-bearing drops is somewhat low, the high production and screening rate that can be achieved with the microfluidic device results in the isolation of a large number of secreting cells (Brouzes et al., 2009; Edd et al., 2009; Wan et al., 2008; Zhang et al., 2004). In addition to the single cell analysis, a downstream sorting system can also be included (Fig. 1B), for future studies, which will sort the cells based on secretion of the interrogated analyte within cell population (Köster et al., 2008; Brouzes et al., 2009; Edd et al., 2009; Wan et al., 2008; Agresti et al., 2010).
Fig. 1.

(A) Sequential images showing the droplet formation (1, 2) and incubation channel (3, 4). (B) Schematic illustration of the configuration of droplet based microfluidic platform. The center stream contains a mixture of microspheres, cells and secondary antibodies (Mix), while the two opposing side streams contain the oil phase. The encapsulated cells proceed into the downstream incubation region for cell analysis and then can be sorted based on secretion of the interrogated analyte, if the sorting system similar to the one presented in the literature will be added (Clausell-Tormos et al., 2008).
One application for this secretion analysis system involves the examination of different cells within a population that uniquely respond to a specific activation stimulus with the secretion of a specific analyte. To demonstrate the ability of our system to assess the analyte-secretion potential of a complex cell population, we studied the capacity of CD4+CD25 regulatory T (Treg) cell clones to secrete IL-10. IL-10 is an anti-inflammatory cytokine with pleiotropic activities on B, T and mast cells and is produced by a variety of cell types in response to activation (Zhang et al., 2004; Astier et al., 2006; Unutmaz and Pulendran, 2009). The ability to detect and re-isolate only those cells that are actively secreting IL-10 from the majority of cells in the population that are not actively producing IL-10 would advance our understanding of how IL-10 secretion is regulated in different cell types.
To validate the sensitivity of our assay, prior to cell studies, different concentrations of IL-10 protein were measured. Micro-spheres previously functionalized with monoclonal anti-IL-10 antibodies were introduced into different concentrations of IL-10, along with fluorescently labeled detection antibodies (polyclonal anti-IL-10) conjugated with FITC. Next, a mixture of microspheres, analyte and detection antibodies were encapsulated in droplets using our device. The fluorescence signal was detected in the droplets after 1 h in the incubation channel and the intensities of the microspheres were analyzed using Just ImageJ software. The detection limit of the system, defined as the amount (or concentration) of the analyte that gives a response (YDL), that is significantly different (three standard deviations (SDBR) from the background analysis of the analysis that is itself obtained from drops without analyte (IL-10) (YBR). Therefore, the lower detection limit (YLDL) was calculated using Eqs. (1) and (2):
| (1) |
| (2) |
Fig. 2 shows the average fluorescence intensity of the IL-10 protein microsphere assay obtained by collecting data from five devices at IL-10 concentrations ranging from 10 pg/mL to 500 pg/mL. Based on this result the microsphere assay exhibits an appropriate sensitivity, if compared to ELISA method, for analyzing IL-10 secretion.
Fig. 2.

Averaged fluorescence intensity of the IL-10 protein microsphere assay obtained in triplicate by collecting data from five devices at IL-10 concentrations ranging from 10 pg/mL to 500 pg/mL.
Next, we applied the microfluidic droplet system for analyzing the IL-10 cytokine secretion of T cells. Whole mononuclear cells were isolated from human blood drawn from healthy control donors, and the CD4 T cells were isolated and stained for FACS with antibodies to CD45RA (HI100), CD25 (M-A251) and HLA-DR (L-243). The specific Treg population (CD45RA negative, CD25 high positive, CD127 negative, DR negative) was sorted at and cultured with one cell per well. The cells were then stimulated with soluble factors to induce proliferation and maturation (details in Section 2). IL-10 is a component of the suppressive machinery utilized by Tr1 regulatory cells, while it may be secreted by only a subpopulation of natural FoxP3+ Tregs, therefore after 4 weeks of expansion, each clone was tested for FoxP3 expression and IL-10 via FACS. The IL-10 production was measured via ELISA and concentrations of 50–500 pg/mL of IL-10 were detected for the cultured cells. Next, CD4+CD25+ regulatory T cells were encapsulated in nano-liter droplets along with microspheres previously conjugated with anti-IL-10 antibody and fluorescently labeled detection antibodies. The single-cell secretion of IL-10 was detected after 2 h of incubation in the restricted droplet volume (Fig. 3C). In the case of non-stimulated cell no analyte secretion was detected from the cell, the fluorescence remains diffuse within the droplet and not localized on the microsphere surface (Fig. 3F). Using a custom optics system previously shown in literature for interrogation of fluorescent signal within the droplets (Clausell-Tormos et al., 2008), one could determine the secretion pattern in the nanoliter droplets in a time-dependent fashion and sort the secreting cells to establish the hydrogenous in the population.
Fig. 3.
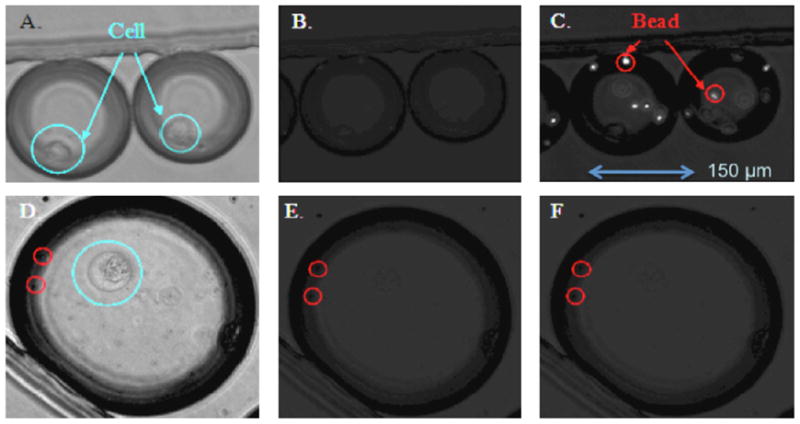
(A and D) Bright field image of aqueous droplets containing T cells, microspheres and fluorescent secondary antibody in the incubation channel. (B and E) Fluorescence image before and (C and F) after 2 h of incubation.
4. Conclusions
In summery, we were able to detect single cell secretion of IL-10 cytokine in nano-liter reaction droplets using microfluidic platform. Although we have only demonstrated single analyte detection, this method in the future could be applied to multiple target detection. Additional microspheres that bind other cytokine targets and different fluorochrome tagged secondary anti-cytokine antibodies can be incorporated in this type of droplet based secretion system. This way, the single cell secretome can be measured using multiple microspheres previously functionalized with different capture antibodies. The ability to use combinations of analytes for signal generation should enable simplification of sorting and detection analysis. Finally, since monitoring CD4+CD25+ regulatory T cells shows promise in gauging the effectiveness of cancer immunotherapy, our system could be applied in the future to study potential new paradigms for designing cytokine antagonists and cell–cell regulation.
Acknowledgments
We thank Dr. Jon Edd, Dr. Erkin Seker and Dr. Eric Yang for technical assistance in the device operation. We would like to acknowledged support from NIH grant AI063795 and EB002503.
References
- Agresti JJ, Antipov E, Abate AR, Ahn K, Rowat AC, Baret J, Marquez MA, Klibanov M, Griffiths AD, Weitz DA. PNAS. 2010;107 (9):4004–4009. doi: 10.1073/pnas.0910781107. [DOI] [PMC free article] [PubMed] [Google Scholar]
- Astier AL, Meiffren G, Freeman S, Hafler DA. J Clin Invest. 2006;116:3252–3257. doi: 10.1172/JCI29251. [DOI] [PMC free article] [PubMed] [Google Scholar]
- Brouzes E, Medkova M, Savenelli N, Marran D, Twardowski M, Hutchison JB, Rothberg JM, Link DR, Perrimon N, Samuels ML. PNAS. 2009;106 (34):14195–14200. doi: 10.1073/pnas.0903542106. [DOI] [PMC free article] [PubMed] [Google Scholar]
- Carroll S, Al-Rubeai M. Expert Opin Biol Ther. 2004;4:1821–1829. doi: 10.1517/14712598.4.11.1821. [DOI] [PubMed] [Google Scholar]
- Clausell-Tormos J, Lieber D, Baret JC, El-Harrak A, Miller OJ, Blouwolff J, Humphry KJ, Köster S, Duan H, Holtze C, Weitz DA, Griffiths AD, Merten CA. Chem Biol. 2008;15:427–437. doi: 10.1016/j.chembiol.2008.04.004. [DOI] [PubMed] [Google Scholar]
- Edd JF, Humphry KJ, Irimia D, Weitz DA, Toner M. Lab Chip. 2009;9:1859–1865. doi: 10.1039/b821785h. [DOI] [PMC free article] [PubMed] [Google Scholar]
- Herzenberg LA, Parks D, Sahaf B, Perez O, Roederer M, Herzenberg LA. Clin Chem. 2002;48:1819–1827. [PubMed] [Google Scholar]
- He M, Edgar JS, Jeffries GD, Lorenz RM, Shelby JP, Chiu DT. Anal Chem. 2005;77:1539–1544. doi: 10.1021/ac0480850. [DOI] [PubMed] [Google Scholar]
- Köster S, Angilè FE, Duan H, Agresti JJ, Wintner A, Schmitz C, Rowat AC, Merten CA, Pisignano D, Griffiths AD, Weitz DA. Lab Chip. 2008;8:1110–1115. doi: 10.1039/b802941e. [DOI] [PubMed] [Google Scholar]
- Khademhosseini A, Yeh J, Eng G, Karp J, Kaji H, Borenstein J, Farokhzad OC, Langer R. Lab Chip. 2005;5:1380–1386. doi: 10.1039/b508096g. [DOI] [PubMed] [Google Scholar]
- Konry T, Hayman RB, Walt DR. Anal Chem. 2009;81 (14):5777–5782. doi: 10.1021/ac900694y. [DOI] [PMC free article] [PubMed] [Google Scholar]
- Kim H, Doh J, Irvine DJ, Cohen RE, Hammond PT. Biomacromolecules. 2004;5:822–827. doi: 10.1021/bm034341r. [DOI] [PubMed] [Google Scholar]
- Ostuni E, Chen CS, Ingber DE, Whitesides GM. Langmuir. 2001;17:2828–2834. [Google Scholar]
- Unutmaz D, Pulendran B. Nat Immunol. 2009;10:1141–1143. doi: 10.1038/ni1109-1141. [DOI] [PubMed] [Google Scholar]
- Wang W, Yang C, Liu YS, Li CM. Lab Chip. 2010;10:559–562. doi: 10.1039/b924929j. [DOI] [PubMed] [Google Scholar]
- Wan J, Bick A, Sullivan M, Stone HA. Adv Mater. 2008;20:3314–3318. [Google Scholar]
- Xua T, Li C, Ya X, Cai G, Yang M. Anal Biochem. 2010;396:173–179. doi: 10.1016/j.ab.2009.09.018. [DOI] [PubMed] [Google Scholar]
- Yamamura S, Kishi H, Tokimitsu Y, Kondo S, Honda R, Rao SR, Omori M, Tamiya E, Muraguchi A. Anal Chem. 2005;77:8050–8056. doi: 10.1021/ac0515632. [DOI] [PubMed] [Google Scholar]
- Zhang R, Tan Z, Liang P. Annu Rev Immunol. 2004;22:929–997. [Google Scholar]