Abstract
G2A is an immunoregulatory G protein-coupled receptor predominantly expressed in lymphocytes and macrophages. Ectopic overexpression studies have implicated G2A as a receptor for the bioactive lysophospholipid, lysophosphatidylcholine (LPC). However, the functional consequences of LPC–G2A interaction at physiological levels of receptor expression, and in a cellular context relevant to its immunological role, remain largely unknown. Here, we show impaired chemotaxis to LPC of a T lymphoid cell line in which G2A expression was chronically down-regulated by RNA interference technology. Rescuing this phenotype by reconstitution of the physiological level of receptor expression further supports a functional connection between LPC–G2A interaction and cellular motility. Overexpression of G2A in the T lymphoid cell line significantly enhanced chemotaxis to LPC. It also modified migration toward the LPC-related molecule, lysophosphatidic acid, indicating the possibility of crosstalk between G2A and endogenous lysophosphatidic acid receptors. The role of G2A in LPC-mediated cell migration may be relevant to the autoimmune syndrome associated with genetic inactivation of this G protein-coupled receptor in mice. The experimental system described here can be useful for understanding the structural requirements for LPC recognition by G2A and the signaling pathways regulated by this ligand-receptor pair.
The structural and functional integrity of the immune system requires constant integration of signals from a complex network of cell-surface molecules. G protein-coupled receptors (GPCRs) are critical components of this network, based on their ability to transduce signals specifying proliferation, death, activation, or movement of immune cells (reviewed in ref. 1). Some of these signals are induced by small lysophospholipid (LP) molecules acting through a class of GPCRs that includes receptors for sphingosine 1-phosphate (S1P), lysophosphatidic acid (LPA), and lysophosphatidylcholine (LPC) (reviewed in refs. 2 and 3).
G2A was originally discovered as a transcriptionally regulated orphan GPCR in a search for downstream targets of the leukemogenic tyrosine kinase BCR-ABL (4). Subsequent studies have identified the bioactive lipid LPC as a ligand for G2A (5). In cells overexpressing G2A, LPC was shown to increase intracellular calcium concentration (in MCF10A epithelial cells), activate the extracellular signal-regulated kinase mitogen-activated protein kinase (in Chinese hamster ovary cells) and induce chemotaxis (in Jurkat T lymphocytes) (5). LPC was also demonstrated to enhance G2A-dependent accumulation of cAMP and apoptosis induction in HeLa cells transfected with this GPCR (6).
In fibroblasts, G2A overexpression led to ligand-independent accumulation of cells at G2 and M and a partial block in the progression of mitosis (4). Introduction of G2A in these cells by retroviral transduction or microinjection induced significant morphological alterations, including suppression of contact inhibition, foci formation, and assembly of actin stress fibers (7). Genetic studies using embryonic fibroblasts derived from various Gα-deficient mice have demonstrated that G2A-induced cytoskeletal changes require coupling to Gα13 and subsequent activation of RhoA (7). This pattern of coupling was also supported by the finding that coexpression of LscRGS, a GTPase-activating protein that suppresses signaling by Gα13, inhibited G2A-induced morphological changes (8). In addition to Gα13, G2A has been linked to Gαi [in MCF10A and Chinese hamster ovary cells (5)], Gαq, and Gαs [in HeLa cells (6)], indicating that coupling to this GPCR might be cell context-dependent.
In addition to heterologous expression of G2A in cell lines, we used targeted gene deletion as an alternative experimental approach to study this receptor (9). G2A-/- mice developed a late-onset (>1.5 yr), slow-progressing autoimmune syndrome characterized by abnormal expansion of both T and B lymphocytes (9). In young G2A-/- mice, the only identified immunological abnormality potentially predisposing to autoimmunity was increased proliferation of activated T cells. This finding suggests a proliferation-suppressing role for G2A, which is consistent with its negative effect on cell-cycle progression induced on overexpression in fibroblasts (4). However, the role of LPC in these systemic (loss of immune regulation) or cellular (T cell hyperproliferation) processes is currently unknown.
Whereas further work is required to correlate certain in vitro overexpression findings with in vivo roles revealed by gene targeting studies, the connection between G2A and the oncogene BCR-ABL is supported by both experimental approaches. In vitro, forced overexpression of G2A was shown to suppress the oncogenic potential of BCR-ABL in bone marrow cells (4), whereas in vivo, loss of G2A function resulted in accelerated BCR-ABL-induced lymphoid leukemogenesis (10). These findings are consistent with an antagonistic role for G2A in BCRABL-induced transformation.
An unanswered issue in G2A signaling concerns LPC-mediated effects at physiological levels of receptor expression. We reasoned that these effects would be best addressed in a cellular context representative of the immunoregulatory role of G2A. We therefore sought to develop an in vitro cellular system amenable to genetic suppression or enhancement of receptor expression in conjunction with controlled ligand administration. Generation of this system was critically dependent on the ability to measure G2A expression at the protein level. For this experiment, we produced an antibody against G2A and used this reagent to identify lymphoid cell lines expressing comparable levels of receptor to those found in primary lymphocytes. The DO11.10 T lymphoid cell line (11) fulfilled these criteria.
To examine LPC-G2A-dependent responses in DO11.10 cells, we chronically suppressed the expression of the receptor by >90%, using retroviral transduction of small interfering RNAs (siRNAs) (12). This procedure was well tolerated and did not alter the basal growth rate of DO11.10 cells or their activation-induced cytokine production. However, chemotaxis of these cells to LPC was significantly reduced. This defect was rescued by reexpression of physiological amounts of G2A in a form refractory to siRNA-mediated degradation, demonstrating the specificity of our strategy. Furthermore, chemotaxis to LPC was greatly enhanced in DO11.10 cells overexpressing the receptor. While demonstrating an effect mediated by LPC through the endogenous G2A receptor, these results also establish a system to study this ligand-receptor pair in an immune cellular context.
Materials and Methods
Generation of a G2A-Specific Polyclonal Antibody and Immunoblotting. The G2A-specific polyclonal antibody was developed in rabbits immunized with a bacterially produced polypeptide comprising residues 310–382 from the C terminus of G2A fused to GST (GST-G2A-C). GST-specific antibodies were depleted by absorbing the serum on a GST-Sepharose column. G2A-specific antibodies were affinity-purified on GST-G2A-C coupled to cyanogen-bromide-activated Sepharose. For Western blotting, 106 cells were lysed in 1 ml of radioimmunoprecipitation assay buffer and 10 μl of the lysate was mixed with SDS/2-mercaptoethanol containing sample buffer and loaded without boiling on a Novex 8–16% Tris-glycine gel (Invitrogen).
Cell Culture. The DO11.10 T cell hybridoma (11) is specific for residues 323–339 of ovalbumin presented by the MHC class II molecule I-Ad, and was a generous gift from J. Kappler and P. Marrack (University of Colorado Health Sciences Center, Denver). These cells were maintained in RPMI medium 1640 supplemented with 10% FCS and 2 mM l-glutamine.
RNA Isolation and RT-PCR. DNA-free RNA was prepared from the DO11.10 cells by using the Absolutely RNA microprep kit from Stratagene. Total RNA from mouse tissues was prepared by using the TRIzol method (Invitrogen). The RNA was reverse-transcribed by using oligo dT primers and the First Strand cDNA synthesis kit from Invitrogen. The PCR conditions and the primers used for amplification can be found in Supporting Materials and Methods, which is published as supporting information on the PNAS web site.
Constructs. The psiRNA[H1.4]-R retroviral vector is based on the pQCXIP vector (Clontech). The short hairpin (sh)RNA expression cassette, driven by the human H1 promoter and containing a 9-nt loop, was designed according to Brummelkamp et al. (12) and was inserted in the 3′ LTR sequence of the pQCXIP vector. The cytomegalovirus promoter and the IRES-puromycinr sequence of this vector were replaced with a sequence encoding the enhanced GFP (EGFP; Clontech) followed by a polyadenylation signal.
The oligonucleotides encoding the siRNAs were (i) murine G2A siRNA, 5′-TCCCGGTGGAGGAGGGTTTCTGCTTCAAGAGAGCAGAAACTCTTCTCCACC and 5′-AAAAGGTGGAGAAGAGTTTCTGCTCTCTTGAAGCAGAAACCCTCCTCCACC; (ii) murine TDAG8 siRNA, 5′-TCCCAGATGAAATGGGTGTTGAATATTCAAGAGATATTCAACACTCGTTTCATCT and 5′-AAAAAGATGAAACGAGTGTTGAATATCTCTTGAATATTCAACACCCATTTCATCT; and (iii) human TDAG8 siRNA (used as a mismatched control siRNA) 5′-TCCCAGATGAAATGGTTGTTGAATATTCAAGAGATATTCAACAACTGTTTCATCT and 5′-AAAAAGATGAAACAGTTGTTGAATATCTCTTGAATATTCAACAACCATTTCATCT. Underlined nucleotides represent C to T or A to G substitutions in the sense strand of the shRNA, resulting in G/U wobble pairings, which are allowed in dsRNA α-helices. These substitutions were shown by Paddison et al. (13) to increase the ligation efficiency and stability of the hairpin structures during propagation in bacteria. The oligonucleotides were annealed and ligated in the BbsI sites of the psiRNA[H1.4]-R vector, downstream of the H1 promoter.
Reagents. We used initially two formulations of LPC with similar results: natural l-α-LPC (egg, chicken, Avanti Polar Lipids no. 830071), dissolved in water at 10 mM and synthetic LPC 16:0 (Avanti Polar Lipids no. 855675P) dissolved in nitrogen (N2)-bubbled methanol at 50 mM. All of the experiments shown in this study were performed with the natural form of LPC. LPA (l-α LPA oleoyl sodium) was purchased from Sigma (no. L7260) and was dissolved in 0.1 M NaCl/10 mM Hepes buffer, pH 7.4. S1P was purchased from Sigma (no. S-9666) and was dissolved in DMSO at 1 mM. Sphingosylphosphorylcholine (SPC) was purchased from Avanti Polar Lipids (no. 860600) and was dissolved in water at 2 mM. All lipids were stored under N2 at –80°C in single-use aliquots and were used within a month from the purchase date. The recombinant murine stromal cell-derived factor 1 α (SDF1-α or CXCL12) was purchased from PeproTech (Rocky Hill, NJ), resuspended at 50 μg/ml in water, and stored at –20°C.
Determination of DNA Synthesis Rate and IL-2 Production. Cells (5 × 10⁴) were resuspended in serum-free medium (SFM) containing RPMI medium 1640 with 0.1% fatty acid-free BSA (FAF-BSA) (Sigma, no. A8806-5G) and 25 mM Hepes buffer, pH 7.4. Cells were treated with various concentrations of LPC, pulsed for 12 h with 0.5 μCi of [3H]thymidine and then collected by using a semiautomatic cell harvester (Skatron, Lier, Norway). The radioactivity was measured by scintillation counting as described (9). To determine IL-2 production, 5 × 10⁴ cells in SFM, were stimulated for 24 h with 5 μg/ml plate-bound antibody specific for the CD3ε chain (Becton Dickinson, clone 145-2C11) in the presence of the indicated amounts of LPC. Production of IL-2 was determined by ELISA using a purified rat anti-mouse IL-2 antibody (Becton Dickinson, clone JES6-1A12) for capture and a biotinylated rat anti-mouse IL-2 antibody (Becton Dickinson, clone JES6-5H4) for detection. The antibodies were used according to the manufacturer's protocol.
Transmigration Assay. Equal numbers (2 × 10⁵) of WT and G2A-silenced cells (G2AshRNA) or control (CTRshRNA) cells were washed three times with SFM, mixed and added in a 100-μl volume to the upper chambers of a 24-well plate with 5.0-μm pore size polycarbonate filters (Costar). The plate was equilibrated at 37°C and 8% CO2 for 30 min before the addition of the chemotactic factors. This mixture was dissolved by vortexing at the indicated concentrations in the SFM (prewarmed at 37°C) and added to the lower chambers in a 600-μl volume. After 2 h incubation at 37°C and 8% CO2, transmigrated WT and EGFP-positive shRNA-transduced cells were recovered from the lower chambers and counted by fluorescence-activated cell sorting.
Results
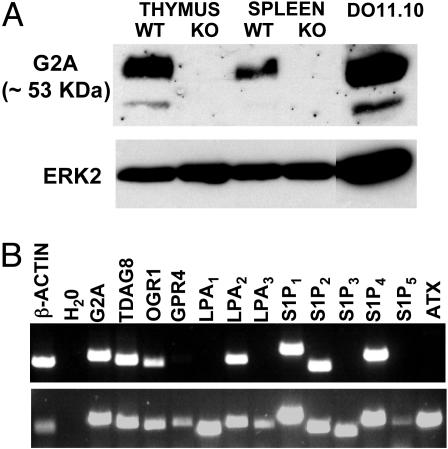
Selection of a G2A-Positive Lymphoid Cell Line for Functional Studies. To set up an in vitro system for LPC-G2A functional studies, we needed a cell line expressing a comparable amount of receptor to that found in primary cells. To determine the expression of G2A at the protein level, we generated a rabbit polyclonal antibody against the C terminus part of this GPCR. The specificity of this antibody was demonstrated by analyzing protein lysates from thymus and spleen of WT and G2A-/- mice. As shown in Fig. 1A, the polyclonal antibody detected a major band of ≈53 kDa exclusively in lysates from WT mice. The less intense lower molecular weight band is also G2A-specific and probably represents a precursor form of this receptor (M.R. and O.N.W., unpublished observation).
Fig. 1.
Expression of G2A in DO11.10 cells. (A) (Upper) Detection of G2A by Western blot by using the rabbit polyclonal antibody. (Lower) Extracellular signal-regulated kinase 2 loading control using a polyclonal rabbit antibody from Santa Cruz Biotechnology. (B)(Upper) RT-PCR analysis of the expression of LP-specific GPCRs and of ATX in DO11.10 cells. (Lower) Control RT-PCR by using a mixture of cDNAs from mouse brain, heart, spleen, and prostate.
We used this antibody to screen several lymphoid and myeloid cell lines for G2A expression (data not shown). Among the G2A-positive cell lines, the murine T hybridoma DO11.10 was found to have several advantages: (i) the amount of G2A in these cells is similar to that detected in thymocytes (Fig. 1 A); (ii) these cells have a T cell phenotype and may therefore be representative for the immune cellular context of G2A function; and (iii) their expression of a T cell receptor (TCR) of known specificity allows multiple ways of activation by using either crosslinking antibodies against the TCR or peptide-pulsed antigen-presenting cells.
To further characterize the DO11.10 cells, we performed a more detailed expression analysis of GPCRs that could be functionally related to G2A. In this category, we included three GPCRs that share a high degree of sequence identity with G2A: TDAG8 (14), GPR4 (15), and OGR1 (16). We also included in our analysis eight other GPCRs with specificity toward LPA and S1P, two extensively studied LPs structurally related to LPC (reviewed in ref. 2). Moreover, we also determined the expression of autotaxin (ATX) (17), an enzyme with lysophospholipase D (lysoPLD) activity that, if produced by DO11.10 cells, could convert exogenously added LPC to LPA. According to the RT-PCR results shown in Fig. 1B, we detected expression of TDAG8, OGR1, LPA2, S1P1, S1P2 and S1P4. However, DO11.10 cells did not express ATX.
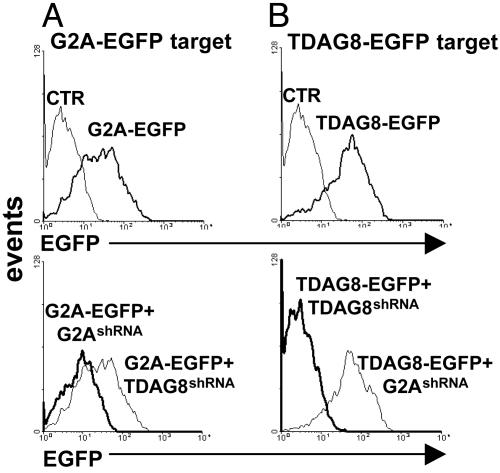
Chronic Suppression of G2A mRNA by Using Stably Integrated siRNA with Colinked Fluorescent Markers. Recent developments in the field of posttranscriptional gene silencing have resulted in multiple ways to generate siRNAs (reviewed at www.ambion.com/techlib/tn/103/2.html). Because no canonical rules are currently available for prediction of highly active siRNA sequences, we used a simple strategy to screen potential siRNAs for efficacy and specificity. For this strategy, we generated expression plasmids encoding EGFP fusions of G2A and, as a control, TDAG8. We transfected these plasmids in HEK 293 T cells, alone or in combination with silencing vectors encoding shRNA driven by the RNA polymerase III-dependent H1 promoter (12). We evaluated the efficacy of shRNA-mediated suppression 48 h posttransfection by using the EGFP signal as an indicator of target gene expression (Fig. 2). Typically, three potential shRNAs were tested for each gene.
Fig. 2.
Cotransfection of EGFP-tagged GPCRs and sh RNAs encoding plasmids to select siRNA target sequences. HEK 293T cells were transfected with expression vectors encoding G2A-EGFP (A) or TDAG8-EGFP (B) fusions, alone or in combination shRNA plasmids. Forty-eight hours later, the level of EGFP fluorescence was determined by fluorescence-activated cell sorting and used as an indicator of silencing efficiency.
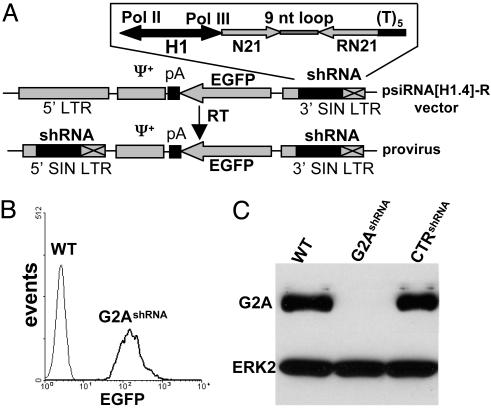
For chronic suppression of G2A expression, the most efficient shRNA sequence was incorporated into the psiRNA[H1.4]-R retroviral vector (Fig. 3A). The design of this vector was based on the bidirectional properties of the H1 promoter (18) to simultaneously drive the expression of a reporter gene (EGFP) and of the effector shRNA (Fig. 3A). Fig. 3B demonstrates the expression of EGFP driven by the H1 promoter in retrovirus-infected DO11.10 cells. As shown by immunoblotting, the expression of G2A in these cells was reduced by at least 90% (Fig. 3C). This effect was found to be stable over a period of at least 5 mo (data not shown). Cells transduced with a control shRNA retrovirus (CTRshRNA, containing a mismatched siRNA derived from the human TDAG8 sequence) showed no reduction in the amount of G2A (Fig. 3C).
Fig. 3.
siRNA-mediated silencing of G2A in DO11.10 cells. (A) Retroviral vector design. The bidirectional human H1-RNA promoter (H1) coordinates expression of the effector shRNA (RNA polymerase III-dependent) and of EGFP (RNA polymerase II-dependent). Reverse transcription results in the duplication of the shRNA cassette inserted in the 3′ self-inactivating retroviral LTR (3′ SIN LTR): N21, target sequence, sense; RN21, target sequence, antisense; (T)5, termination signal for the RNA polymerase III; pA, polyadenylation signal. (B) Expression of the EGFP-colinked marker by retrovirally transduced DO11.10 cells. (C)(Upper) Western blot analysis by using the rabbit polyclonal antibody of the expression of G2A in DO11.10 T cells transduced with G2A-specific (G2AshRNA) or control (CTRshRNA) shRNA encoding retroviruses. (Lower) Extracellular signal-regulated kinase 2 loading control.
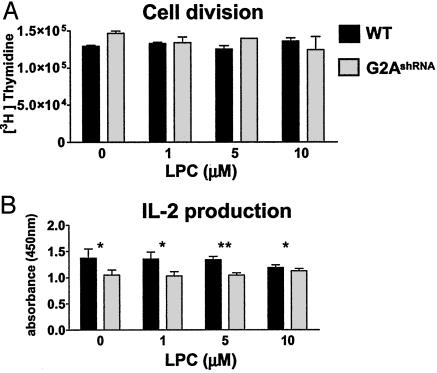
siRNA-Mediated Suppression of G2A Is Well Tolerated by DO11.10 Cells. To rule out a generally toxic effect of retrovirally introduced siRNA in DO11.10 cells, we monitored their rate of division and IL-2 production. As shown in Fig. 4A, we did not find any significant changes in [3H]thymidine incorporation, which was used as an indicator for the rate of DNA synthesis. The growth of WT or G2A-suppressed DO11.10 cells (G2AshRNA) was also insensitive to LPC administration over a 12-h period (Fig. 4A).
Fig. 4.
Chronic siRNA-mediated suppression of G2A is well tolerated by DO11.10 cells. (A) DNA synthesis rate. The 5 × 10⁴ WT or G2A-silenced DO11.10 cells (G2AshRNA) in SFM containing 0.1% FAF-BSA were treated with indicated concentrations of LPC. The rate of DNA synthesis was determined by pulsing the cells with [3H]thymidine for 12 h. (B) IL-2 production. The 5 × 10⁴ DO11.10 cells in SFM with 0.1% FAF-BSA were stimulated for 24 h with 5 μg/ml plate-bound antibody against the CD3ε chain (2C11-145) in the presence of indicated amounts of LPC. Production of IL-2 was determined by capture ELISA. The results are representative of three independent experiments. *, P > 0.05; **, P < 0.05. Student's t test was performed by using prism software (GraphPad, San Diego). P < 0.05 was considered to be statistically significant.
To determine the IL-2 production of WT and G2AshRNA cells, we activated them with plate-bound antibodies against the CD3ε chain of the T cell receptor complex. Suppression of G2A resulted in a modest decrease in IL-2 production (Fig. 4B). The addition of various concentrations of LPC did not significantly modulate the production of this cytokine (Fig. 4B). These results indicate the lack of global detrimental effects induced by chronic siRNA-mediated suppression of G2A in these cells. Furthermore, they suggest that, in DO11.10 cells, the growth rate and the IL-2 production are not critically dependent on LPC-G2A signaling.
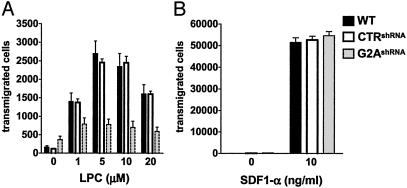
G2A Is Required for Chemotaxis of DO11.10 Cells to LPC. A chemotactic role for LPC has been previously suggested (19, 20), but the receptor involved has not been identified. To determine the requirement for endogenous expression of G2A in LPC-induced chemotaxis, we examined the migration of DO11.10 cells toward this LP in a transwell-based assay. As shown in Fig. 5A, WT cells or cells transduced with an irrelevant shRNA (CTRshRNA) migrate in a dose-dependent manner to LPC. The maximal number of transmigrated cells is observed at 5–10 μM LPC. In contrast, at these concentrations of ligand, the migration of G2A suppressed cells (G2AshRNA) is significantly impaired.
Fig. 5.
G2A-dependent chemotaxis to LPC. Equal numbers (2 × 10⁵) of WT and G2AshRNA or control (CTRshRNA) DO11.10 cells were washed three times with SFM containing 0.1% FAF-BSA, mixed, and added to the upper chamber of a 24-well plate with 5.0-μm pore size polycarbonate filters (Costar). LPC (A) or SDF1-α (B) was added to the lower chamber. After a 2-h incubation at 37°C in an 8% CO2 incubator, transmigrated WT and EGFP-positive siRNA-transduced cells were counted by fluorescence-activated cell sorting. The results are representative of four independent experiments.
To rule out the possibility that suppression of G2A might have a more general effect on cell motility, we examined the migration of these cells toward SDF1-α, a ligand for the endogenous chemokine receptor, CXCR4 (21). As anticipated, suppression of G2A had no effect on chemotaxis toward SDF1-α (Fig. 5B). Interestingly, in contrast to LPC, a much lower concentration of the chemokine (10 ng/ml) was required to induce migration of DO11.10 cells (Fig. 5). The number of transmigrated cells at this concentration of SDF1-α was also significantly higher than the maximal response observed with 5–10 μM LPC. Another LP, S1P, induced chemotactic responses of the same magnitude as LPC, albeit at lower optimal concentrations (1–100 nM, data not shown and ref. 22).
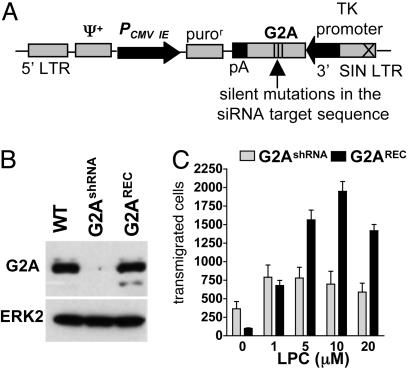
Reconstitution of G2A Expression Rescues the LPC Chemotactic Responses of siRNA-Engineered DO11.10 Cells. RNAi approaches rely on a high degree of specificity based on the requirement for near identity between the siRNA and the target mRNA (23). However, this concept has been challenged in more recent studies (24–26). To avoid any possible artifacts induced by RNAi-mediated off-target gene regulation, we followed the recent recommendations (27) for specificity controls. Accordingly, we reasoned that whether the migratory defect to LPC is specifically linked to G2A suppression, this phenotype should be rescued by reconstitution of receptor expression. To avoid suppression of the reintroduced gene by chronically expressed shRNA, three nucleotides within the G2A target sequence were mutagenized without changing the encoded amino acid. This form of G2A was expressed by using a retroviral vector containing the relatively weak thymidine kinase promoter (Fig. 6A). Selection of this promoter allowed the expression of the reconstituted G2A at a similar level to that of the endogenous gene (Fig. 6B). This procedure restored the LPC-induced chemotactic responses in DO11.10 cells suppressed for the expression of the endogenous receptor (Fig. 6C), thereby confirming the specificity of the siRNA-induced phenotype.
Fig. 6.
Reconstitution of G2A expression in shRNA-transduced cells rescues chemotaxis to LPC. (A) Schematic representation of the retroviral vector used for G2A reconstitution. The immediate early cytomegalovirus promoter (PCMV IE) drives the expression of the puromycin resistance gene (puror). Expression of the siRNA refractory form of G2A is driven by the thymidine kinase promoter. (B) A Western blot to determine expression levels of G2A in WT, G2AshRNA, and G2AshRNA cells transduced with the G2A reconstitution vector (G2AREC) and selected by using 1 μg/ml puromycin. (C) Chemotaxis of G2AshRNA and G2AREC cells to various concentrations of LPC. The results are representative of three independent experiments.
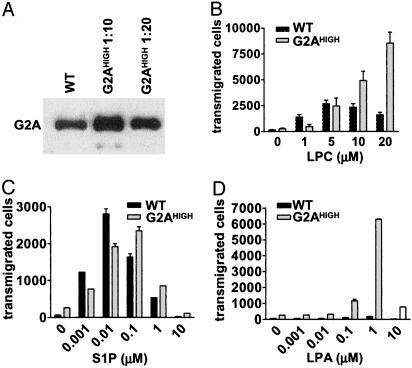
Overexpression of G2A in DO11.10 Cells Enhances Transmigration to LPC. Previous studies in fibroblasts and HeLa cells overexpressing G2A have documented ligand-independent effects on cell division and survival induced by receptor overexpression (4, 6, 8). To determine whether these effects are cell contextdependent, we transduced DO11.10 cells with a retrovirus in which expression of G2A is driven by the strong 5′ LTR (5). This outcome resulted in an ≈20-fold increase over the endogenous level of G2A (Fig. 7A). We could not detect any impact of this significant increase in G2A expression on the rate of DNA synthesis, survival, or activation-induced IL-2 production in DO11.10 cells (data not shown).
Fig. 7.
Effects of G2A overexpression in DO11.10 cells. (A) A Western blot to estimate the amount of G2A in cells overexpressing the receptor (G2AHIGH, lysates from these cells were diluted 10- and 20-fold before analysis). Chemotaxis of WT and G2AHIGH cells to LPC (B), S1P (C), and LPA (D) is shown. The results are representative of three independent experiments.
However, when we examined the chemotactic responses of these cells to LPC, we observed that, in contrast to WT responses that are saturated at 5–10 μM LPC, G2A-overexpressing cells (G2AHIGH) show significantly enhanced transmigration to higher concentrations of ligand (Fig. 7B). These results confirm the phenotype observed in G2A-suppressed cells and show that overexpression of the receptor per se is not sufficient to enhance transmigration of DO11.10 cells. These results are in contrast to a recent study (22) showing ligand-independent transmigration of Jurkat T cells overexpressing the S1P4 receptor.
To determine whether overexpression of G2A modifies chemotactic responses to factors other than LPC, we analyzed migration of G2AHIGH cells to the SDF1-α chemokine or to LPs such as SPC, LPA, and S1P.
We were surprised to find that overexpression of G2A actually suppressed chemotactic responses to 10 ng/ml SDF1-α by ≈50% (data not shown). This result may suggest that the excess of G2A could lead to sequestration of signaling molecules shared by these two GPCRs. Similar to our previous observations in Jurkat T cells overexpressing G2A (5), we failed to detect any G2A-dependent chemotactic responses to SPC (data not shown). Therefore, despite being previously identified as a second G2A ligand (28), SPC does not appear to recapitulate the chemotactic effects of LPC.
Whereas overexpression of G2A did not significantly modify chemotaxis to S1P (Fig. 7C), we were intrigued to observe the effects induced on LPA-mediated migration. While at the RNA level, we can detect the expression of the LPA2 receptor (Fig. 1B), WT and G2A-suppressed DO11.10 cells do not migrate in response to a wide range of LPA concentrations (Fig. 7D and data not shown). However, overexpression of G2A resulted in significant chemotaxis to 0.1 and 1 μM LPA (Fig. 7D). Whereas the simplest explanation for this observation would be that LPA is an additional ligand for G2A, our previous functional and binding studies (5) argue against this possibility. An alternative hypothesis would be that overexpression of G2A in DO11.10 cells amplifies an otherwise undetectable response to LPA through the endogenous LPA2 receptor. If true, this finding would be indicative of a synergistic crosstalk between these two GPCRs, similar to that previously reported for bradykinin B2 and adenosine A1 receptors (29).
Discussion
G2A Is Required for Chemotaxis of DO11.10 T Lymphoid Cells Toward LPC. In this report, we addressed the consequences of varying the expression level of the LPC receptor, G2A, in the murine T lymphoid cell line DO11.10. In these cells, siRNA-mediated suppression and retroviral transduction of G2A allowed us to cover a broad range of receptor levels (from <10% to 20-fold over endogenous expression). These experimentally induced variations in the amount of G2A did not alter the basal growth rate of DO11.10 cells or their IL-2 production. However, the ability of these cells to migrate toward LPC was significantly reduced after siRNA-mediated suppression of G2A. This finding represents, to our knowledge, the first demonstration of an LPC-induced effect dependent on the endogenous expression of G2A.
Chemotaxis of DO11.10 cells to LPC was also found to increase significantly after overexpression of G2A by retroviral transduction. In contrast to the siRNA-induced phenotype that specifically affected LPC-dependent chemotaxis, overexpression of G2A also modified responses to other factors such as SDF1-α and LPA. Numerous studies have demonstrated that activation of one particular signaling pathway of a GPCR can either amplify or inhibit the intracellular pathway of another (reviewed in ref. 30). Further work is required to determine whether our findings represent the manifestations of such synergistic or antagonistic crosstalk events. In the case of LPA chemotaxis, the crosstalk hypothesis would be confirmed whether migration of G2AHIGH cells to this factor is shown to depend on the expression of the endogenous LPA2 receptor. Regarding the inhibitory effect of G2A overexpression on SDF1-α-mediated chemotaxis, we observed a similar phenomenon in a macrophage cell line. Accordingly, overexpression of G2A in these cells significantly inhibited their chemotaxis toward the complement activation product C5a (L.V.Y. and O.N.W., unpublished observation).
The Chemotactic Effect of LPC on DO11.10 Cells Does Not Appear to Depend on ATX-Mediated Conversion to LPA. Recently, the widely expressed ectophosphodiesterase ATX, was shown to have a potent lysoPLD activity that mediates LPC conversion to LPA (17). A direct implication of this finding would be that, in the presence of the ATX lysoPLD activity, biological effects previously attributed to LPC could be actually mediated by its metabolite, LPA, through one of the several endogenous LPA receptors. In the case of the chemotactic effect examined in the current study, this interpretation does not seem to be correct because DO11.10 WT cells fail to migrate to a wide range of LPA concentrations (Fig. 7D), despite endogenous expression of the LPA2 receptor (Fig. 1B). Moreover, these cells do not express ATX (Fig. 1B).
Constitutive Activation of G2A Versus LPC-Dependent Effects. Certain G2A effects induced by ectopic overexpression of the receptor occurred in the absence of exogenously added ligand (4, 6–8). It is therefore possible that these effects are the manifestation of ligand-independent constitutive activation. Alternatively, these effects could be the consequence of autocrine stimulation by low amounts of LPC produced by the cells. A similar hypothesis has been proposed to explain the apparent ligand-independent effects including migration observed after overexpression of some of the LPA and S1P receptors (22, 31, 32). Nevertheless, in our system, overexpression of G2A without LPC addition is not sufficient to significantly enhance transmigration of DO11.10.
An intriguing observation related to constitutive activation was proposed in a recent study (33). The authors demonstrate that OGR1 and GPR4, two GPCRs related by a high degree of sequence identity to G2A, can transduce signals independent of their previously identified ligand, SPC (28). Based on the enhancement of these signals by acidic pH, they proposed that OGR1 and GPR4 are proton-sensing GPCRs. This observation prompted us to examine whether variations in pH similar to those investigated by Ludwig et al. (33) could modulate the G2A-dependent chemotactic responses of DO11.10 cells to LPC. We failed to observe any effect of the pH of the medium on LPC-induced chemotaxis, with the exception of a 50% reduction at pH 6.5 (Fig. 8, which is published as supporting information on the PNAS web site).
A Potential Link Between G2A-Mediated Chemotaxis to LPC and Maintenance of Immunological Tolerance. A recent study (34) has demonstrated that LPC produced from phosphatidylcholine by calcium-independent phospholipase A2 (iPLA2) during apoptosis is a chemotactic factor for human monocytic/macrophage cell lines. Based on this finding, the authors proposed a possible role for the LPC receptor, G2A, in the process of efficient removal of apoptotic cells and prevention of postapoptotic necrosis that could predispose to autoimmunity. Studies to examine whether clearance of apoptotic cells is impaired in autoimmune-prone G2A-/- mice are warranted. In conclusion, we have demonstrated a requirement for G2A in migration of a T lymphoid cell line to LPC. The system described here, based on siRNA-mediated chronic suppression of G2A expression, is amendable to reconstitution with various mutant receptors and therefore should prove suitable for future structure-function studies of this GPCR and of its ligand.
Supplementary Material
Acknowledgments
We thank Dr. Inder Verma and members of his laboratory for valuable discussions on siRNA strategies; Drs J. Kappler and P. Marrack for generously providing DO11.10 cells; Shirley Quan, Donghui Cheng, and Michelle Yu for outstanding technical assistance; Barbara Anderson for excellent preparation of the manuscript; and Purnima Dubey, Li Weng, Amar Nijagal, and Roger Lo for critically reviewing the manuscript. Portions of this work were supported by funds from the Plum Foundation. O.N.W. is an Investigator of the Howard Hughes Medical Institute. C.G.R. is supported by a Cancer Research Institute fellowship.
Abbreviations: GPCR, G protein-coupled receptor; LPC, lysophosphatidylcholine; LP, lysophospholipid; S1P, sphingosine 1-phosphate; LPA, lysophosphatidic acid; SPC, sphingosylphosphorylcholine; SDF1-α, stromal cell-derived factor 1 α; FAF-BSA, fatty acid-free BSA; siRNA, small interfering RNA; shRNA, short hairpin RNA; EGFP, enhanced GFP; SFM, serum-free medium; ATX, autotaxin.
References
- 1.Lombardi, M. S., Kavelaars, A. & Heijnen, C. J. (2002) Crit. Rev. Immunol. 22, 141-163. [PubMed] [Google Scholar]
- 2.Fukushima, N., Ishii, I., Contos, J. J., Weiner, J. A. & Chun, J. (2001) Annu. Rev. Pharmacol. Toxicol. 41, 507-534. [DOI] [PubMed] [Google Scholar]
- 3.Kabarowski, J. H., Xu, Y. & Witte, O. N. (2002) Biochem. Pharmacol. 64, 161-167. [DOI] [PubMed] [Google Scholar]
- 4.Weng, Z., Fluckiger, A. C., Nisitani, S., Wahl, M. I., Le, L. Q., Hunter, C. A., Fernal, A. A., Le Beau, M. M. & Witte, O. N. (1998) Proc. Natl. Acad. Sci. USA 95, 12334-12339. [DOI] [PMC free article] [PubMed] [Google Scholar]
- 5.Kabarowski, J. H. S., Zhu, K., Le, L. Q., Witte, O. N. & Xu, Y. (2001) Science 293, 702-705. [DOI] [PubMed] [Google Scholar]
- 6.Lin, P. & Ye, R. D. (2003) J. Biol. Chem. 278, 14379-14386. [DOI] [PubMed] [Google Scholar]
- 7.Kabarowski, J. H. S., Feramisco, J. D., Le, L. Q., Gu, J. L., Luoh, S. W., Simon, M. I. & Witte, O. N. (2000) Proc. Natl. Acad. Sci. USA 97, 12109-12114. [DOI] [PMC free article] [PubMed] [Google Scholar]
- 8.Zohn, I. E., Klinger, M., Karp, X., Kirk, H., Symons, M., Chrzanowska-Wodnicka, M., Der, C. J. & Kay, R. J. (2000) Oncogene 19, 3866-3877. [DOI] [PubMed] [Google Scholar]
- 9.Le, L. Q., Kabarowski, J. H. S., Weng, Z., Satterthwaite, A. B., Harvill, E. T., Jensen, E. R., Miller, J. F. & Witte, O. N. (2001) Immunity 14, 561-571. [DOI] [PubMed] [Google Scholar]
- 10.Le, L. Q., Kabarowski, J. H., Wong, S., Nguyen, K., Gambhir, S. S. & Witte, O. N. (2002) Cancer Cell 1, 381-391. [DOI] [PubMed] [Google Scholar]
- 11.White, J., Haskins, K. M., Marrack, P. & Kappler, J. (1983) J. Immunol. 130, 1033-1037. [PubMed] [Google Scholar]
- 12.Brummelkamp, T. R., Bernards, R. & Agami, R. (2002) Science 296, 550-553. [DOI] [PubMed] [Google Scholar]
- 13.Paddison, P. J., Caudy, A. A., Bernstein, E., Hannon, G. J. & Conklin, D. S. (2002) Genes Dev. 16, 948-958. [DOI] [PMC free article] [PubMed] [Google Scholar]
- 14.Choi, J. W., Lee, S. Y. & Choi, Y. (1996) Cell. Immunol. 168, 78-84. [DOI] [PubMed] [Google Scholar]
- 15.Mahadevan, M. S., Baird, S., Bailly, J. E., Shutler, G. G., Sabourin, L. A., Tsilfidis, C., Neville, C. E., Narang, M. & Korneluk, R. G. (1995) Genomics 30, 84-88. [DOI] [PubMed] [Google Scholar]
- 16.Xu, Y., Zhu, K., Hong, G., Wu, W., Baudhuin, L. M., Xiao, Y. & Damron, D. S. (2000) Nat. Cell Biol. 2, 261-267. [DOI] [PubMed] [Google Scholar]
- 17.Umezu-Goto, M., Kishi, Y., Taira, A., Hama, K., Dohmae, N., Takio, K., Yamori, T., Mills, G. B., Inoue, K., Aoki, J. & Arai, H. (2002) J. Cell Biol. 158, 227-233. [DOI] [PMC free article] [PubMed] [Google Scholar]
- 18.Ame, J. C., Schreiber, V., Fraulob, V., Dolle, P., de Murcia, G. & Niedergang, C. P. (2001) J. Biol. Chem. 276, 11092-11099. [DOI] [PubMed] [Google Scholar]
- 19.Hoffman, R. D., Kligerman, M., Sundt, T. M., Anderson, N. D. & Shin, H. S. (1982) Proc. Natl. Acad. Sci. USA 79, 3285-3289. [DOI] [PMC free article] [PubMed] [Google Scholar]
- 20.Quinn, M. T., Parthasarathy, S. & Steinberg, D. (1988) Proc. Natl. Acad. Sci. USA 85, 2805-2809. [DOI] [PMC free article] [PubMed] [Google Scholar]
- 21.Tashiro, K., Tada, H., Heiker, R., Shirozu, M., Nakano, T. & Honjo, T. (1993) Science 261, 600-603. [DOI] [PubMed] [Google Scholar]
- 22.Graler, M. H., Grosse, R., Kusch, A., Kremmer, E., Gudermann, T. & Lipp, M. (2003) J. Cell. Biochem. 89, 507-519. [DOI] [PubMed] [Google Scholar]
- 23.Elbashir, S. M., Harborth, J., Lendeckel, W., Yalcin, A., Weber, K. & Tuschl, T. (2001) Nature 411, 494-498. [DOI] [PubMed] [Google Scholar]
- 24.Jackson, A. L., Bartz, S. R., Schelter, J., Kobayashi, S. V., Burchard, J., Mao, M., Li, B., Cavet, G. & Linsley, P. S. (2003) Nat. Biotechnol. 21, 635-637. [DOI] [PubMed] [Google Scholar]
- 25.Sledz, C. A., Holko, M., de Veer, M. J., Silverman, R. H. & Williams, B. R. (2003) Nat. Cell Biol. 5, 834-839. [DOI] [PubMed] [Google Scholar]
- 26.Bridge, A. J., Pebernard, S., Ducraux, A., Nicoulaz, A. L. & Iggo, R. (2003) Nat. Genet. 34, 263-264. [DOI] [PubMed] [Google Scholar]
- 27.Anonymous (2003) Nat. Cell Biol. 5, 489-490. [DOI] [PubMed] [Google Scholar]
- 28.Zhu, K., Baudhuin, L. M., Hong, G., Williams, F. S., Cristina, K. L., Kabarowski, J. H. S., Witte, O. N. & Xu, Y. (2001) J. Biol. Chem. 276, 41325-41335. [DOI] [PubMed] [Google Scholar]
- 29.Quitterer, U. & Lohse, M. J. (1999) Proc. Natl. Acad. Sci. USA 96, 10626-10631. [DOI] [PMC free article] [PubMed] [Google Scholar]
- 30.Cordeaux, Y. & Hill, S. J. (2002) Neurosignals 11, 45-57. [DOI] [PubMed] [Google Scholar]
- 31.Van Brocklyn, J. R., Graler, M. H., Bernhardt, G., Hobson, J. P., Lipp, M. & Spiegel, S. (2000) Blood 95, 2624-2629. [PubMed] [Google Scholar]
- 32.Yoshida, A. & Ueda, H. (1999) Biochem. Biophys. Res. Commun. 259, 78-84. [DOI] [PubMed] [Google Scholar]
- 33.Ludwig, M. G., Vanek, M., Guerini, D., Gasser, J. A., Jones, C. E., Junker, U., Hofstetter, H., Wolf, R. M. & Seuwen, K. (2003) Nature 425, 93-98. [DOI] [PubMed] [Google Scholar]
- 34.Lauber, K., Bohn, E., Krober, S. M., Xiao, Y. J., Blumenthal, S. G., Lindemann, R. K., Marini, P., Wiedig, C., Zobywalski, A., Baksh, S., et al. (2003) Cell 113, 717-730. [DOI] [PubMed] [Google Scholar]
Associated Data
This section collects any data citations, data availability statements, or supplementary materials included in this article.


