Abstract
Gene expression and silencing in eukaryotic systems can be controlled by regulatory elements acting over a distance. Here, we analyze chromatin conformation of the 24-kb region of the Ifng gene during CD4+ T helper (Th) cell differentiation. We find that chromatin within this region is a highly flexible structure that undergoes dynamic changes during the course of transcriptional activation and silencing of the Ifng gene. Each Th subset displays a common core conformation in this gene region and unique features that distinguish neutral and effector Th1 and Th2 lineages. This chromatin configuration brings distal regions into close proximity to the gene. Th1 cells that produce high levels of IFN-γ display the most open conformation. In contrast, IFN-γ silent Th2 cells have a tightly closed conformation. Therefore, we postulate that there is a direct structure–function relationship between the spatial organization of the chromatin around the Ifng gene and its transcriptional potential.
CD4+ T cells differentiate from a common naïve precursor into effector T helper type-1 (Th1) and T helper type-2 (Th2) subsets. As a result, differentiated effector T cells display mutually exclusive patterns of cytokine gene expression (1–4). Th1 cells characteristically transcribe the Ifng gene and Th2 cells transcribe the Il4, Il13, and Il5 genes, but not the Ifng gene. These differentiation events are associated with progressive structural reorganization of the chromatin in effector cytokine genes, including induction of DNase I hypersensitive sites (HS), acetylation of histones and DNA demethylation (5-7). Chromatin remodeling of cytokine genes is associated with productive T cell differentiation that is believed to make chromatin more accessible for binding of transcription factors to initiate gene transcription (8–10). Three HS are found in the Ifng gene, two are located in intron 1, and the third is located in intron 3. Only one HS is open in Th2 cells, whereas all three sites are open in Th1 cells (9, 11).
Initiation of transcription is controlled by lineage-specific and general transcription factors. Such factors interact with enhancer sites and the minimal promoter. These interactions may occur over relatively short distances or over large distances. Recently, using a transgenic system, we obtained evidence that distal regulatory elements are required to achieve lineage-specific Ifng gene expression in T cells but are not required to achieve high levels of gene expression (12). The notion that specific interactions between distant genomic loci happen through looping and bending of chromatin has been proposed (13–15). It is known that binding of regulatory proteins to DNA alters the conformation of DNA, making specific fragments curve and change their spatial orientation (16–18). Cis-acting regulatory elements such as enhancers, silencers, or insulators may act at the chromatin level by causing conformational and structural changes in the chromatin. On the other hand, the DNA molecule itself possesses the quality of a flexible polymer fiber that can adopt a variety of different conformations in its secondary and tertiary structure when organized into a nucleoprotein complex (19-21). Thus, it is reasonable to expect that the spatial configuration of chromatin could have a considerable effect on the long-range interaction between transcription factors and the promoter, providing a mechanism by which biological regulation of gene expression is achieved.
A method has been developed that can capture chromosome conformation (chromosome conformation capture assay, or 3C assay), in vivo (22). This method has been tested to analyze the conformation of a yeast chromosome at different stages of cell division. In addition, the 3C methodology has been applied to the study of the β-globin gene family locus in expressing versus nonexpressing mammalian tissues. These results confirm the hypothesis that chromatin in living cells can adopt a certain spatial configuration to bring together genes, HS, and locus control regions (23).
These two studies provide experimental evidence to support the looping model of interactions between regulatory sites over a large distance during gene expression. However, little is known about the spatial organization of chromatin in a single gene or in the area closely surrounding one gene, which has an equal potential to be expressed or silenced in the course of cell differentiation. It seems intriguing to imagine that, to provide the appropriate environment for rapid gene expression or silencing, local conformational alterations in the gene may be required. Thus, we used the 3C technique to test the hypothesis that the Ifng gene exhibits distinct chromatin conformations during development of helper T cells into mature effector cells with polarized cytokine profiles.
Experimental Procedures
Mice, Cell Cultures, and in Vitro T Cell Differentiation. C57BL/6 mice were obtained from The Jackson Laboratory. Mice were maintained in pathogen-free conditions in the animal facility at Vanderbilt University and used between 4 and 6 weeks of age.
Cell cultures were performed by standard methods, essentially as described (24). Briefly, single-cell suspensions of spleen were prepared from 4- to 6-week-old mice. Red blood cells were removed by hypotonic lysis. CD4+ T cells were purified by negative selection using magnetic beads (Genome Therapeutics, Waltham, MA). Average purity of CD4+ cells was ≈90% as determined by flow cytometry.
Tissue culture plates were coated with 10 μg/ml anti-CD3 mAb (145-2C11 clone, American Type Culture Collection) overnight at 4°C and thoroughly washed with HBSS. Purified CD4+ T cells (1 × 10⁻⁶ per ml) were stimulated with plate-bound anti-CD3 mAb and syngeneic irradiated spleen cells at a density of 1 × 10⁻⁶ cells per ml in RPMI medium 1640 containing 10% FCS, 100 units/ml penicillin, 100 units/ml streptomycin, 2 mM l-glutamine, and 5 × 10⁻⁵ M 2-mercapto-ethanol. Cells were cultured for 5 days (primary stimulation) under neutral (no further additives), Th1 [5 ng/ml recombinant mouse IL-12 (BD Pharmingen), and 10 μg/ml anti-IL-4 mAb (11B11, American Type Culture Collection)], or Th2 [5 ng/ml IL-4 (BD Pharmingen) and 10 μg/ml anti-IFN-γ mAb] conditions. After 5 days, cell cultures were harvested, thoroughly washed in media, and restimulated with plate-bound anti-CD3 mAb without addition of cytokines and cultured for 2 more days. At days 2 and 5 after primary stimulation and at day 2 after restimulation, cells were harvested for analysis of chromatin conformation by 3C assay and for cytokine production.
Cytokine Staining and Analysis. IFN-γ was measured by standard cytokine ELISA as described (12). In parallel, intracellular levels of IFN-γ were measured by flow cytometry essentially as described to assess numbers of cells producing IFN-γ in each culture (12).
3C Assay. We used the 3C assay (22) with some modifications. The assay was performed with nuclei isolated from live T cell cultures. Harvested cells were resuspended in cell lysis buffer with protease inhibitors, homogenized with a B-dounce homogenizer on ice, and centrifuged to pellet the nuclei. The suspension was diluted to achieve a final concentration of 1 × 10⁻⁸ nuclei per ml. To cross-link proteins and DNA, paraformaldehyde (Sigma) was added directly to isolated intact nuclei to achieve a final concentration of 1% in 3C buffer. Nuclei were incubated on a rocking platform for optimal cross-linking and glycine (0.125 M final concentration) was added after 10 min to stop the reaction. To remove non-cross-linked proteins from DNA, SDS (Sigma) was added to a final concentration of 0.1% for 10 min. Before EcoRI digestion, Triton X-100 (Sigma) was added to a final concentration of 1% to sequester SDS.
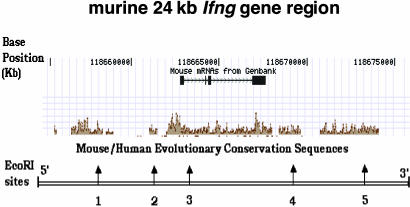
EcoRI (New England Biolabs) restriction enzyme (RE) digestion was optimized and monitored by PCR using primer pairs designed specifically for each of five EcoRI restriction sites in the Ifng gene 24-kb region (Fig. 1). The incubation time for complete digestion of chromatin was 2 h at 37°C. After that, 1.6% SDS was added for 20 min at 65°C to inactivate EcoRI. Optimal conditions for intramolecular ligation of cross-linked fragments (T4 ligase, New England Biolabs) at a very low DNA concentration were established by using DNA at different concentrations and monitoring products of ligation by PCR. To find the linear range for cross-linked template, samples were serially diluted before ligation (starting concentration ≈100 ng of DNA per PCR reaction). Cross-linking was reversed by overnight incubation of samples with proteinase K at 65°C, followed by phenol-chloroform purification of DNA.
Fig. 1.
Schematic representation of the 24-kb Ifng gene on mouse chromosome 10. Location of EcoRI restriction sites in the 24-kb region of Ifng gene are shown. The positions of exons and introns are shown relative to the mapped mouse/human evolutionary conserved DNA sequences. Base count in the DNA region is indicated according to the University of California, Santa Cruz, Genome browser (www.genome.ucsc.edu). Positions of the five restriction sites from the start site of the Ifng gene are as follows: site 1, -5,048; site 2, -1,248; site 3, +229; site 4, +6,891; site 5, +10,264.
Control templates were produced by omitting the paraformaldehyde cross-linking step. Purified DNA was digested with EcoRI and randomly ligated without dilution. Cross-linked and control DNA preparations, derived from neutral, Th1, and Th2 cell cultures after primary and secondary stimulation, were subjected to PCR amplification with site-specific primer pairs and analyzed further.
PCR Analysis of the Ligation Products. Primer pairs were designed to span each of five RE sites positioned along the 24-kb region of the mouse Ifng gene (Fig. 1). Forward and reverse primers were used for cross-linked and control templates in all pairwise homologous (1 + 1, 2 + 2, 3 + 3, 4 + 4, 5 + 5) and nonhomologous (1 + 2, 1 + 3, 1 + 4, 1 + 5, etc.) combinations. All PCR products were resolved by electrophoresis on 2% agarose gels containing ethidium bromide and quantified by using Stratagene Image Analyzer (Stratagene). Conditions were optimized to yield strong PCR signals and approximately equivalent yields of PCR product for each homologous pair of primers. Samples were run in duplicate, experiments were repeated three times, and the results were averaged. Cross-linking frequency of two specific sites was determined by quantitation of PCR products from cross-linked and control templates. Cross-linking frequency (X) was calculated as a ratio of the amount of PCR product obtained from cross-linked template (A) to the amount of PCR product obtained from control template (B) and calculated by using the equation X = A/B (22-25). Ratios of quantities of PCR products from homologous primer pairs were used to calculate relative cross-linking frequencies and assigned a value of 10. Ratios of quantities of PCR products from nonhomologous primer pairs were scaled from 0 to 10 on the y axis to allow direct comparison of the data.
Results and Discussion
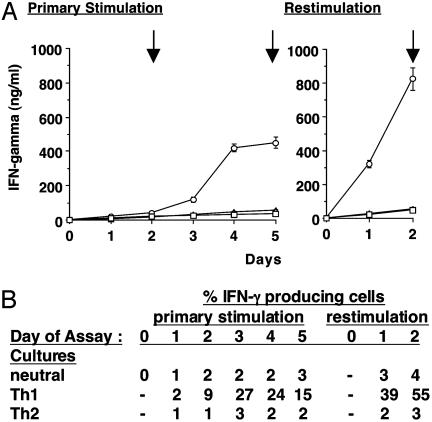
Th Cell Differentiation. We aimed to monitor conformation of the Ifng gene region during Th cell differentiation. Purified CD4+ T cells were stimulated with plate-bound anti-CD3 mAb under neutral, Th1, or Th2 conditions. After 5 days, cultures were harvested and restimulated with plate-bound anti-CD3 for 2 additional days. To examine chromosome conformation during periods of relative Ifng transcriptional inactivity, activity, and silencing, cultures were harvested on days 2 and 5 after primary stimulation and 2 days after secondary stimulation for 3C assays. On day 2, T cells cultured under neutral, Th1, or Th2 conditions are relatively undifferentiated as indicated by levels of IFN-γ in the cultures and numbers of cells producing IFN-γ (Fig. 2). On days 3–5, numbers of IFN-γ producing cells increase markedly in Th1 cultures but not in neutral or Th2 cultures. By day 5, cultures under Th1 conditions contain much higher levels of IFN-γ than neutral or Th2 cultures. Restimulation of cells with plate-bound anti-CD3 clearly demonstrates that Th1 effector cells now produce high levels of IFN-γ in an IL-12-independent fashion, whereas neutral Th and Th2 effector cells produce >10-fold lesser amounts of IFN-γ.
Fig. 2.
IFN-γ production by CD4+ cells after primary and secondary stimulation. Purified CD4+ T cells were stimulated with plate-bound anti-CD3mAb under neutral conditions (□) (no additives), Th1 conditions (○) (IL-12 and anti-IL-4 mAb), or Th2 conditions (▵) (IL-4 and anti-IFN-γ mAb). After 5 days, cells were harvested and restimulated with anti-CD3 mAb and cultured for two more days. (A) Levels of IFN-γ in culture fluids were measured by ELISA. Vertical arrows indicate the times cells were harvested for 3C assays. (B) Intracellular levels of IFN-γ were measured by flow cytometry.
Application of 3C Methodology. The 3C assay was designed to determine frequencies of interactions between different genomic regions. The basic principle of this method is that intact nuclei were isolated from live cell cultures and subjected to paraformaldehyde cross-linking to fix segments of genomic DNA that are in close physical proximity to each other. Cross-linked genomic DNA was digested with a RE and ligated at very low DNA concentrations that favor intramolecular interactions. Products of ligation were analyzed by PCR using primers in all possible combinations. The presence of a given PCR product is an indication of the relative proximity of the two restriction sites to one another captured at a given point in time.
Control template, containing all possible ligation products, was generated by digesting purified genomic DNA with EcoRI, followed by treatment with T4 DNA ligase. To determine the linear range for quantitative PCRs, cross-linked and control templates were titrated and run on an agarose gel. Optimum conditions for cross-linked templates were 25 ng of DNA per PCR reaction and 300 ng of DNA per reaction for control templates. Relative cross-linking frequencies for combinatorial interactions were calculated as the ratio of the amounts of product detected with cross-linked DNA template to the amount of product obtained with non cross-linked, control DNA templates. Representative agarose gels of PCR products under the different conditions are shown (Fig. 3).
Fig. 3.
Representative PCR products from non-cross-linked and cross-linked genomic DNA. Non-cross-linked templates were used to produce control PCR products at high DNA concentrations by using either nonhomologous or homologous primer pairs (Left). Cross-linked templates were used to produce experimental PCR products at low DNA concentrations by using nonhomologous and homologous primer pairs (Right). Chromatin material was extracted from T cells cultured for 5 days under Th1 conditions.
The efficiency of RE digestion and religation was monitored for each restriction site by PCR. All restriction sites in cross-linked chromatin were cleaved completely after 2-h incubation at 37°C with an excess of enzyme. However, EcoR1 site 4, in comparison to other sites, displayed preferential resistance to digestion and required more RE to achieve complete cleavage within the same time frame (data not shown). The location of EcoR1 site 3 corresponds to one of the HS, positioned between exons 1 and 2 in the murine Ifng gene. The location of EcoR1 site 1 at the 5′ end and EcoR1 site 4 at the 3′ end matched the sequences of the potential sites of transcriptional regulation, represented by the highest sequence conservation scores between mouse and human (Fig. 1).
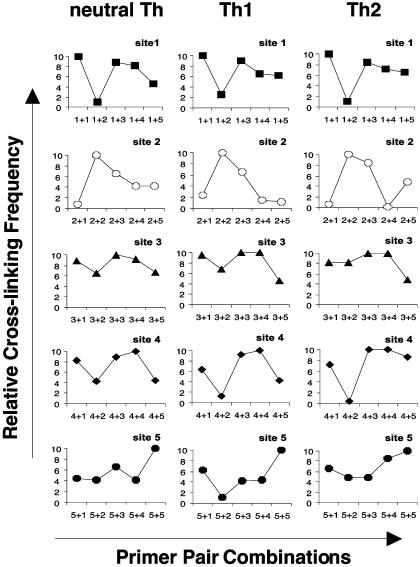
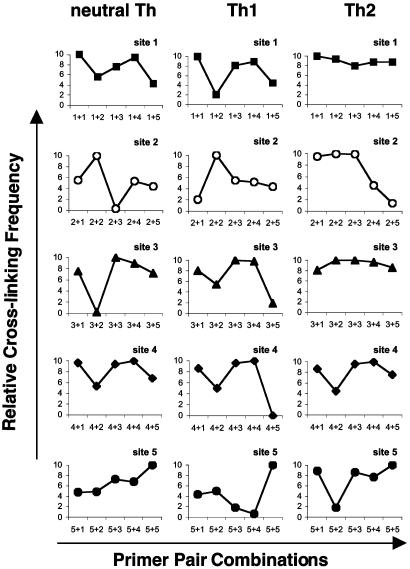
Specific Interactions Between EcoRI RE Sites in Th Cells. Figs. 4, 5, 6 provide a kinetic overview of changes in the relative cross-linking frequencies in neutral, Th1, and Th2 cells during the time course of T cell differentiation after primary and secondary stimulation of cell cultures. At day 2 after primary stimulation, cross-linking frequencies of interaction between RE sites in neutral, Th1 and Th2 cells were relatively comparable (Fig. 4). In all three subsets, the highest cross-linking frequencies were found at sites 1, 3, and 4. Because frequency of interaction between sites reflects the spatial orientation between them, we conclude that RE sites l, 3, and 4 at this time point are positioned in close proximity to each other. Sites 2 and 5 interacted very weakly with the other RE sites.
Fig. 4.
Comparison of cross-linking frequencies between individual EcoRI RE sites in CD4+ Th cell subsets on day 2. The graphs represent relative cross-linking frequency (y axis) with which EcoRI sites interacted in T cells cultured under neutral (Left), Th1 (Center), or Th2 (Right) conditions. The different primer pair combinations are indicated on the x axis. For instance, combinations of primer pairs 1 + 1, 2 + 2, 3 + 3, 4 + 4, 5 + 5, etc., correspond to homologous interactions, and combinations of primer pairs 1 + 2, 1 + 3, 1 + 4, 1 + 5, etc., correspond to nonhomologous interactions.
Fig. 5.
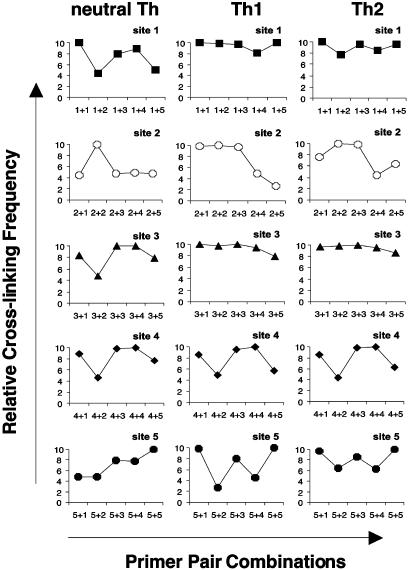
Comparison of cross-linking frequencies between individual EcoRI RE sites in Th cell subsets on day 5 after primary stimulation. The graphs represent relative cross-linking frequency between the EcoRI sites of interaction obtained with all combinations of primer pairs in neutral (Left), Th1 (Center), and Th2 (Right). Analysis was performed as described in Fig. 3.
Fig. 6.
Comparison of cross-linking frequencies between individual EcoRI RE sites in Th cell subsets 2 days after restimulation. The graphs represent relative cross-linking frequency between the EcoRI sites of interaction in neutral (Left), Th1 (Center), and Th2 (Right). Analysis was performed as described in Fig. 3.
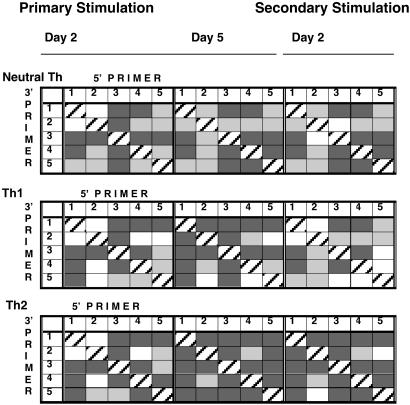
By day 5 after primary stimulation, changes in the pattern of frequencies of interaction between different subsets became more apparent (Fig. 5). As on day 2, sites 1, 3, and 4 also exhibited the strongest cross-linking frequencies in the three T cell subsets. However, in addition, sites 2 and 5 in both Th1 and Th2 cells interacted very strongly. Overall, differences in frequencies of interaction between days 2 and 5 were observed in both Th1 and Th2 cells but not in neutral T cells.
After restimulation of T cell cultures, differences in relative cross-linking frequencies in Th cells increased further (Fig. 6). Sites 1, 3, and 4 exhibited comparable strength of reactivity and therefore remained in close spatial proximity. In neutral T cells, cross-linking frequencies remained relatively unchanged over the time period. In Th2 cells, all sites showed strong interaction as on day 5. In Th1 cells, however, the picture was completely different. Sites 2 and 5 showed reduced frequencies of interaction after restimulation when compared to primary stimulation.
Interpretation of 3C Analysis. The goal of our study was to analyze cross-linking frequencies in functionally distinct Th cell subsets over the 24-kb Ifng gene region to ascertain changes in conformation during Th cell differentiation. Based on these results (Fig. 7), we aimed to describe a hypothetical spatial model of this region and illustrate its changes over time. In eukaryotes, DNA is structured by nucleosomes and condensed into a chromatin fiber. It is a complex and dynamic structure that is modified by a large number of other protein complexes. Chromatin remodeling of a gene or gene loci during transcriptional activation includes dissociation of histones that change the packing ratio of chromatin fiber, formation of HS, and binding of transcription factors. These parameters, taken together, affect the flexibility and local protein density of the fiber and determine the interaction frequencies between the sites.
Fig. 7.
Frequencies of interaction among the EcoRI RE sites in Th cell subsets. Shown is a summary of data from Figs. 3, 4, 5 to illustrate time and developmental changes in the pattern of frequency of interaction among the five individual EcoRI restriction sites. Homologous primer pairs are designated by the hatched squares. The highest frequencies of nonhomologous interactions (>6–10) are designated by the dark gray squares, intermediate frequencies (>3–6) are designated by the light gray squares, and the lowest frequencies are designated by the white squares.
The flexibility of the DNA or chromatin, taken as a polymer, can be described by applying a Gaussian freely joint chain model. In simplified form, it is presented as a chain of segments of a certain length moving unrestrictedly with respect to one another (26–28). The probability of interaction between two proteins bound to the same polymer molecule is expressed by the local concentration in moles per liter of one binding site in proximity to the other (22) and reflects spatial configuration of the chromatin. The value (X) of cross-linking frequency decreases with increasing distance between sites when chromatin adopts a linear conformation, but will increase if the sites interact by adoption of a looping conformation of the chromatin.
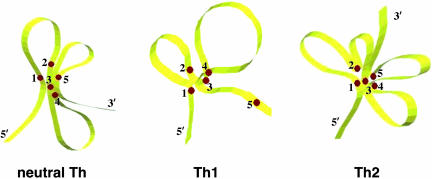
We have identified changes in chromatin conformation within the Ifng gene region that occur as naïve T cells progress from uncommitted T cells to differentiated effector Th cells. From our results, chromatin within the Ifng gene region does not display distinct conformational differences in T cells cultured for 2 days under either neutral, Th1, or Th2 conditions. All sites interact in a similar fashion, indicating that the overall structural organization is similar in all three subsets. More distinct changes in conformation in neutral and effector cells are observed after secondary stimulation. To illustrate this, we created a spatial model of chromatin organization of the Ifng gene region in effector Th subsets 2 days after restimulation (Fig. 8). It is organized in a “flower-like” configuration with some RE sites looping out and other RE sites forming a central core of the structure. The Th1 cell lineage is characterized by loose interactions between the sites indicating that the Ifng gene has the most open chromatin conformation in differentiated effector Th1 cells. In contrast, the Ifng gene displays a very compact organization with all interactive sites clustered together in Th2 cells. The conformation in neutral Th cells remains unchanged during the cell culture period. It is clear that sites 1, 3, and 4 represent the strongest points of interaction. They cluster together to form the core of the DNA structure in this gene region. Site 3, located in the first intron at +229 bp from the start site of the Ifng gene, appears to represent the central site of interactions in all analyzed Th subsets. Sites 2 and 5 change their position relative to the core DNA structure, moving toward (Th2) or away (Th1) from it. This observation suggests that sites 2 and 5 may play a silencing role and are pulled away from the core chromatin structure during Th1 differentiation. In addition, these interacting sites may serve as focal points to bring together regulatory elements that may be targets for either activator (Th1) or repressor (Th2) proteins to either stimulate or repress gene transcription. Thus, each T cell lineage displays a unique spatial configuration of chromatin. These data are consistent with results from our transgenic approach (12) that demonstrate that distal regulatory elements are required for lineage-specific regulation of Ifng gene expression in Th cells.
Fig. 8.
Spatial model of the Ifng gene in T cells differentiated under neutral, Th1, and Th2 conditions and restimulated by anti-CD3. A 3D model was constructed to show the relative positions of interacting EcoRI RE sites in the Ifng gene region in T cells that were differentiated for 5 days under neutral, Th1, and Th2 conditions and restimulated with anti-CD3 (Figs. 6 and 7).
In our experimental analysis, site 2 at -1,248 bp and site 5 at +10,264 bp from the Ifng start site change their position relative to the core chromosome conformation. To our knowledge, there are no additional data that implicate these regions in the regulation of Ifng gene transcription. Similarly, the distal sites 1 (-5,048 bp), 4 (+6,891 bp), and 5 (+10,264 bp) have not been previously demonstrated to contribute to transcriptional regulation of the Ifng gene. Site 3 is located in the first intron of the Ifng gene at +229 bp relative to the start site. The first intron contains binding sites for c-rel (28, 29) and Stat transcription factors (30) and possesses strong enhancer activity if linked to a reporter gene in either the 5′ or 3′ position (29–31).
In comparison to the well studied β-globin gene locus, which consists of multiple HS, a locus control region, and a family of genes sequentially ordered over 300 kb of DNA, the Ifng gene is not known to be a member of a cytokine gene family. Using 3C methodology, it has been shown that the 300-kb β-globin gene locus exhibits a unique 3D conformation in tissues that express the globin genes but not in cells in which these genes are transcriptionally silent. Both locus control regions and HS interacted with the two active distal β-globin genes. The intervening DNA that contains the two inactive genes was looped out.
In contrast, our work describes the interaction and spatial organization of chromatin in the region of a single gene. The unique characteristic of this system is that all CD4+ T cells begin with the potential to differentiate into effector Th1 cells that express the Ifng gene. When undergoing a differentiation program into the Th1/Th2 lineage, the Ifng gene is preferentially activated or silenced. This study shows that the spatial organization of the Ifng gene in Th cells is composed of a core conformation that is relatively similar in effector Th1 and Th2 cells. However, discrete time- and lineage-dependent changes in the chromosome conformation distinguish effector Th1 from Th2 cells. Such differences may provide the interactions between the promoter and potential activators or silencers for a rapid functional response under various differentiation conditions.
Therefore, we postulate that there is a direct structure–function relationship between the chromatin conformation and effector function of Th cells during their development into committed Th1/Th2 effector cells. This relationship is likely to influence and determine regulation of both activation and silencing of the Ifng gene.
Acknowledgments
This work was supported by National Institutes of Health Grants AI44924 and DK58765.
This paper was submitted directly (Track II) to the PNAS office.
Abbreviations: 3C, chromosome conformation capture; HS, hypersensitive sites, RE, restriction enzyme; Th, T helper.
References
- 1.Flavell, R. A. (1999) Immuol. Res. 19, 159-168. [DOI] [PubMed] [Google Scholar]
- 2.Glimcher, L. H. & Murphy, K. M. (2000) Genes Dev. 14, 1693-1711. [PubMed] [Google Scholar]
- 3.Grogan, J. L., Mohrs, M., Harmon, B., Lacy, D. A., Sedat, J. W. & Locksley, R. M. (2001) Immunity 14, 205-215. [DOI] [PubMed] [Google Scholar]
- 4.Robinson, D. S. & O'Garra, A. (2002) Immunity 16, 755-758. [DOI] [PubMed] [Google Scholar]
- 5.Berger, S. L. & Felsenfeld, G. (2001) Mol. Cell 8, 263-268. [DOI] [PubMed] [Google Scholar]
- 6.Falek, P. R., Ben-Sasson, S. Z. & Ariel, M. (2000) Cytokine 12, 198-206. [DOI] [PubMed] [Google Scholar]
- 7.Morris, A. C., Beresford, G. W., Mooney, M. R. & Boss, J. M. (2002) Mol. Cell. Biol. 22, 4781-4791. [DOI] [PMC free article] [PubMed] [Google Scholar]
- 8.Grogan, J. L. & Locksley, R. M. (2002) Curr. Opin. Immunol. 14, 366-372. [DOI] [PubMed] [Google Scholar]
- 9.Avni, O., Lee, D., Macian, F., Szabo, S. J., Glimcher, L. H. & Rao, A. (2002) Nat. Immunol. 3, 1-9. [DOI] [PubMed] [Google Scholar]
- 10.Agarwal, S. & Rao, A. (1998) Immunity 9, 765-775. [DOI] [PubMed] [Google Scholar]
- 11.Soutoglou, E. & Talianidis, I. (2002) Science 295, 1901-1904. [DOI] [PubMed] [Google Scholar]
- 12.Soutto, M., Zhou, W. & Aune, T. M. (2002) J. Immunol. 169, 6664-6667. [DOI] [PubMed] [Google Scholar]
- 13.Dillon, N., Trimborn, T., Strouboulis, J., Fraser, P. & Grosveld F. (1997) Mol. Cell 1, 131-139. [DOI] [PubMed] [Google Scholar]
- 14.Engel, J. D. & Tanimoto, K. (2000) Cell 100, 499-502. [DOI] [PubMed] [Google Scholar]
- 15.Lee, G. R., Fields, P. E. & Flavell, R. A. (2001) Immunity 14, 447-459. [DOI] [PubMed] [Google Scholar]
- 16.Parkhurst, K. M., Brenowitz, M. & Parkhurst, L. J. (1996) Biochemistry 35, 7459-7465. [DOI] [PubMed] [Google Scholar]
- 17.Coloumbe, B. & Burton, Z. F. (1999) Microbiol. Mol. Biol. Rev. 63, 457-478. [DOI] [PMC free article] [PubMed] [Google Scholar]
- 18.Lorenz, M., Hillisch, A., Payet, D., Buttinelli, M., Travers, A. & Diekmann, S. (1999) Biochemistry 38, 12150-12158. [DOI] [PubMed] [Google Scholar]
- 19.Paulson, J. R. & Laemlli, U. K. (1977) Cell 12, 817-828. [DOI] [PubMed] [Google Scholar]
- 20.Richmond, T. J. & Davey, C. A. (2003) Nature 423, 145-150. [DOI] [PubMed] [Google Scholar]
- 21.Buchler, N. E., Gerland, U. & Hwa, T. (2003) Proc. Natl. Acad. Sci. USA 100, 5136-5141. [DOI] [PMC free article] [PubMed] [Google Scholar]
- 22.Dekker, J., Rippe, K., Dekker, M. & Kleckner, N. (2002) Science 295, 1306-1311. [DOI] [PubMed] [Google Scholar]
- 23.Tolhuis, B., Robert-Jan Palstra, Splinter, E., Grosveld, F. & De Laat, W. (2002) Mol. Cell 10, 1453-1465. [DOI] [PubMed] [Google Scholar]
- 24.Rippe, K. (2001) Trends Biochem. Sci. 26, 733-740. [DOI] [PubMed] [Google Scholar]
- 25.Ostashevsky, J. Y. & Lange, C. S. (1994) J. Biomol. Struct. Dyn. 11, 813-820. [DOI] [PubMed] [Google Scholar]
- 26.Hahnfeldt, P., Hearst, J. E., Brenner, D. J., Sachs, R. K. & Hlatky, L. R. (1993) Proc. Natl. Acad. Sci. USA 90, 7854-7858. [DOI] [PMC free article] [PubMed] [Google Scholar]
- 27.Smith, S. B., Cui, Y. & Bustamante, C. (1996) Science 271, 795-799. [DOI] [PubMed] [Google Scholar]
- 28.Sica, A., Tan, T.-H., Rice, N., Kretzschmar, M., Ghosh, P. & Young, H. A. (1992) Proc. Natl. Acad. Sci. USA 89, 1740-1744. [DOI] [PMC free article] [PubMed] [Google Scholar]
- 29.Sica, A., Dorman, L., Viggiano, V., Cippitelli, M., Ghosh, P., Rice, N. & Young, H. A. (1997) J. Biol. Chem. 272, 30412-30420. [DOI] [PubMed] [Google Scholar]
- 30.Xu, X., Sun, Y.-L. & Hoey, T. (1996) Science 273, 794-798. [DOI] [PubMed] [Google Scholar]
- 31.Soutto, M., Zhang, F., Enerson, B., Tong, Y., Boothby, M. & Aune, T. M. (2002) J. Immunol. 169, 4205-4212. [DOI] [PubMed] [Google Scholar]


