Abstract
Two broad hypotheses have been advanced to explain the clinical efficacy of deep brain stimulation (DBS) in the subthalamic nucleus (STN) for treatment of Parkinson's disease. One is that stimulation inactivates STN neurons, producing a functional lesion. The other is that electrical stimulation activates the STN output, thus “jamming” pathological activity in basal ganglia-corticothalamic circuits. Evidence consistent with both concepts has been adduced from modeling and animal studies, as well as from recordings in patients. However, the stimulation parameters used in many recording studies have not been well matched to those used clinically. In this study, we recorded STN activity in patients with Parkinson's disease during stimulation delivered through a clinical DBS electrode using standard therapeutic stimulus parameters. A microelectrode was used to record the firing of a single STN neuron during DBS (3–5 V, 80–200 Hz, 90- to 200-μs pulses; 33 neurons/11 patients). Firing rate was unchanged during the stimulus trains, and the recorded neurons did not show prolonged (s) changes in firing rate on termination of the stimulation. However, a brief (∼1 ms), short-latency (6 ms) postpulse inhibition was seen in 10 of 14 neurons analyzed. A subset of neurons displayed altered firing patterns, with a predominant shift toward random firing. These data do not support the idea that DBS inactivates the STN and are instead more consistent with the hypothesis that this stimulation provides a null signal to basal ganglia-corticothalamic circuitry that has been altered as part of Parkinson's disease.
INTRODUCTION
The clinical efficacy of deep brain stimulation (DBS) in the subthalamic nucleus (STN) for treating many of the symptoms of Parkinson's disease is now well documented (Deep Brain Stimulation for Parkinson's Disease Study Group 2001; Weaver et al. 2009). What remains unclear is how local STN neurons respond to DBS and how this effect is translated into a clinical benefit (Kringelbach et al. 2007; Montgomery and Gale 2008).
STN stimulation and the resultant amelioration of Parkinson's disease symptoms have classically been explained by postulating that the stimulation produces a functional lesion by inhibiting surrounding neurons. This could be either through direct inhibition or by activating inhibitory presynaptic afferent terminals (Benabid et al. 2009; Filali et al. 2004). The functional lesion theory grew from the idea that overactivity in the STN and its target, the globus pallidus pars interna, underlies the motor symptoms of Parkinson's disease (Albin et al. 1989; Delong 1990), and was supported by the clinical observation that lesioning or otherwise inactivating the STN is effective in treating Parkinson's disease symptoms (Follett 2000; Levy et al. 2001; Walter and Vitek 2004). Electrical stimulation was thus inferred to mimic a lesion by suppressing output from the STN.
The functional lesion hypothesis received support from studies in humans and in a primate model of Parkinson's disease in which high-frequency stimulation in the STN was seen to inhibit activity in surrounding cell bodies for periods of up to several seconds (Filali et al. 2004; Meissner et al. 2005; Welter et al. 2004). However, an important limitation of these studies is that the stimulating current was delivered not through the standard multicontact clinical DBS electrode, but using a microelectrode or the guide tube as the active electrode. The current density and distribution with either of the latter methods would be quite different from that resulting from stimulation through the low-impedance DBS electrode (Butson and McIntyre 2006). The goal of this study was to determine how STN neurons respond to stimulation delivered using the same electrode used clinically to deliver DBS. To this end, we monitored the activity of STN neurons using a microelectrode adjacent to the DBS electrode during therapeutic stimulation in patients with idiopathic Parkinson's disease.
We show here that subsets of STN neurons recorded during implantation of the DBS electrode display a brief (1–2 ms), pulse-related inhibition or a change in firing pattern. However, neurons in this nucleus are not silenced by the DBS. These findings do not support the idea that DBS gives rise to a functional lesion of the STN. They are instead more consistent with an alternative hypothesis, which is that DBS functions through white matter activation to effect changes in neuronal activity throughout the basal ganglia-thalamocortical network (Gradinaru et al. 2009; Grill et al. 2004; Hammond et al. 2008; Li et al. 2007; Montgomery and Gale 2008).
METHODS
Patients
This research study was approved by the Oregon Health and Science University Institutational Review Board (2947). Patients with a planned DBS surgery to treat advanced, medically intractable Parkinson's disease were informed of the study protocol and consent obtained. Patients were off all dopaminergic medications for ≥12 h before surgery. A total of 33 neurons were studied in 11 patients: 1–4 neurons in each individual.
Operative procedure
STN targets were selected using the FrameLink Stereotactic Linking System version 4.1.9 (Medtronic Navigation, Louisville, CO) from T1 and T2 (3-T scan) fused STN images (located 4 mm posterior to the intercommisural point, 12 mm lateral from the midline, and 4 mm ventral to the intercommisural line). The Leksell stereotactic frame was used to guide the electrodes to the surgical target and bilateral burr holes were placed anterior to the coronal suture under local anesthesia. Patients were awake during surgery without sedatives or narcotics.
A pair of microelectrodes (400–800 kOhm; FHC, Bowdoin, ME) were stereotactically advanced (Alpha Omega Alpha computer-controlled microdrive, Alpha Omega, Alpharetta, GA) through the thalamus and zona incerta to the dorsal border of the STN. One microelectrode was directed toward the surgical target, the other was centered 2.0 mm anteriorly at the same depth. The dorsal border of the STN was neurophysiologically defined by a clear transition from white matter into a field of multicellular neuronal activity with increased background noise.
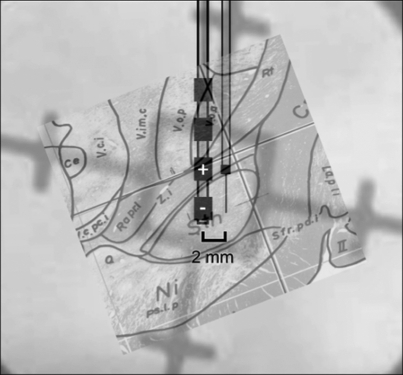
On encountering the dorsal surface of the STN with both microelectrodes, the central (posterior) microelectrode was removed and the DBS electrode (Model 3387, Medtronic) was inserted to the same depth as the microelectrode, centered on contact 0 (the most distal contact). Separation between the microelectrode and the DBS electrode surface was estimated to be ∼1.365 mm (based on the DBS electrode radius of 0.635 mm). Electrode placement was visualized on lateral X-rays (Fig. 1). The DBS and microelectrode pair were advanced in micrometer increments until an STN neuron was identified.
Fig. 1.
The physical relationship between the microelectrode and deep brain stimulation (DBS) electrode, enhanced from an intraoperative X-ray and overdrawn on the estimated outline of the subthalamic nucleus (STN). The contact surface of the DBS electrode was positioned ∼1.3 mm posterior to the neuron being recorded with the microelectrode.
Microelectrode recording and DBS
Once a neuron was isolated, baseline activity was recorded for between 30 and 120 s. Stimulation trials were conducted using the hand-held DBS stimulator (Medtronic 3625 Test Stimulator) through a temporary lead connected to the DBS electrode. Multiple stimulation trials were conducted at therapeutic stimulus voltages (3–5 V), pulse widths (90–200 μs), and frequencies (80–200 Hz). Stimulation trains lasted ∼4–10 s and were separated by 30–60 s. Bipolar stimulation was used in therapeutic stimulation trials, with contact 0 the anode and contact 1 the cathode. In control trials, contact 3 was the anode and contact 2 was the cathode. This latter contact pair was used as a control because it was most distant from the microelectrode and because the geometry of the DBS electrode and its trajectory dictated that this pair would be outside of the STN. The impedance of the DBS electrodes was ∼1 kOhm, based on measurements in rat brain. Estimated stimulation current thus ranged from 3 to 5 mA.
Analysis
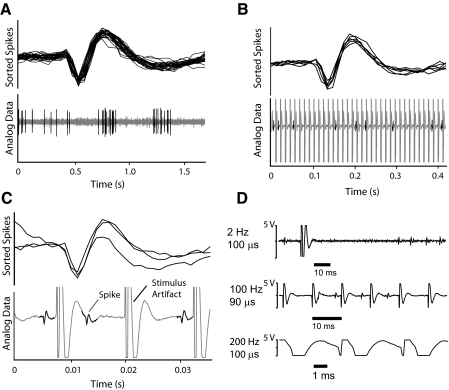
The microelectrode recordings were digitized (15 kHz) and stored (Alpha Omega). Data files were imported into Spike 2 for analysis (CED, Cambridge, UK). Waveforms were sorted to extract activity of a single neuron using automated template-matching followed by cluster analysis. The spike sort during each DBS trial was verified on a spike-by-spike basis to ensure accurate detection of the action potential of interest. Of 58 neurons recorded, 33 were of sufficiently high quality to insure a single cell was present throughout the recording (range, 2- to 5-min duration). Cells that drifted in and out of recordings as a result of brain shift or activity of the awake patient were excluded. Examples of recorded waveforms as shown in Fig. 2.
Fig. 2.
Detectability of action potential waveforms in STN. A: example of spike-sorting based on waveform characteristics. B: example of spikes extracted from the analog signal during a DBS train. C: expanded time base shows spikes between stimulus pulses in the train (same neuron as in B). D: the stimulus artifact changed shape and duration as a function of the stimulus frequency and pulse width. DBS with pulse widths of 100 μs and ∼100 Hz allowed for visible spikes to be detected and sorted during about one half of the time between DBS pulses. Note the complete saturation of the amplifier for several milliseconds during and after each DBS pulse.
With this recording system, the DBS stimulus artifact precluded spike identification for a period of several milliseconds during and immediately after each current pulse. Because the amplifier was saturated for at least a portion of this time, we did not use an artifact subtraction method (Hashimoto et al. 2002; Montgomery et al. 2005) and instead opted to work around the stimulus artifact without altering the analog signal. The duration of signal saturation was determined for each recording. With a sufficiently short DBS pulse width (90–100 μs) and relatively low frequency (no more than 100 Hz), spikes were visible for over one half of the interval between the DBS stimulus pulses (Fig. 2, B–D). The ability to detect spikes between DBS stimulus pulses within a train allowed us to derive firing rate during the pulse train.
Four different analyses were performed. Firing rate in the 10 s before onset of each stimulus train was compared with that in the 10 s after the stimulus train. Spike histograms aligned with the onset and the offset of the DBS pulse train were generated using the first and last stimulus artifacts in the train as alignment points. Cell activity was averaged across all trials and all cells to generate a total cumulative pre- and posttrain histogram. The averaged firing rates in the 10 s before and after DBS trains were compared with identify any residual effect of DBS after the stimulation was terminated.
Second, firing rate during the stimulus train was determined in a subset of trials in which pulse width was 90–100 μs. Beginning and end of the stimulus artifact were determined empirically for each recording by an investigator blinded to cell firing rate, and firing rate in the intervals between pulses within the train were determined. Because stimulus trains varied in length (4–10 s), the central 3 s of each train were used for analysis. Initial exploration of the neuronal firing data showed no effect of pulse train duration on firing rate or pattern, and data from trials with different stimulus durations were combined in this analysis.
For these trains, a peristimulus time histogram (0.5-ms bin width) was also generated for each cell around individual pulses in the train. Bins with >2 SD change in firing rate relative to a prestimulus baseline were considered significantly different from basal firing.
Finally, the firing pattern of each neuron was classified according to the methods of Kaneoke and Vitek (1996). A density histogram (MATLAB, MathWorks, Natick, MA) was calculated based on the 30 s before and immediately after the first stimulus train. The resulting density histogram distribution was compared with the Poisson theoretical distribution for a randomly firing cell using a χ2 test for goodness-of-fit, with P < 0.05 considered significant. If firing was significantly different from that expected for random activity, the skew was evaluated and the cell classified as bursting (right skew) or tonic (left skew).
RESULTS
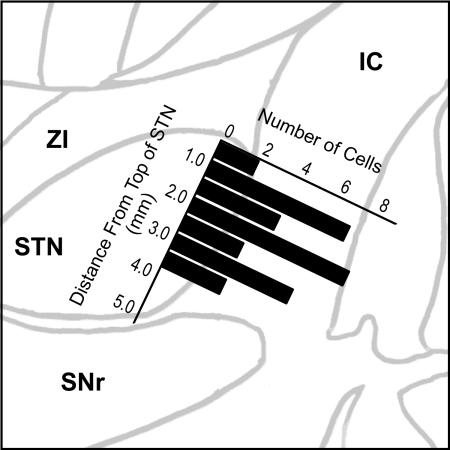
Based on microelectrode recording depth from the dorsal surface of the nucleus, cells were distributed throughout the dorsal-ventral extent of the STN (Fig. 3). In general, cells were located in the anterior portion of the STN because the recording microelectrode was 2 mm anterior to the standard STN target.
Fig. 3.
The depth of all cells studied based on microdrive measurements was referenced to the dorsal surface of the STN determined from the microelectrode recordings. The recorded neurons were distributed throughout the dorso-ventral extent of the nucleus. Because of the physical arrangement of the microelectrode anterior to the DBS electrode, the cells were recorded from the anterior portion of the nucleus. IC, internal capsule; SNr, substantia nigra pars reticularis; STN, subthalamic nucleus; ZI, zona incerta.
STN neurons did not show prolonged changes in firing rate after DBS stimulus trains
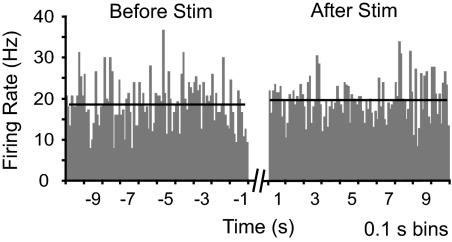
We determined firing rate in the 10 s immediately preceding and immediately after the first stimulus train for all neurons. For this sample, mean firing rate in the 10-s period immediately preceding stimulation trains was 19.1 ± 2.7 (SD) spikes/s. Comparison with an equivalent period immediately after the end of the stimulus trains showed no change in firing (19.0 ± 1.9 spikes/s; Fig. 4; t-test for correlated means, P > 0.05). Further analysis at a higher temporal resolution showed that, even in the first 100 ms after stimulus train offset, firing rate was not different from that before the stimulus (22.0 ± 6.7 spikes/s). Stimulation through the DBS electrode thus did not have a prolonged excitatory or inhibitory effect on the firing of surrounding STN neurons.
Fig. 4.
Mean firing rate before and after DBS, averaged across all neurons studied for all trials. Firing rate over the 10-s period after stimulus offset was not significantly different from that before stimulus delivery.
Activity during DBS stimulus trains
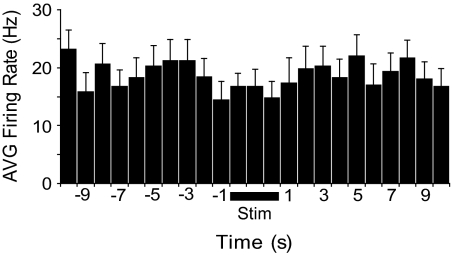
Using short pulse widths (100 μs, 100 Hz) in a subpopulation of neurons (n = 14) allowed us to detect neuronal activity between DBS stimulus pulses. (A longer pulse width or higher frequency prevented detection of spikes during the train in other neurons; see Fig. 2D for representative trace with 200 Hz stimulation.) Although the stimulus artifact masked potential neuronal activity for ≤4 ms after each pulse, spikes were clearly detectable between 5 and 10 ms postpulse in all cases. The firing rate during the DBS train was estimated by taking this duty cycle into account. With this approach, we saw no change in overall firing rate during the stimulus train (Fig. 5) compared with that before stimulus onset.
Fig. 5.
Firing rate during DBS (Stim, bar below trace) was not significantly different from that in the 10 s preceding or after stimulation. Firing during the central 3 s of each stimulus train was used for analysis. Also, because the stimulus artifact precluded detection of spikes for a period during each stimulus duty cycle, firing rate during stimulation was determined using the proportion of time that spikes were detectable. Mean ± SD, 14 neurons, 1-s bins.
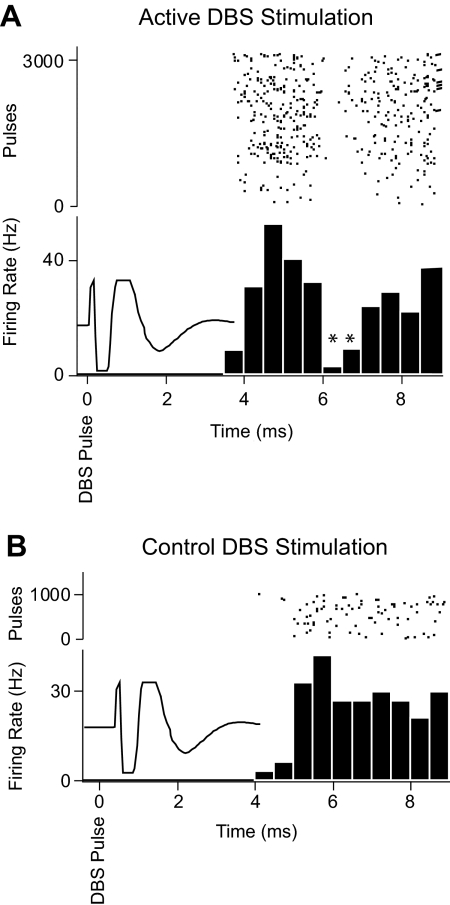
For these neurons, peristimulus time histograms were also generated around individual pulses comprising the stimulus trains. In 10 of 14 cells, a suppression of activity (>2 SD) lasting ∼1 ms with a latency of 6.4 ms from the pulse could be detected (range 5–8 ms; Fig. 6A). This time-locked postpulse inhibition was not observed when stimulation was delivered using the most distant contacts (3 anode, 2 cathode, 9 mm from the recording microelectrode; Fig. 6B).
Fig. 6.
Example of postpulse inhibition of an STN neuron. A: stimulation delivered using contacts 1 and 0 (in STN) resulted in brief (1–2 ms), short-latency (6 ms) inhibition of activity after each pulse in the train. B: control stimulation using the most proximal contacts (3 cathode, 2 anode) did not evoke a postpulse inhibition in this neuron. Stimulus: 100-μs pulses at 100 Hz, 3–5 V. For both A and B, spike times in a 10-ms period aligned with the beginning of the stimulus artifact (superimposed to show time during which spikes were not detectable) were used to construct a pulse-aligned histogram. The spike count in each bin was normalized by the total number of pulses and bin size to give firing rate. Raster record above each histogram shows spike times associated with individual pulses.
STN neurons shifted to random firing after DBS
For 31 neurons, activity was classified as bursting, random, or tonic (Kaneoke and Vitek 1996) based on a 30-s baseline recording before the DBS. Five of 14 neurons classed as bursting when first encountered changed to a random pattern of activity after stimulation through the DBS electrode. Four of six tonically firing neurons similarly changed to a random pattern. Those neurons exhibiting a random pattern before stimulation (n = 11) generally remained random, although one neuron shifted to a tonic pattern. No neuron changed from a random to bursting pattern after the DBS.
DISCUSSION
The principle finding of this study is that electrical stimulation of the STN in Parkinson's patients using therapeutic parameters and a DBS electrode does not result in a profound or long-lasting inhibition of surrounding neurons. Although a subset of neurons exhibited a brief, pulse-locked inhibition, this change was not sufficient to alter overall firing rate significantly, and firing rate immediately after the end of a stimulus train was comparable to that exhibited before stimulation. However, approximately one half of the neurons originally classified as having bursting or tonic firing shifted to a random pattern after delivery of the stimulus train.
Our observation that the overall firing rate of STN neurons was unchanged after application of stimulation trains lasting up to 10 s through the DBS electrode was surprising in light of several previous studies of STN activity. Recording STN discharge during surgery in humans, both Welter et al. (2004) and Filali et al. (2004) reported suppression of activity for tens of milliseconds after the stimulus train in a significant number of neurons. In nonhuman primates, Meissner et al. (2005) saw a substantial decrease in overall firing rate that was accounted for by a pause in firing lasting several milliseconds after each stimulus pulse. In rats, Tai et al. (2003) observed inhibition of adjacent neurons during the stimulus train. Local high-frequency stimulation is also reported to suppress action potentials of tonically firing neurons in STN recorded in vitro (Garcia et al. 2005; Magarinos-Ascone et al. 2002).
The durations of the stimulus trains used by Welter et al. (2004) and Filali et al. (2004) were comparable to those delivered here (20 s and 500 ms, respectively, vs. ≤10 s in this study). However, there is a critical difference between our study and that earlier work. We used the DBS electrode itself to stimulate during the recording session, whereas other investigators have used a microelectrode, single-contact macroelectrode or guide tube to deliver current. The electrical fields generated and neuronal responses evoked by these different electrodes would presumably be quite different. The electrical field generated by the clinical DBS electrode has been extensively modeled (Butson and McIntyre 2006; Miocinovic et al. 2006). As a rough approximation for comparison with guide tube or microelectrode stimulation, one can consider that the contact area of a standard DBS electrode is near 6 mm2 (diameter, 1.27 mm; length, 1.5 mm). With typical impedances around 1 kOhm and stimulation voltages around 3–4 V, this contact area leads to static (DC) current densities of 0.5 mA/mm2. Most guide tubes used for macrostimulation have a surface area in the range of 0.5–3 mm2 (diameter, 0.1–0.7 mm; length, 0.5–1.5 mm). Stimulation is often performed with constant current sources ranging from 1 to 5 mA. These parameters would result in significantly higher current densities, ranging from 3 to 10 mA/mm2. Estimation of the current density surrounding a microelectrode tip is more challenging, but currents in the range of 50–500 μA are used, which places the current density ≥1–2 orders of magnitude higher than that obtained using the larger, lower-impedance DBS electrode. Given that the particular neural element(s) activated is a function of current density (Ranck 1975; Rattay and Aberham 1993), extrapolation from the effects of a microelectrode to a DBS electrode stimulation may be erroneous. The strength of this study is that cell activity was monitored during stimulation using the clinical DBS electrode and typical therapeutic parameters.
Another factor that may be important is correction for stimulus artifact, at least when considering firing during the stimulus train. The overall duration of the artifact associated with each pulse is related to the amplifier filter characteristics and input impedance as well as the stimulus pulse width and current density. The stimulus artifact in this study, as in earlier studies, was quite prominent, and amplifiers were typically saturated for 1–2 ms with each pulse in the train. This precludes knowledge of potential spikes during this time, even with sophisticated stimulus artifact subtraction algorithms (Hashimoto et al. 2002; Montgomery et al. 2005). We cannot therefore rule out the possibility that pulse-locked spikes were obscured or that the neuron under study was silenced for the duration of the artifact. In the latter case, a decrease in firing during the stimulus train of ≤40% could have gone undetected. However, there was no suppression of activity immediately after termination of the stimulus train. Moreover, our observation of continued activity during the DBS stimulus train is consistent with local field potential recordings where beta-band and higher-frequency oscillations continue to be elevated during and immediately after DBS (Bronte-Stewart et al. 2009; Priori et al. 2006; Rossi et al. 2008).
The basis for the brief (∼1 ms), short-latency (∼6 ms), pulse-locked pause in firing seen in a subset of neurons could not be determined under our experimental conditions. One possibility is that anterograde or retrograde activation of STN efferents or fibers of passage sets up a pulse-locked reverberation through the basal-ganglia-thalamocortical network. Reports of time-locked, short-latency responses in the globus pallidus (Hashimoto et al. 2003; Kita et al. 2005) and the substantia nigra (Galati et al. 2006) after STN stimulation would support such a mechanism.
We also observed a change in the firing of some bursting and tonic neurons to a random pattern. This observation is in contrast with a previous study in which almost a third of the neurons sampled in the STN in Parkinson's patients altered their firing from irregular to bursting after stimulation through a microelectrode or guide tube (Welter et al. 2004). Although we did not specifically analyze oscillatory activity in our sample, our findings are more consistent with reports of reduced abnormal oscillatory activity in the STN and globus pallidus pars interna in parkinsonian nonhuman primates after high-frequency stimulation (McCairn and Turner 2009; Meissner et al. 2005). Such oscillations have been linked to the pathophysiology of Parkinson's disease (Kühn et al. 2009).
Implications for mechanism through which DBS ameliorates the motor symptoms of Parkinson's disease
Overactivity in STN and its target, the globus pallidus pars interna, has been theorized to underlie the motor symptoms in Parkinson's disease (Albin et al. 1989; Delong 1990). Together with the clinical observation that lesioning or inactivation of the STN is effective in treating Parkinson's disease symptoms (Follett 2000; Levy et al. 2001; Walter and Vitek 2004), this idea was the basis for the classic hypothesis that DBS mimics an ablative lesion by suppressing output from the STN. Our observation that the spontaneous firing rate of STN neurons is unchanged during and immediately after the DBS stimulus train fails to support this view.
An alternative explanation for the efficacy of DBS in the STN is that activation of STN efferents and/or surrounding white matter results in a regular, high-frequency neuronal signal that normalizes pathological activity or prevents transmission of such activity through the basal ganglia-thalamocortical network (Grill et al. 2004; Hammond et al. 2008; Montgomery and Gale 2008). Consistent with this view are modeling studies suggesting that therapeutic DBS depolarizes myelinated fibers, without evoking or inhibiting discharges in local cell bodies (McIntyre et al. 2004a,b; Miocinovic et al. 2006). Experimental support for the idea that DBS modifies the STN outflow comes from the observation that therapeutic stimulation in the STN in humans and animal models alters activity in target structures including the substantia nigra pars reticularis, pallidum, and motor thalamus (Galati et al. 2006; Hahn et al. 2008; Hashimoto et al. 2003; Kita et al. 2005; Li et al. 2007; Maltete et al. 2007; Maurice et al. 2003; Xu et al. 2008). We have no direct evidence from our recordings that axons of STN neurons or adjacent white matter were activated by the DBS in our patients. Nevertheless, the observation that at least some neurons that originally exhibited bursting or tonic firing shifted to a more random pattern after stimulation would corroborate the concept that DBS suppresses abnormal oscillations in basal ganglia networks controlling motor output (Meissner et al. 2005). Furthermore, such changes in firing pattern would be consistent with a shift in the dynamics of the basal ganglia-thalamocortical network as an integrated system.
In conclusion, the data we obtained in patients during implantation of a DBS electrode do not provide support for the classic view that DBS in the STN produces its therapeutic effect by immediate inhibition of surrounding neurons. Our findings are instead more consistent with the alternative proposal that DBS synchronously activates surrounding myelinated fibers, thus normalizing or “jamming” the pathological activity in the basal ganglia-thalamocortical network.
REFERENCES
- Albin RL, Young A, Penny JB. The functional anatomy of basal ganglia disorders. Trends Neurosci 12: 366–375, 1989 [DOI] [PubMed] [Google Scholar]
- Benabid AL, Chabardes S, Mitrofanis J, Pollak P. Deep brain stimulation of the subthalamic nucleus for the treatment of Parkinson's disease. Lancet Neurol 8: 67–81, 2009 [DOI] [PubMed] [Google Scholar]
- Bronte-Stewart H, Barberini C, Koop MM, Hill BC, Henderson JM, Wingeier B. The STN beta-band profile in Parkinson's disease is stationary and shows prolonged attenuation after deep brain stimulation. Exp Neurol 215: 20–28, 2009 [DOI] [PubMed] [Google Scholar]
- Butson CR, McIntyre CC. Role of electrode design on the volume of tissue activated during deep brain stimulation. J Neural Eng 3: 1–8, 2006 [DOI] [PMC free article] [PubMed] [Google Scholar]
- Deep Brain Stimulation for Parkinson's Disease Study Group Deep-brain stimulation of the subthalamic nucleus or the pars interna of the globus pallidus in Parkinson's disease. N Engl J Med 345: 956–963, 2001 [DOI] [PubMed] [Google Scholar]
- Delong MR. Primate models of movement disorders of basal ganglia origin. Trends Neurosci 13: 281–285, 1990 [DOI] [PubMed] [Google Scholar]
- Filali M, Hutchison WD, Palter VN, Lozano AM, Dostrovsky JO. Stimulation-induced inhibition of neuronal firing in human subthalamic nucleus. Exp Brain Res 156: 274–281, 2004 [DOI] [PubMed] [Google Scholar]
- Follett KA. The surgical treatment of Parkinson's disease. Annu Rev Med 51: 135–147, 2000 [DOI] [PubMed] [Google Scholar]
- Galati S, Mazzone P, Fedele E, Pisani A, Peppe A, Pierantozzi M, Brusa L, Tropepi D, Moschella V, Raiteri M, Stanzione P, Bernardi G, Stefani A. Biochemical and electrophysiological changes of substantia nigra pars reticulata driven by subthalamic stimulation in patients with Parkinson's disease. Eur J Neurosci 23: 2923–2928, 2006 [DOI] [PubMed] [Google Scholar]
- Garcia L, D'Alessandro G, Bioulac B, Hammond C. High-frequency stimulation in Parkinson's disease: more or less? Trends Neurosci 28: 209–216, 2005 [DOI] [PubMed] [Google Scholar]
- Gradinaru V, Mogri M, Thompson KR, Henderson JM, Deisseroth K. Optical deconstruction of Parkinsonian neural circuitry. Science 324: 354–359, 2009 [DOI] [PMC free article] [PubMed] [Google Scholar]
- Grill WM, Snyder AN, Miocinovic S. Deep brain stimulation creates an informational lesion of the stimulated nucleus. Neuroreport 15: 1137–1140, 2004 [DOI] [PubMed] [Google Scholar]
- Hahn PJ, Russo GS, Hashimoto T, Miocinovic S, Xu W, McIntyre CC, Vitek JL. Pallidal burst activity during therapeutic deep brain stimulation. Exp Neurol 211: 243–251, 2008 [DOI] [PMC free article] [PubMed] [Google Scholar]
- Hammond C, Ammari R, Bioulac B, Garcia L. Latest view on the mechanism of action of deep brain stimulation. Mov Disord 23: 2111–2121, 2008 [DOI] [PubMed] [Google Scholar]
- Hashimoto T, Elder CM, Okun MS, Patrick SK, Vitek JL. Stimulation of the subthalamic nucleus changes the firing pattern of pallidal neurons. J Neurosci 23: 1916–1923, 2003 [DOI] [PMC free article] [PubMed] [Google Scholar]
- Hashimoto T, Elder CM, Vitek JL. A template subtraction method for stimulus artifact removal in high-frequency deep brain stimulation. J Neurosci Methods 113: 181–186, 2002 [DOI] [PubMed] [Google Scholar]
- Kaneoke Y, Vitek JL. Burst and oscillation as disparate neuronal properties. J Neurosci Methods 68: 211–223, 1996 [DOI] [PubMed] [Google Scholar]
- Kita H, Tachibana Y, Nambu A, Chiken S. Balance of monosynaptic excitatory and disynaptic inhibitory responses of the globus pallidus induced after stimulation of the subthalamic nucleus in the monkey. J Neurosci 25: 8611–8619, 2005 [DOI] [PMC free article] [PubMed] [Google Scholar]
- Kringelbach ML, Jenkinson N, Owen SL, Aziz TZ. Translational principles of deep brain stimulation. Nat Rev Neurosci 8: 623–635, 2007 [DOI] [PubMed] [Google Scholar]
- Kühn AA, Tsui A, Aziz T, Ray N, Brücke C, Kupsch A, Schneider G-H, Brown P. Pathological synchronisation in the subthalamic nucleus of patients with Parkinson's disease relates to both bradykinesia and rigidity. Exp Neurol 215: 380–387, 2009 [DOI] [PubMed] [Google Scholar]
- Levy R, Lang AE, Dostrovsky JO, Pahapill P, Romas J, Saint-Cyr J, Hutchison WD, Lozano AM. Lidocaine and muscimol microinjections in subthalamic nucleus reverse Parkinsonian symptoms. Brain 124: 2105–2118, 2001 [DOI] [PubMed] [Google Scholar]
- Li S, Arbuthnott GW, Jutras MJ, Goldberg JA, Jaeger D. Resonant antidromic cortical circuit activation as a consequence of high-frequency subthalamic deep-brain stimulation. J Neurophysiol 98: 3525–3537, 2007 [DOI] [PubMed] [Google Scholar]
- Magarinos-Ascone C, Pazo JH, Macadar O, Buno W. High-frequency stimulation of the subthalamic nucleus silences subthalamic neurons: a possible cellular mechanism in Parkinson's disease. Neuroscience 115: 1109–1117, 2002 [DOI] [PubMed] [Google Scholar]
- Maltete D, Jodoin N, Karachi C, Houeto JL, Navarro S, Cornu P, Agid Y, Welter ML. Subthalamic stimulation and neuronal activity in the substantia nigra in Parkinson's disease. J Neurophysiol 97: 4017–4022, 2007 [DOI] [PubMed] [Google Scholar]
- Maurice N, Thierry AM, Glowinski J, Deniau JM. Spontaneous and evoked activity of substantia nigra pars reticulata neurons during high-frequency stimulation of the subthalamic nucleus. J Neurosci 23: 9929–9936, 2003 [DOI] [PMC free article] [PubMed] [Google Scholar]
- McCairn KW, Turner RS. Deep brain stimulation of the globus pallidus internus in the Parkinsonian primate: local entrainment and suppression of low-frequency oscillations. J Neurophysiol 101: 1941–1960, 2009 [DOI] [PMC free article] [PubMed] [Google Scholar]
- McIntyre CC, Grill WM, Sherman DL, Thakor NV. Cellular effects of deep brain stimulation: model-based analysis of activation and inhibition. J Neurophysiol 91: 1457–1469, 2004a [DOI] [PubMed] [Google Scholar]
- McIntyre CC, Mori S, Sherman DL, Thakor NV, Vitek JL. Electric field and stimulating influence generated by deep brain stimulation of the subthalamic nucleus. Clin Neurophysiol 115: 589–595, 2004b [DOI] [PubMed] [Google Scholar]
- Meissner W, Leblois A, Hansel D, Bioulac B, Gross CE, Benazzouz A, Boraud T. Subthalamic high frequency stimulation resets subthalamic firing and reduces abnormal oscillations. Brain 128: 2372–2382, 2005 [DOI] [PubMed] [Google Scholar]
- Miocinovic S, Parent M, Butson CR, Hahn PJ, Russo GS, Vitek JL, McIntyre CC. Computational analysis of subthalamic nucleus and lenticular fasciculus activation during therapeutic deep brain stimulation. J Neurophysiol 96: 1569–1580, 2006 [DOI] [PubMed] [Google Scholar]
- Montgomery EB, Gale JT. Mechanisms of action of deep brain stimulation (DBS). Neurosci Biobehav Rev 32: 388–407, 2008 [DOI] [PubMed] [Google Scholar]
- Montgomery EB Jr, Gale JT, Huang H. Methods for isolating extracellular action potentials and removing stimulus artifacts from microelectrode recordings of neurons requiring minimal operator intervention. J Neurosci Methods 144: 107–125, 2005 [DOI] [PubMed] [Google Scholar]
- Priori A, Ardolino G, Marceglia S, Mrakic-Sposta S, Locatelli M, Tamma F, Rossi L, Foffani G. Low-frequency subthalamic oscillations increase after deep brain stimulation in Parkinson's disease. Brain Res Bull 71: 149–154, 2006 [DOI] [PubMed] [Google Scholar]
- Ranck JB., Jr Which elements are excited in electrical stimulation of mammalian central nervous system: a review. Brain Res 98: 417–440, 1975 [DOI] [PubMed] [Google Scholar]
- Rattay F, Aberham M. Modeling axon membranes for functional electrical stimulation. IEEE Trans Biomed Eng 40: 1201–1209, 1993 [DOI] [PubMed] [Google Scholar]
- Rossi L, Marceglia S, Foffani G, Cogiamanian F, Tamma F, Rampini P, Barbieri S, Bracchi F, Priori A. Subthalamic local field potential oscillations during ongoing deep brain stimulation in Parkinson's disease. Brain Res Bull 76: 512–521, 2008 [DOI] [PubMed] [Google Scholar]
- Tai CH, Boraud T, Bezard E, Bioulac B, Gross C, Benazzouz A. Electrophysiological and metabolic evidence that high-frequency stimulation of the subthalamic nucleus bridles neuronal activity in the subthalamic nucleus and the substantia nigra reticulata. FASEB J 17: 1820–1830, 2003 [DOI] [PubMed] [Google Scholar]
- Walter BL, Vitek JL. Surgical treatment for Parkinson's disease. Lancet Neurol 3: 719–728, 2004 [DOI] [PubMed] [Google Scholar]
- Weaver FM, Follett K, Stern M, Hur K, Harris C, Marks WJ, Jr, Rothlind J, Sagher O, Reda D, Moy CS, Pahwa R, Burchiel K, Hogarth P, Lai EC, Duda JE, Holloway K, Samii A, Horn S, Bronstein J, Stoner G, Heemskerk J, Huang GD. Bilateral deep brain stimulation vs best medical therapy for patients with advanced Parkinson disease: a randomized controlled trial. J Am Med Assoc 301: 63–73, 2009 [DOI] [PMC free article] [PubMed] [Google Scholar]
- Welter ML, Houeto JL, Bonnet AM, Bejjani PB, Mesnage V, Dormont D, Navarro S, Cornu P, Agid Y, Pidoux B. Effects of high-frequency stimulation on subthalamic neuronal activity in parkinsonian patients. Arch Neurol 61: 89–96, 2004 [DOI] [PubMed] [Google Scholar]
- Xu W, Russo GS, Hashimoto T, Zhang J, Vitek JL. Subthalamic nucleus stimulation modulates thalamic neuronal activity. J Neurosci 28: 11916–11924, 2008 [DOI] [PMC free article] [PubMed] [Google Scholar]


