Abstract
We show that the transfer of the adult ventricular myocyte (AVM) transcriptome into either a fibroblast or an astrocyte converts the host cell into a cardiomyocyte. Transcriptome-effected cardiomyocytes (tCardiomyocytes) display morphologies, immunocytochemical properties, and expression profiles of postnatal cardiomyocytes. Cell morphology analysis shows that tCardiomyoctes are elongated and have a similar length-to-width ratio as AVMs. These global phenotypic changes occur in a time-dependent manner and confer electroexcitability to the tCardiomyocytes. tCardiomyocyte generation does not require continuous overexpression of specific transcription factors; for example, the expression level of transcription factor Mef2c is higher in tCardiomyocytes than in fibroblasts, but similar in tCardiomyocytes and AVMs. These data highlight the dominant role of the gene expression profile in developing and maintaining cellular phenotype. The transcriptome-induced phenotype remodeling–generated tCardiomyocyte has significant implications for understanding and modulating cardiac disease development.
Keywords: relative abundance, lipid-mediated, TIPeR, microarray, patch clamp
Cardiomyocytes are among the most sought-after cells in regenerative medicine because they may help to repair an injured heart by replacing lost tissue (1, 2). Functional cardiomyocyte-like cells have been induced from embryonic stem cells (ESCs), induced from pluripotent stem cells (iPSCs), and generated from direct conversion of fibroblasts using defined transcription factor transduction (3–7). ESC-derived and iPSC-derived cardiomyocytes exhibit many characteristics of cardiomyocytes, including electric activity, contractile movement, and up-regulation of cardiac genes; however, both stem cell–derived cardiomyocytes are mixed populations of atrial, ventricular, and other cells, limiting their use in research and clinical application. In addition to heterogeneity of the cells, stem cell–derived cardiomyocytes remain embryonic cardiomyocytes even after 2 mo under standard 2D culture conditions (5, 6). Transcription factor–induced cardiomyocytes also have many characteristics of neonatal cardiomyocytes (4). Furthermore, carcinogenesis and early senescence often develop in transcription factor–mediated induction of such phenotypic changes (8, 9).
We have previously shown that the transfer of transcriptome (TIPeR) from a rat astrocyte into a rat neuron converts the electrically active neuron into an electrically quiescent tAstrocyte cell (10). We asked whether the change in expression profile (i.e., modulation of relative abundance of gene products) could transdifferentiate electrically quiescent cells into electrically excitable cells. Here we demonstrate the conversion of an electrically quiescent fibroblast directly into an electrically excitable tCardiomyocyte in a mouse system. We also show that another electrically quiescent cell, the astrocyte, can be converted into a tCardiomyocyte. This conversion was confirmed by a diverse set of single-cell phenotyping procedures.
Results
Generation of tCardiomyocytes from Fibroblasts by Transcriptome Transfer.
TIPeR generation of the desired cardiomyocyte phenotype requires an available source of cardiomyocyte RNA. We isolated poly-A+ RNA from ventricular myocytes from adult mice (7–9 wk old) and transfected 2 μg of poly-A+ RNA per 35-mm culture dish into primary mouse embryonic fibroblast cells at passage 3 using cationic lipids. The transfected cultures were monitored daily for recovery and status. A second transfection was performed at varying intervals (3–7 d) after the first transfection. These TIPeR cells are referred to as cardio-TIPeR cells. As a control for RNA addition and transfection, we transfected fibroblast poly-A+ RNA into fibroblast cultures (fibro-TIPeR), using the same transfection procedure. We considered a cell to be a tCardiomyocyte (cardiomyocyte transcriptome-effected cell) once a cardio-TIPeR cell expressed any of the cardiomyocyte phenotype from a single-cell phenotyping procedure.
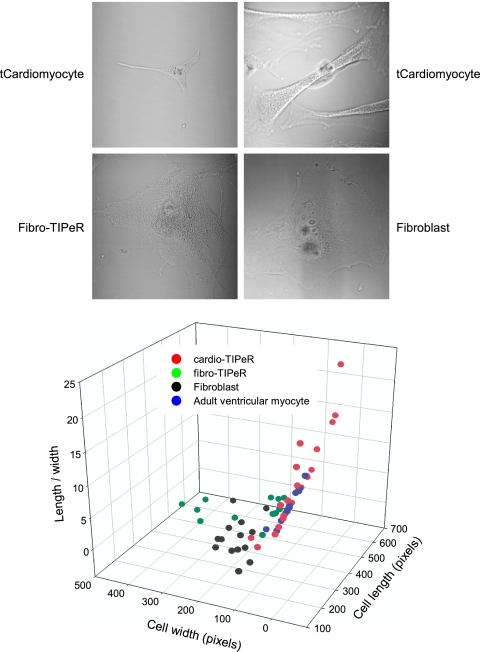
Within 2 wk after the first transfection, the overall morphology of individual cardio-TIPeR cells exhibited a morphology distinct from that of fibroblasts that further discriminated tCardiomyocytes from noneffected cardio-TIPeR cells. Compared with fibroblasts, tCardiomyocytes were more 3D under DIC imaging, with an increased elongated or triangular shape (Fig. 1, DIC images). A subpopulation of tCardiomyocytes exhibited a triangular shape similar to that of neonatal cardiomyocytes, whereas other tCardiomyocytes had an elongated rod shape similar to adult cardiomyocytes. The corresponding fibro-TIPeR cells appeared to be larger with a flat morphology indistinguishable from fibroblasts. Cell morphology analysis measuring the ratio of maximum cell length to minimum cell width showed that the subpopulation of cardio-TIPeR cells was distinct from the fibroblast cluster (low length-to-width ratio) and grouped with adult ventricular myocytes (AVMs) (high length-to-width ratio) (Fig. 1, graph). This result indicates that cardio-TIPeR cells develop morphology distinct from that of fibroblasts and fibro-TIPeR cells. The time lapse between transfection and the emergence of tCardiomyocyte morphologies suggests a requisite time dependence associated with these morphological changes. The diversity of cell morphologies (neonatal or adult cardiomyocyte-like) implies that a range of gene expression profiles is formed with the introduction and subsequent action of the donor transcriptome. The action of the donor transcriptome occurs in the context of the endogenous host transcriptome that varies among host cells. Although similar phenotypes exist among fibroblasts, the gene expression profiles are not identical; this applies to AVMs as well. We hypothesize that the initiation and maintenance of a cell reprogramming process will vary depending on the host cell expression profile (i.e., relative abundance of gene products).
Fig. 1.
tCardiomyocytes display cardiomyocyte-like morphology. (Top photomicrographs) Live tCardiomyocyte cells display triangular or elongated morphologies (Upper), but fibro-TIPeR cells have an enlarged flat shape similar to fibroblast cells (Lower). (Bottom graph) The cell length-to-width ratio of cardio-TIPeR cells shows that the subpopulation of cardio-TIPeR cells differs from fibroblast and fibro-TIPeR cells but is similar to adult ventricular myocytes.
tCardiomyocyte Expression of Cardiomyocyte Antigenic Markers.
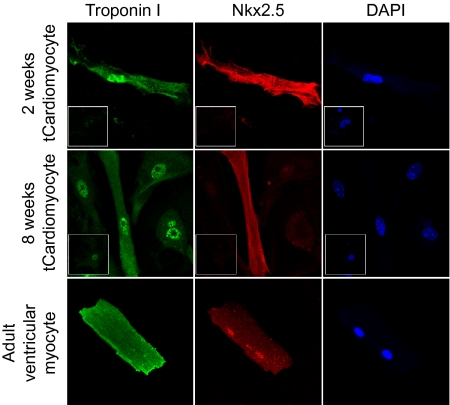
We assessed the expression of cardiac markers in tCardiomyocytes, specifically the cardiac muscle component cardiac troponin I and transcription factor Nkx2.5, by immunocytochemistry (Fig. 2). The expression of cardiac markers was observed at 2 wk posttransfection (Fig. 2, first row) and was stable for the duration of the 8-wk culturing period (Fig. 2, second row). The subcellular distribution of cardiac markers was similar in AVMs and tCardiomyocytes. The immunocytochemistry results were consistent with the cell morphology results; both changes were detected at 2 wk after the first transfection and persisted for more than 8 wk in morphologically distinctive cells.
Fig. 2.
tCardiomyocytes express cardiac antigenic markers continuously. tCardiomyocytes and fibro-TIPeR cells are double-immunostained with anti-cardiac troponin I antibody (green) and anti-Nkx2.5 antibody (red). tCardiomyocytes show similar expression patterns of cardiac antigenic markers as adult ventricular myocytes from 2 wk to 8 wk of incubation. (Insets) Immunostaining results of corresponding fibro-TIPeR cells.
Reprogramming of Global Gene Expression in tCardiomyocytes.
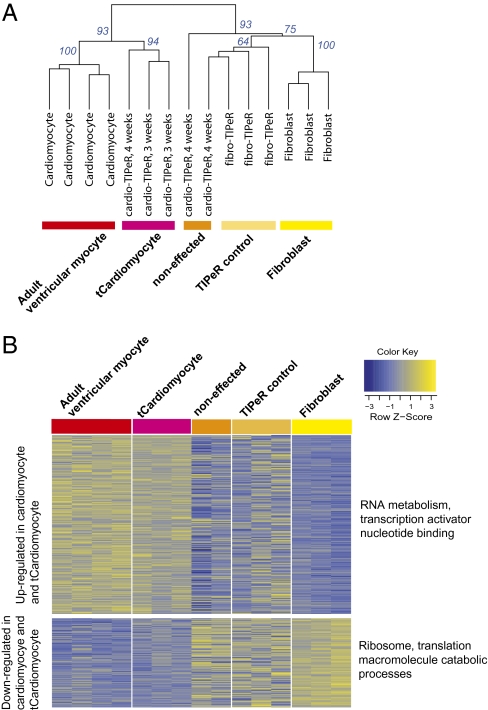
To assess global gene expression changes, we compared the transcriptome profiles of single tCardiomyocytes with single fibroblasts, AVMs, and fibro-TIPeR cells. Single-cell RNA was harvested by capillary-mediated aspiration. Poly-A+ RNA was amplified using an aRNA amplification procedure and used as a probe to screen Affymetrix Mouse Genome 430 2.0 microarrays. An informative group of 3,257 probe sets, differentially expressed between fibroblasts and AVMs, was selected and analyzed to compare gene expression profiles between single tCardiomyocytes and other single cells (Fig. 3A). Hierarchical clustering analysis showed that three out of five cardio-TIPeR cells (60%) were clustered with AVMs, one cardio-TIPeR cell was located with fibro-TIPeR cells, and the remaining cardio-TIPeR cells were located between the fibroblast group and the AVM-tCardiomyocyte group. Bootstrap resampling (1,000 times) resulted in the grouping of tCardiomyocytes and AVMs with 93% support.
Fig. 3.
Global gene expression of tCardiomyocytes is reprogrammed toward adult ventricular myocytes. (A) Dendrogram showing hierarchical clustering (Euclidean distance, complete linkage) of single AVMs, fibroblasts, cardio-TIPeR, and fibro-TIPeR using the expression values of 3,257 informative genes. Bootstrap values from 1,000 times resampling are shown. (B) Heat map showing cardiomyocyte-specific genes that are up-regulated in the tCardiomyocytes (n = 262) and fibroblast-specific genes that are down-regulated in the tCardiomyocytes (n = 136). Relevantly enriched Gene Ontology categories are annotated; see the full list in Tables S1 and S2).
Along with an increase in gene expression for genes traditionally thought to be AVM-enriched, a decrease in fibroblast-enriched gene expression also would be expected. This was seen in the cells that had transitioned from the fibroblast phenotype to the tCardiomyocyte phenotype (Fig. 3B).
tCardiomyocytes Function as Electrically Excitable Cells.
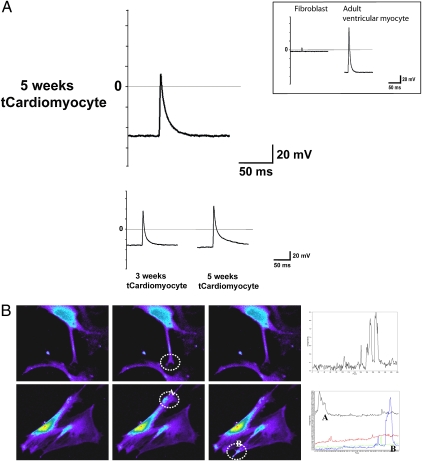
Because cardiomyocytes are electrically excitable, we assessed tCardiomyocytes for excitability using the patch clamp technique (Fig. 4A). We found that action potentials could be elicited from tCardiomyocytes, and that these voltage recordings were similar to those obtained from isolated mature ventricular myocytes (Fig. 4A, first row). tCardiomyocytes had identical resting potentials (−50 mV), with similar upstroke and repolarization patterns, as mature adult ventricular myocytes, although the peak amplitude of the action potentials from tCardiomyocytes was slightly lower than that from isolated mature ventricular myocytes. Action potentials were recorded in 10 out of 16 clamped cardio-TIPeR cells (62.5%). Resting membrane potentials ranged from −55 mV to −10 mV, and membranes were instantly depolarized with electric stimulation. The peak amplitudes and repolarization rates varied among tCardiomyocytes. These varying electrophysiological characteristics suggests that each tCardiomyocyte might have a unique composition of ion channel types and abundances conferring differing electrical properties (11). In separate experiments, but in accordance with the action potential data, we also observed cytosolic Ca2+ concentration changes in tCardiomyocytes (Fig. 4B). tCardiomyocytes demonstrated intracellular local Ca2+ oscillations without stimulation (12, 13).
Fig. 4.
tCardiomyocytes gain electrical functions similar to adult ventricular myocytes. (A) tCardiomyocyte expresses stereotypical cardiac action potential (first row). Other tCardiomyocytes display a more diverse pattern of action potential profiles. (Inset) Patch clamp results of fibroblasts and adult ventricular myocytes. (B) tCardiomyocytes show intracellular local Ca2+ oscillations. Local areas are selected (white dashed circles) and local Ca2+ changes are recorded (line graphs) by time course.
Generation of tCardiomyocytes from Mouse Astrocytes.
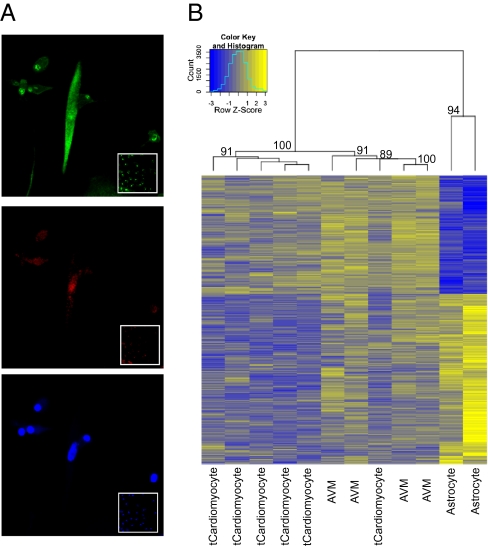
To examine the dependency of tCardiomyocyte generation on host cell type, we transfected AVM poly-A+ RNAs into primary mouse cortical astrocyte cultures using the identical procedures used for the fibroblast cultures. Cardio-TIPeR astrocyte cultures showed similar progression as seen in cardio-TIPeR fibroblast cultures. The subset of cardio-TIPeR astrocytes showed elevated and elongated cell morphologies at 2 wk after the first transfection. Expression of cardiac troponin I and Nkx2.5 was observed in astrocyte-generated tCardiomyocytes that displayed elongated cell morphology (Fig. 5A). In addition to the immunocytochemistry staining, global gene expression changes were examined in astrocyte-generated tCardiomyocytes (Fig. 5B). A group of informative 1,690 probe sets, differentially expressed between AVMs and tCardiomyocytes versus mock-transfected astrocytes (P < 0.01), was selected and analyzed further. All six AVM mRNA transfected astrocyte single cells were grouped with single AVMs with 100% bootstrap support from 1,000 resamplings. It should be noted that one of the tCardiomyocytes was clustered within the AVM group, demonstrating that this tCardiomyocyte is further along the transdifferentiation pathway then some of the other cells by virtue of sharing a more similar global gene expression profile with single AVMs.
Fig. 5.
tCardiomyocytes generated from mouse astrocytes show phenotypic characteristics of AVMs. (A) Astrocyte-generated tCardiomyocytes (3 wk after the transfection) double-immunostained with anti-troponin I antibody (green, Top) and anti-Nkx2.5 antibody (red, Middle). Nuclei are shown in blue (Bottom). (Insets) Immunostaining results of corresponding mock-transfected astrocytes. (B) Dendrogram and heat map showing hierachical clustering (Pearson distance, complete method) of single AVMs, astrocyte-generated tCardiomyocytes, and astrocytes (4 wk after the transfection). Differentially expressed 1,690 informative genes are selected by P value cutoff (P < 0.01). Bootstrap values (%) from 1,000 resamplings are shown at each node.
Discussion
tCardiomyocyte generation using transcriptome transfer has numerous merits (1). It does not require a priori screening as to which transcription factors and in which quantities are necessary to induce phenotypical changes (2); it is rapid, because it can be generated by direct transdifferentiation of fibroblasts (3); it is safe, because it is a virus and DNA vector-free procedure; and, most importantly (4), it is versatile, because tCardiomyocytes theoretically can be generated from any type of cell. We theorize that the gene expression profile changes progressively from fibroblast to cardiomyocyte during the tCardiomyocyte generation process without constant overexpression of specific transcription factors, thereby decreasing the likelihood of the cells becoming oncogenic. The donor cardiomyocyte cell mRNA population contains the natural levels of RNAs required to generate and maintain cardiomyocyte phenotype. The differentially expressed gene list contains one transcription factor (Mef2c) from the three transcription factors (Gata4, Mef2c, and Tbx5) used in the DNA-based transcription factor–mediated direct conversion (4). The expression of Mef2c was similar in tCardiomyocytes and AVMs, in contrast to the strong promotor-driven overexpression used in other induced cell reprogramming methods. In the DNA-based transcription factor–mediated direct conversion, expression levels of the three transcription factors are twofold to fourfold higher in induced cardiomyocytes than in cardiomyocytes (Gene Expression Omnibus accession no. GSE22292) (4). This shows that TIPeR-induced remodeling does not require the constant overactive expression of specific transcription factors to reprogram a cell. Thus, TIPeR-induced transdifferentation is distinct from the production of iPSCs through transcription factor mediation, not only in the pathway of remodeling, but also in the abnormal action of transgenes. It is important to consider the overall balance of gene expression (i.e., the relative abundance of gene products) rather than overexpression of selective transcription factors that affect only a limited number of pathways that are under the control of those transcription factors. We postulate that transcription factor–mediated iPSC generation has a low yield because specific transcription factor mixtures in which the transcription factors are not in the appropriate relative abundances might not be able to reprogram most of the recipient cells that exist in diverse expression states. This is supported by the fact that different transcription factor combinations with the addition of small molecules have differing effects on iPSC generation (14–19). Recent studies have demonstrated non–transcription factor–mediated reprogramming of somatic cell into iPSCs based solely on vector transfection, revealing the complexity and diversity of the underlying mechanisms of cell reprogramming (20, 21).
Selected individual genes from single cells demonstrated a wide range of expression levels in all cell types (Fig. S1). For most genes, the expression levels across individual cells differed by more than a twofold magnitude even within the same cell types, for example, fourfold to sevenfold for Mef2c in individual AVMs, threefold to fourfold for fibroblasts (Fig. S1). We suggest that the expression level of each gene may vary, but it is the ratio of expression of selected genes (i.e., relative abundances) that contributes to the development of particular cell phenotypes. In other words, if the expression level of any specific gene of a single cell is within a range that is distinct from that of another cell type, then the variable expression levels are considered to indicate intercellular variability, not a distinct cell type (i.e., members of a phenotypic cloud) (22).
TIPeR did not change phenotypes instantly. It took 2 wk to observe the new phenotypes of tCardiomyocytes, but this change was stable for more than 2 mo, the period of culturing. The information obtained from morphology (cell structure) and electrophysiological characterization (cell function) suggests that morphological changes precede the development of function. In this case, the transformation from a quiescent cell to an electrically active cell seems to require an initial morphological change. Fibro-TIPeR cells grew better than cardio-TIPeR cells. We presume that the confusing signals generated between a TIPeR cell’s different endogenous and exogenous transcriptomes initially destabilize the cell; however, the endogenous transcriptome may subdue the exogenous transcriptome in most cells (giving rise to intermediate cellular phenotypes), except when a new gene expression profile generated by the combination of endogenous and exogenous transcriptomes successfully initiates cell reprogramming and proceeds to reorganize cellular structure and progressively develop new biological functions.
Intriguingly, immunocytochemistry of the fibroblast-generated tCardiomyocytes revealed cardiac troponins in both the cytoplasm and the nucleus, along with transcription factor Nkx2.5 in the cytosol and nucleus (Fig. 2), differing from the adult cardiomyocyte distribution, in which the troponins would be expected to be localized in the cytoplasm and Nkx2.5 in the nucleus. Nonetheless, the observed staining pattern is consistent with that of others that demonstrated a similar distribution in both developing and dying cardiomyocytes (23–28). Our interpretation of these data is further supported by the astrocyte-generated tCardiomyoctye phenotyping data showing a predominantly adult distribution of the troponins in the cytoplasm and Nkx2.5 in the nucleus (Fig. 5). These data highlight the time-dependent nature of cellular phenotypic changes and show how different host cells (likely due to differences in the host cell native transcriptome) may respond in different time frames to the induction of transdifferentiation.
We applied the tCardiomyocyte generation procedure to mouse neurons and astrocytes to test the dependency of this procedure on source cell types (i.e., endogenous transcriptomes). tCardiomyocytes generated from astrocytes expressed cardiac antigenic markers (Fig. 5A) and showed global gene expression profiles similar to those of AVMs (Fig. 5B). Although we expected the neurons, which are electrically active cells, to be transdifferentiated into the distinct yet still electrically active cardiomyocytes with high efficiency, we found that the AVM transcriptome–transfected neuronal cultures tended to die within 24 h of TIPeRing. We believe that this resulted from the addition of electrically active channel-encoding RNA populations (in which the channel RNAs are in relative abundance) into the already electroexcitable neurons, which induces the overproduction of electrically active channels, leading to cell death. Although this action is untested, it may be manipulated by pharmacologic modulation of host cell endogenous channel activity.
It is difficult to measure reprogramming efficiency because fibroblasts proliferate rapidly, and tCardiomyocyte characterization is confirmed by a single-cell phenotyping procedure that results in loss of the cells. Therefore, we counted the occurrence of tCardiomyocytes from experiments rather than measuring reprogramming efficiency at the cell number level. Out of 22 tCardiomyocyte-generating experiments using fibroblasts, tCardiomyocytes were observed six times by single-cell analysis (27.27%) (Table S3).
Because the donor and host transcriptomes are the dominant determiners of cellular phenotype, it is possible that dramatic changes in the local environment can alter gene expression to induce a diseased phenotype in vivo. Given this scenario, it is easy to envision disease processes that occur in part by pushing the preexisting indigenous transcriptome to an another profile, thereby weakening the cells’ ability to function appropriately and initiating a cascade of disease-related consequences (29). This idea has therapeutic implications. It may be possible to use endogenous stimulators or pharmacologic agents to convert one cell type into a therapeutic cell type in vivo, for example, conversion of a cardiac melanocyte into a cardiomyocyte.
Materials and Methods
Cell Culture and Poly-A+ RNA Transfection.
Primary mouse embryonic fibroblast (PMEF-NL; Millipore) culture was incubated in DMEM supplemented with 10% FBS at 37 °C with 5% CO2. WT adult mouse (strain C57BL/6, 7–9 wk old) ventricular myocytes were isolated from hearts mounted on a Langendorf apparatus and perfused with Ca2+-free Tyrode’s solution with collagenase B and D plus protease. The ventricle was dissected, and sections of ventricle tissue were gently triturated to dissociate individual myocytes. Mouse cortical astrocytes were isolated from mouse embryos and cultured in DMEM supplemented with 10% FBS. AVM poly-A+ RNA was isolated using TRIzol and the Micro-FastTrack 2.0 Kit (Invitrogen), following the manufacturer’s protocol. There were two transfection protocols. First, cell transcription was inhibited by adding 80 μM 5,6-dichloro-1-β-d-ribofuranosylbenzimidazole for 30 min before transfection. Transcription inhibitor–treated cells were transfected with 2 μg of poly-A+ RNA per 35-mm culture dish using the TransMessenger Transfection Reagent Kit (Qiagen) following the manufacturer’s protocol. Second, cells were incubated with 80 μM 5,6-dichloro-1-β-d-ribofuranosylbenzimidazole for 6 h, after which cells that had detached from the bottom were collected by centrifugation. The collected cells were transfected with 4 μg of poly-A+ RNA using Lipofectamine 2000 (Invitrogen). Transfected cells were retransfected at 2–7 d after the first transfection using the TransMessenger Transfection Reagent Kit. Primary mouse embryonic fibroblast poly-A+ RNA was used as a control transfection. The media was changed every 2–3 d, and growth was observed under a light microscope. Live cell images were obtained using the Zeiss LSM 510 or LSM 710 Microscope System. Cell length and width were measured by drawing straight lines encompassing nuclei on live cell images using MetaMorph software (Molecular Devices).
Immunocytochemistry.
Cells were fixed in 4% paraformaldehyde for 5 min and permeabilized in cold methanol for 10 min at −20 °C. The fixed cells were incubated in blocking solution (10% goat serum in PBS) for 30 min at room temperature and then incubated overnight in primary antibodies (1:500 dilution in 1% goat serum in PBS) at 4 °C. Alexa Fluor 488– or Alexa Fluor 568–conjugated secondary antibodies (1:500 dilution in 1% goat serum in PBS) were used to label primary antibodies. Immunostained cells were mounted on glass slides using DAPI-containing mounting medium. Images were captured with the Zeiss LSM 510 or LSM 710 microscope system.
Single-Cell Microarray.
Poly-A+ RNAs of single cells were isolated and amplified following the standard single-cell harvesting and aRNA amplification method (30). Amplified single-cell aRNAs (three or four rounds of amplification) were used to probe the Affymetrix GeneChip Mouse Genome 430 2.0 array. Data were analyzed using the R/Bioconductor package and GeneSpring GX version 11 (Agilent) (31, 32). The second-highest intensity values were extracted from the probe sets, and informative probe sets were selected based on their ability to distinguish AVMs from fibroblasts. Individual t tests were performed for each probe set, contrasting AVM expression (n = 4) and fibroblast expression (n = 3), and the 3,257 probe sets with expression differing significantly between the two cell types (P < 0.05) were retained. Hierarchical clustering was performed on these 3,257 probe sets across all cell types (four AVMs, three fibroblasts, five cardio-TIPeR cells, and three fibro-TIPeR cells), using Euclidean distance and the complete linkage method. Bootstrap values were calculated using the R pvclust package; unbiased P values for 1,000 times resampling support of the tree were reported. Heat maps were produced using the heat map.2 routine in the R gplots package, focusing on gene subsets for which successfully converted tCardiomyocytes had significantly (P < 0.1) different expression than untreated fibroblasts by the t test on each probe set. These lists were filtered to exclude probe sets with very similar expression (less than a twofold difference) between AVMs and fibroblasts, as well as probe sets for genes that appeared to be induced by the treatment effect [probe sets showing a significant (P < 0.05) expression difference between fibroblasts and the fibroblast treatment controls]. Gene Ontology enrichment analysis was performed using the DAVID Bioinformatics Resources 6.7 Web site (33, 34).
Patch-Clamping and Ca2+ Imaging.
Patch clamp recordings were performed using the patch clamp technique in the whole-cell configuration as described previously (29). In brief, GΩ seals were achieved using pipettes fashioned from borosilicate glass (WPI) with resistances of 2–3 MΩ after fire polishing. Recordings were obtained from putative tCardiomyocytes at 25 °C using a resistive heater system (Warner Instruments). Action potentials were elicited using an Axopatch 200B amplifier (Molecular Devices) by injecting 0.4- to 0.5-nA pulses at 1–3 Hz with a 0.2- to 0.3-ms duration controlled by a Pentium 4–based PC running the pClamp program (v. 9.2; Molecular Devices). Voltage recordings were filtered at 1–2 kHz and digitized at 25 kHz using the Digidata 1332A A/D converter (Molecular Devices). Two solutions were used for current clamp recordings: pipette solution (80 mM K+-aspartate, 50 mM KCl, 1 mM MgCl2, 10 mM EGTA, 10 mM Hepes, and 3 mM Mg2+ATP, pH-adjusted to 7.2 with KOH) and bath solution (132 mM NaCl, 4.8 mM KCl, 1.2 mM CaCl2, 2 mM MgCl2, 10 mM Hepes, and 5 mM glucose, pH-adjusted to 7.4 with NaOH). Cytosolic free Ca2+ changes were monitored as follows. Fluo 4-AM (5 μg/mL in the bath solution) (Invitrogen) was loaded into cultures for 40 min, washed three times in the bath solution, and de-esterified for 15 min at room temperature. Fluo 4-AM–loaded cells were observed with the Zeiss LSM 710 system at 2- to 3-s intervals (13).
Supplementary Material
Acknowledgments
This work was supported by National Institutes of Health Director’s Pioneer Award DP004117. V.V.P. and N.B.P. were supported by Research Career Award HL074108. Further support was provided by Human Resources Fact Finder funds from the Commonwealth of Pennsylvania and the Keck Foundation.
Footnotes
The authors declare no conflict of interest.
This article is a PNAS Direct Submission.
Data deposition: The data reported in this paper have been deposited in the Gene Expression Omnibus (GEO) database, www.ncbi.nlm.nih.gov/geo (accession no. GSE30164).
This article contains supporting information online at www.pnas.org/lookup/suppl/doi:10.1073/pnas.1101223108/-/DCSupplemental.
References
- 1.Laflamme MA, Zbinden S, Epstein SE, Murry CE. Cell-based therapy for myocardial ischemia and infarction: Pathophysiological mechanisms. Annu Rev Pathol. 2007;2:307–339. doi: 10.1146/annurev.pathol.2.010506.092038. [DOI] [PubMed] [Google Scholar]
- 2.Germani A, Di Rocco G, Limana F, Martelli F, Capogrossi MC. Molecular mechanisms of cardiomyocyte regeneration and therapeutic outlook. Trends Mol Med. 2007;13:125–133. doi: 10.1016/j.molmed.2007.01.002. [DOI] [PubMed] [Google Scholar]
- 3.Warren L, et al. Highly efficient reprogramming to pluripotency and directed differentiation of human cells with synthetic modified mRNA. Cell Stem Cell. 2010;7:618–630. doi: 10.1016/j.stem.2010.08.012. [DOI] [PMC free article] [PubMed] [Google Scholar]
- 4.Ieda M, et al. Direct reprogramming of fibroblasts into functional cardiomyocytes by defined factors. Cell. 2010;142:375–386. doi: 10.1016/j.cell.2010.07.002. [DOI] [PMC free article] [PubMed] [Google Scholar]
- 5.Zhang J, et al. Functional cardiomyocytes derived from human induced pluripotent stem cells. Circ Res. 2009;104:e30–e41. doi: 10.1161/CIRCRESAHA.108.192237. [DOI] [PMC free article] [PubMed] [Google Scholar]
- 6.Boheler KR, et al. Differentiation of pluripotent embryonic stem cells into cardiomyocytes. Circ Res. 2002;91:189–201. doi: 10.1161/01.res.0000027865.61704.32. [DOI] [PubMed] [Google Scholar]
- 7.Takeuchi JK, Bruneau BG. Directed transdifferentiation of mouse mesoderm to heart tissue by defined factors. Nature. 2009;459:708–711. doi: 10.1038/nature08039. [DOI] [PMC free article] [PubMed] [Google Scholar]
- 8.Feng Q, et al. Hemangioblastic derivatives from human induced pluripotent stem cells exhibit limited expansion and early senescence. Stem Cells. 2010;28:704–712. doi: 10.1002/stem.321. [DOI] [PubMed] [Google Scholar]
- 9.Knoepfler PS. Deconstructing stem cell tumorigenicity: A roadmap to safe regenerative medicine. Stem Cells. 2009;27:1050–1056. doi: 10.1002/stem.37. [DOI] [PMC free article] [PubMed] [Google Scholar]
- 10.Sul JY, et al. Transcriptome transfer produces a predictable cellular phenotype. Proc Natl Acad Sci USA. 2009;106:7624–7629. doi: 10.1073/pnas.0902161106. [DOI] [PMC free article] [PubMed] [Google Scholar]
- 11.Harrell MD, Harbi S, Hoffman JF, Zavadil J, Coetzee WA. Large-scale analysis of ion channel gene expression in the mouse heart during perinatal development. Physiol Genomics. 2007;28:273–283. doi: 10.1152/physiolgenomics.00163.2006. [DOI] [PubMed] [Google Scholar]
- 12.Harootunian AT, Kao JP, Paranjape S, Tsien RY. Generation of calcium oscillations in fibroblasts by positive feedback between calcium and IP3. Science. 1991;251:75–78. doi: 10.1126/science.1986413. [DOI] [PubMed] [Google Scholar]
- 13.Cheng H, Lederer WJ, Cannell MB. Calcium sparks: Elementary events underlying excitation-contraction coupling in heart muscle. Science. 1993;262:740–744. doi: 10.1126/science.8235594. [DOI] [PubMed] [Google Scholar]
- 14.Shi Y, et al. Induction of pluripotent stem cells from mouse embryonic fibroblasts by Oct4 and Klf4 with small-molecule compounds. Cell Stem Cell. 2008;3:568–574. doi: 10.1016/j.stem.2008.10.004. [DOI] [PubMed] [Google Scholar]
- 15.Lyssiotis CA, et al. Reprogramming of murine fibroblasts to induced pluripotent stem cells with chemical complementation of Klf4. Proc Natl Acad Sci USA. 2009;106:8912–8917. doi: 10.1073/pnas.0903860106. [DOI] [PMC free article] [PubMed] [Google Scholar]
- 16.Li W, et al. Generation of human-induced pluripotent stem cells in the absence of exogenous Sox2. Stem Cells. 2009;27:2992–3000. doi: 10.1002/stem.240. [DOI] [PMC free article] [PubMed] [Google Scholar]
- 17.Huangfu D, et al. Induction of pluripotent stem cells from primary human fibroblasts with only Oct4 and Sox2. Nat Biotechnol. 2008;26:1269–1275. doi: 10.1038/nbt.1502. [DOI] [PubMed] [Google Scholar]
- 18.Esteban MA, et al. Vitamin C enhances the generation of mouse and human induced pluripotent stem cells. Cell Stem Cell. 2010;6:71–79. doi: 10.1016/j.stem.2009.12.001. [DOI] [PubMed] [Google Scholar]
- 19.Zhu S, et al. Reprogramming of human primary somatic cells by OCT4 and chemical compounds. Cell Stem Cell. 2010;7:651–655. doi: 10.1016/j.stem.2010.11.015. [DOI] [PMC free article] [PubMed] [Google Scholar]
- 20.Kane NM, et al. Lentivirus-mediated reprogramming of somatic cells in the absence of transgenic transcription factors. Mol Ther. 2010;18:2139–2145. doi: 10.1038/mt.2010.231. [DOI] [PMC free article] [PubMed] [Google Scholar]
- 21.Ye L, et al. Generation of induced pluripotent stem cells using site-specific integration with phage integrase. Proc Natl Acad Sci USA. 2010;107:19467–19472. doi: 10.1073/pnas.1012677107. [DOI] [PMC free article] [PubMed] [Google Scholar]
- 22.Kim J, Eberwine J. RNA: State memory and mediator of cellular phenotype. Trends Cell Biol. 2010;20:311–318. doi: 10.1016/j.tcb.2010.03.003. [DOI] [PMC free article] [PubMed] [Google Scholar]
- 23.Zhou B, et al. Fog2 is critical for cardiac function and maintenance of coronary vasculature in the adult mouse heart. J Clin Invest. 2009;119:1462–1476. doi: 10.1172/JCI38723. [DOI] [PMC free article] [PubMed] [Google Scholar]
- 24.Chen Y, et al. Vascular endothelial growth factor promotes cardiomyocyte differentiation of embryonic stem cells. Am J Physiol Heart Circ Physiol. 2006;291:H1653–H1658. doi: 10.1152/ajpheart.00363.2005. [DOI] [PubMed] [Google Scholar]
- 25.Porrello ER, et al. Transient regenerative potential of the neonatal mouse heart. Science. 2011;331:1078–1080. doi: 10.1126/science.1200708. [DOI] [PMC free article] [PubMed] [Google Scholar]
- 26.Gorza L, Menabó R, Di Lisa F, Vitadello M. Troponin T cross-linking in human apoptotic cardiomyocytes. Am J Pathol. 1997;150:2087–2097. [PMC free article] [PubMed] [Google Scholar]
- 27.Gutkowska J, et al. Functional arginine vasopressin system in early heart maturation. Am J Physiol Heart Circ Physiol. 2007;293:H2262–H2270. doi: 10.1152/ajpheart.01320.2006. [DOI] [PubMed] [Google Scholar]
- 28.Morritt AN, et al. Cardiac tissue engineering in an in vivo vascularized chamber. Circulation. 2007;115:353–360. doi: 10.1161/CIRCULATIONAHA.106.657379. [DOI] [PubMed] [Google Scholar]
- 29.Levin MD, et al. Melanocyte-like cells in the heart and pulmonary veins contribute to atrial arrhythmia triggers. J Clin Invest. 2009;119:3420–3436. doi: 10.1172/JCI39109. [DOI] [PMC free article] [PubMed] [Google Scholar]
- 30.Van Gelder RN, et al. Amplified RNA synthesized from limited quantities of heterogeneous cDNA. Proc Natl Acad Sci USA. 1990;87:1663–1667. doi: 10.1073/pnas.87.5.1663. [DOI] [PMC free article] [PubMed] [Google Scholar]
- 31.Irizarry RA, et al. Summaries of Affymetrix GeneChip probe level data. Nucleic Acids Res. 2003;31:e15. doi: 10.1093/nar/gng015. [DOI] [PMC free article] [PubMed] [Google Scholar]
- 32.Gentleman RC, et al. Bioconductor: Open software development for computational biology and bioinformatics. Genome Biol. 2004;5:R80. doi: 10.1186/gb-2004-5-10-r80. [DOI] [PMC free article] [PubMed] [Google Scholar]
- 33.Dennis G, Jr, et al. DAVID: Database for Annotation, Visualization, and Integrated Discovery. Genome Biol. 2003;4:P3. [PubMed] [Google Scholar]
- 34.Huang DW, Sherman BT, Lempicki RA. Systematic and integrative analysis of large gene lists using DAVID bioinformatics resources. Nat Protoc. 2009;4:44–57. doi: 10.1038/nprot.2008.211. [DOI] [PubMed] [Google Scholar]
Associated Data
This section collects any data citations, data availability statements, or supplementary materials included in this article.


