

Abstract
Large reductions in the abundance of exploited land predators have led to significant range contractions for those species. This pattern can be formalized as the range–abundance relationship, a general macroecological pattern that has important implications for the conservation of threatened species. Here we ask whether similar responses may have occurred in highly mobile pelagic predators, specifically 13 species of tuna and billfish. We analyzed two multidecadal global data sets on the spatial distribution of catches and fishing effort targeting these species and compared these with available abundance time series from stock assessments. We calculated the effort needed to reliably detect the presence of a species and then computed observed range sizes in each decade from 1960 to 2000. Results suggest significant range contractions in 9 of the 13 species considered here (between 2% and 46% loss of observed range) and significant range expansions in two species (11–29% increase). Species that have undergone the largest declines in abundance and are of particular conservation concern tended to show the largest range contractions. These include all three species of bluefin tuna and several marlin species. In contrast, skipjack tuna, which may have increased its abundance in the Pacific, has also expanded its range size. These results mirror patterns described for many land predators, despite considerable differences in habitat, mobility, and dispersal, and imply ecological extirpation of heavily exploited species across parts of their range.
Keywords: marine macroecology, mobile predators, pelagic fisheries, species distribution
Although large reductions in the abundance of land predators have mostly occurred over historical timescales, populations of large pelagic predators such as tuna, billfish, and sharks have declined much more recently (1–3) because of intensified exploitation. For highly commercial species in particular, this process often involves the collection of detailed data that allow us to investigate general hypotheses about the wider ecological effects of predator depletion. Here we use these data to investigate changes in species’ geographic ranges, defined as the sum of all localities where the species is known to regularly occur (4).
On land, there are well-documented reductions in range size that have resulted from the declining abundance of large mammals, such as wolves and bears (5). Ceballos and Ehrlich (6), for example, described a 50% range reduction on average for 173 declining mammal species on six continents. Similar range contractions have been observed in some exploited marine mammals, including seals (7), cetaceans (8), and sea otters (9). These changes in abundance and range can have powerful ecosystem effects, such as well-documented trophic cascades driven by the local loss of sea otters (9) and wolves (10).
Such range losses seem to conform to a larger macroecological pattern, the range–abundance relationship, which posits that species of low abundance generally tend to occupy smaller ranges (11, 12). From a conservation perspective this puts species that have declined to critically low abundances into a “double jeopardy,” because the population is not just smaller but also occurs in fewer places (13, 14). Often, this smaller range also tends to be more fragmented than the original distribution of the species, reducing gene flow and dispersal among subpopulations (11, 15). On land, some proportion of these changes are likely driven by habitat fragmentation and destruction, which may enhance these patterns in addition to the effects of reducing abundance via the hunting or culling of animals.
For marine fishes, particularly for pelagic and highly mobile species such as tuna and billfish, it is an open question whether similar patterns apply. Large reductions in abundance are a standard outcome of fisheries management for maximum yield (16–18), but how this may affect the range size of a species is unclear. Many pelagic species are highly mobile and easily disperse across ocean basins, as has been revealed by tagging and tracking experiments (19, 20). Thus, a reduction in abundance may occur more evenly across their range, owing to the constant mixing of individuals. If there was significant population structure and fidelity of subpopulations to particular areas, however, spatially uneven fishing pressure could possibly eliminate subpopulations that exclusively use or congregate at a particular part of the species range.
Here we used two global data sets on the spatial distribution of commercial tuna (Thunnini) and billfish (Istiophoridae, Xiphiidae) catches at a 5° longitude × 5° latitude scale to examine changes in the observed distribution of these species over time. We calculated the effort needed to reliably detect a species in each individual 5° × 5° cell and then examined decadal changes in range occupancy for each cell that has sufficient fishing effort from the 1960s to the 1970s, 1980s, and 1990s. This follows previous work documenting significant reductions in abundance and diversity for these species (1, 2, 21), which potentially could also translate into significant range reductions. We tested the null hypotheses that there would be no changes in the observed range size over time.
Results
To asses tuna and billfish ranges we mapped out species’ observed occurrences from a multidecadal database of global Japanese longline fisheries targeting these species, as well as from the United Nations Food and Agriculture Organization (FAO) Tuna and Billfish Atlas, which includes spatial catch data from all fleets (Fig. 1 A–D). Data were binned by decade to detect long-term change and to average across possible seasonal and year-to-year variability in fleet targeting and fish distribution. We found that the two data sets complemented each other in achieving global coverage. Data were processed as follows: a species presence was recognized when reported catches exceeded five individuals (Japanese data) or five tons (FAO data) per decade. Alternative occurrence thresholds did not have a substantial effect on the results. A species absence was recognized when it was not reported as being caught (or present below the occurrence threshold, which should exclude stragglers or misidentifications), yet sufficient longlining effort was recorded to ensure a 99% probability that the species would have been detected if present (details in Methods and SI Methods). Using these data we can only assess changes in the observed range, which includes cells that showed presence of a species at the above thresholds in at least one decade and that had sufficient sampling effort to reliably detect presence or absence in other decades. Hence, only cells with sufficient fishing effort were included in calculations of range changes (Fig. 1 E and F). Note that the total range of a species may exceed its observed range. Other species data and ranges are shown in Fig. S1.
Fig. 1.

Mapping species ranges. Shown are raw data for Atlantic bluefin tuna (T. thynnus) and Pacific bluefin tuna (T. orientalis) in the 1960s (Left) and 1990s (Right). Depth-corrected Japanese longlining (A and B) and FAO catch data (C and D): white indicates no effort and gray indicates effort but no catch (Japanese data only); otherwise the colors indicate catch. (E and F) Combined raw data for use in the analysis. Gray indicates no data. Orange indicates Japanese data were used. Blue indicates FAO data were used. Presence is indicated by a white diagonal line, absence is indicated by no line. It can be seen how FAO data fill in gaps in the Japanese data, for example in the Gulf of Mexico, allowing the use of much more complete ranges. Cells with catch but without presences indicate occurrences below a specified presence threshold of five individuals (or five tons caught) per decade.
Of 13 tuna and billfish species with sufficient data, we found that 9 species declined significantly in their observed range in at least one ocean, 4 did not change, and 2 increased significantly in at least one ocean (Fig. 2 and Table 1). Most species showed consistent responses across different oceans, with the exception of skipjack tuna (Katsuwonus pelamis) and sailfish (Istiophorus platypterus), which declined in the Atlantic and Indian Oceans but expanded in the Eastern Pacific (Table 1).
Fig. 2.

Changes in observed tuna and billfish ranges between the 1960s and 1990s. Cells that are occupied in both decades are indicated in gray, range loss over time is shown in blue, and range expansion in red.
Table 1.
Observed range change in tuna and billfish, 1960–1999
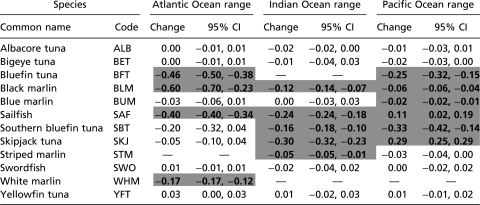 |
Significant range changes in each ocean are highlighted in bold (P < 0.05). Thirteen species were analyzed. Note that bluefin tuna includes an Atlantic (T. thynnus) and Pacific species (T. orientalis). CI, confidence interval.
Range changes (both increases and decreases) occurred mostly around the fringes but rarely in the core of a species range (Fig. 2). The largest range contractions were observed in the Atlantic, where three species lost 40% or more of their observed range between the 1960s and 1990s (Table 1). In the Indian Ocean significant range losses over the same time frame were estimated between 5% and 30%; in the Pacific these ranged between 2% and 33%. Significant range expansions occurred only in the Pacific, with sailfish expanding by 11% and skipjack tuna by 29%, mostly in the Eastern Pacific basin (Fig. 2 F and H).
Among the tunas, Atlantic bluefin tuna (Thunnus thynnus) stood out by losing 46% of its total observed range, including almost all of its former distribution in the Southern Atlantic (Fig. 1, Fig. 2C, and Table 1). Pacific bluefin (Thunnus orientalis) and southern bluefin tuna (Thunnus maccoyii) also both decreased their ranges between the 1960s and 1990s, albeit not as markedly as T. thynnus (Fig. 2 C and G). None of the other tunas showed significant range contractions, with the exception of skipjack in the Indian (but not Atlantic or Pacific) Ocean (Fig. 2H and Table 1).
Among the billfish, the black marlin (Istiompax indica) range contracted the most, particularly in the Atlantic (60%). Note, however, that the species occupied very few cells there even in the 1960s; because this species is generally considered an Indo-Pacific endemic these records may represent misidentifications or vagrants from the Indian Ocean, where the species also declined substantially (Fig. 2D and Table 1). Range declines for black marlin were also significant in the Pacific, although less pronounced. This appeared as a general pattern across species: declines in the Pacific were generally less severe (or not present at all) compared with the Atlantic and Indian Ocean (Table 1). Sailfish even increased in observed range in the Pacific, while declining in both the Atlantic and Indian Ocean (Fig. 2F). White marlin (Kajikia albida) and striped marlin (Kajikia audax) declined in their observed range in the Atlantic and Indian Ocean, respectively (Fig. 2 K and I). Blue marlin (Makaira nigricans) did not decline substantially (although a 2% range decrease in the Pacific was statistically significant). Swordfish (Xiphias gladius) was the only billfish that showed no significant change in any ocean (Fig. 2J and Table 1).
For species that showed range contractions, these tended to occur progressively throughout the 1970s, 1980s, and 1990s (Fig. 3). None of these trajectories reversed significantly. Range expansions showed less of a temporal trend, for example skipjack in the Pacific seemed to decrease in the 1970s and 1980s but greatly expanded in the 1990s (Fig. 3C).
Fig. 3.

Range changes by decade. Shown are the observed range changes (±95% confidence interval) in the (A) Atlantic, (B) Indian, and (C) Pacific Ocean. Range extent relative to the 1960s: green symbols represent 1970s, blue 1980s, black 1990s. For species codes refer to Table 1. Positive values indicate a range expansion, negative a range contraction.
Available tuna and swordfish stock assessments (n = 11) indicated that large changes in stock abundance may correlate with large changes in the occupied range (Fig. 4). This was true both for a strongly increasing species (skipjack tuna) as well as a decreasing one (Atlantic bluefin). Intermediate changes in abundance did not seem to have a large effect on ranges for the species of tuna examined here (Fig. 4). Unfortunately there were no long-term stock abundance estimates available for any of the marlin species.
Fig. 4.

Abundance vs. observed range changes. Abundance estimates were derived from stock assessments published by the relevant management bodies and include yellowfin, skipjack, albacore, and Atlantic bluefin tuna, as well as swordfish stocks. Fitted line was derived from a generalized additive model.
Discussion
In this study we applied a macroecological perspective to marine pelagic fisheries, an approach that has become more common in contemporary fisheries research (22), yielding insights into large-scale changes in abundance, distribution, and diversity (23). We present evidence for progressive contractions in the observed ranges of 9 of the 13 species of tuna and billfish examined. Range contractions were particularly pronounced for the larger species, such as all bluefin tunas and black marlin. For tuna there seemed to be some evidence that large range changes correlated with large changes in abundance, although there were too few data points available to make a definitive statement about the form of this relationship (Fig. 4). It did emerge that species that are of known conservation concern are more likely to show range contractions. Atlantic bluefin tuna, for example, seemed to now be largely confined to the North Atlantic (Fig. 1 and 2), yet there were significant fisheries for this species in the South Atlantic as recently as 40 y ago (24). Recent tagging studies in the North Atlantic confirmed that this species today is not typically migrating south of 20° N (19). Likewise, it is missing from the Baltic, North, and Black Seas, where it was previously caught in significant numbers (25).
No significant range changes were seen in albacore (Thunnus alalunga), yellowfin (Thunnus albacares), and bigeye tuna (Thunnus obesus) or swordfish (Xiphias gladius). According to available stock assessments, these species have also not declined in abundance as much as bluefin tuna (range: 54% decrease to 28% increase, as opposed to >70% decrease for bluefin species). Furthermore, they tend to spawn and produce larvae throughout the ocean, whereas bluefin tuna tend to spawn in a few well-known areas. This reproductive trait would make them more vulnerable to fisheries and may also lead to distinct subpopulations that could be extirpated by fisheries. For this reason, it has been suggested that a metapopulation model would be more appropriate for capturing the dynamics of bluefin populations (24). It is conceivable that the elimination of vulnerable subpopulations is one potential mechanism that explains observed range declines in bluefin species, which involved the loss of big parts of the formerly occupied range. A second potential mechanism involves density-dependent habitat selection, whereby changes in population density determine the probability of individuals migrating from the core habitat to less suitable habitats at the fringe of the distribution (26). This latter mechanism could explain dynamic changes in range size in response to changes in abundance and may drive observed expansions and contractions around the fringes of a species’ range. This is seen for example in skipjack tuna and sailfish (expansions), or white and black marlin (contractions).
At this point we cannot be certain as to the ultimate cause of the observed range changes. In principle they could be due to changes in ocean conditions, removal by fisheries, species interactions, or other factors. We note that the three bluefin species, which all have declined greatly in abundance over the last 30–50 y, displayed the strongest range contractions among the tunas. Unfortunately we could not access any appropriate abundance time-series for marlin. However, white and blue marlin, as well as sailfish in the Atlantic, are all assessed as overfished with further overfishing occurring, whereas swordfish stocks are considered within safe limits (27). White marlin and sailfish (but not blue marlin) also show significant range contractions in the Atlantic, whereas swordfish do not. These results are generally consistent with the hypothesis that overfishing is at least partly driving observed range contractions and that large changes in abundance can produce significant changes in the range size of pelagic predators. This mirrors results on land, where it has been established that even wide-ranging and highly mobile species will eventually show range loss when hunted to low levels (5).
The only region where range expansions were detected was the Eastern Pacific. This could be partly due to proactive management regimes under the auspices of the Inter-American Tropical Tuna Commission. Here, sailfish and skipjack tuna expanded considerably, whereas they declined in the Atlantic and Pacific (Fig. 2). It is noteworthy that these represent the smallest and most fast-growing species of the billfish and tuna included in this analysis, whereas larger species were either stable or declined. Species expansions occurred most notably in the Northeast Pacific, where a climate regime shift occurred between the 1960s and 1990s (28). This resulted in warmer average ocean conditions and changes in prey fields (29), which may have contributed to the observed range changes, particularly in warm-adapted species like skipjack tuna and sailfish (30). This apparent range expansion is especially pronounced in Pacific skipjack tuna, which now supports one of the largest fisheries in the world (31). Skipjack are known to respond strongly to climate fluctuations, by expanding their range further toward the Eastern Pacific during El Nino-driven warming events (32). The results presented here seem consistent with such a mechanism.
Increases both in number and range of smaller species could also be linked to partial release from predation or competition by larger species of tuna, billfish, and shark (33, 34). Ecosystem models for the tropical Pacific suggest that such top-down interactions could be a powerful influence on food web structure (34). Likewise there is empirical evidence to suggest a rise in smaller meso-predators following the decline of larger tuna (35), billfishes (1), and sharks (36). For example, by comparing historical and recent longlining surveys in the tropical Pacific, an increase in skipjack, among other small species, was observed at the same time as the decline of large sharks and tuna (35). Such fisheries-induced changes in the predator field can profoundly affect prey demographics and behavior and may cascade further down the food web (37).
More generally, it is well known that the decline of a predator can induce both abundance and distributional changes in a wide range of prey species, ranging from ungulates (38) to marine mammals, reptiles, and fishes (33). For large pelagic predators specifically, more research is needed to disentangle such top-down effects from bottom-up mechanisms, such as changes in ocean conditions or food supply. For example, Polovina (39) presented evidence for a partial range shift in Pacific bluefin tuna from the late 1970s onward, during which the abundance of juvenile bluefin increased in the Western and decreased in the Eastern Pacific. This was correlated with a climate-driven increase in prey availability in the Western Pacific. Similarly, Perry et al. (40) demonstrated northward range shifts across a diverse fish community in the North Sea that were thought to relate to changes in average temperature condition. It was not clear, however, whether total range sizes would be affected by these latitudinal shifts.
Range contractions in commercial fishes were reported previously on more local scales. A pelagic example is the endangered Monterey Spanish mackerel (Scomberomorus concolor), a commercially valuable species that extended north to Monterey, California in the 1880s but whose range is now reduced to the northern part of the Gulf of California (41, 42). Similarly, Brodie et al. (43) described a large range contraction for yellowtail flounder (Limanda ferruginea) from groundfish trawl survey data around Newfoundland. This was seen primarily as a function of low stock size, which resulted from increased fishing pressure in the mid- to late 1980s. They showed that the area occupied by this stock was positively correlated with its abundance as estimated from surveys but not with bottom temperatures from these same surveys. Similar changes were seen in a number of other heavily fished groundfish species at the same time (43) and suggest that the range–abundance pattern may be present in exploited groundfish as well as the pelagic species considered here.
In contrast to the above-cited groundfish example, our study is largely based on fisheries-dependent data and thus needs to be interpreted with more caution. Importantly, we are looking at the observed ranges as revealed by fishing. For some of the species under study this may cover only part of their total range. Changes in range can be detected reliably only in those cells that have sufficient effort; hence we limit our conclusions to those cells. One possible caveat is that these estimated range changes might be influenced by changes in targeting practices over time that affect the relative catchability of species (44). We have accounted for some of these changes in the longlining data, which have been depth-corrected according to ref. 45. However, other, more subtle changes might have occurred, such as changes in hook size, line material, and set time, among others. Although such changes would certainly have an effect on the relative abundance of species in the catch (44), we assume it unlikely to eliminate catch or bycatch of a species entirely, if that species still occurs regularly in the area. By limiting our interpretations to species presence or absence (given sufficient effort to detect a species), our results are less likely to be affected by such changes in catchability. One species for which doubts remain over data reliability is skipjack tuna. This small species features low catchability by longlines, which makes it less detectable in the Japanese data. Additionally, there were very large expansions of purse seine fishing for this species during the 1960s–1970s and onward, which could influence some (but probably not all) of the apparent range expansion in the Pacific. We also note that the most recent assessments indicate a decline in skipjack abundance, which might also influence its current range. Finally, there is the possibility that changes in reporting or in fishing regulations could influence the observed range. A recent closing of southern bluefin spawning grounds during the spawning season, for example, reduces the odds of detecting the species. We would like to emphasize the importance of ongoing fisheries-independent tagging and tracking studies to gain further insight into the total ranges of these species and how they might change over time.
In conclusion, our results suggest that tuna and billfish can show significant and large changes in their observed range, which may be correlated to changes in their abundance and distribution as driven by fishing, ocean conditions, and species interactions. Hence the double jeopardy of correlated abundance and range losses seems to apply not only on land but in the oceans as well. These results have implications for spatial management, because they imply that even wide-ranging, highly mobile species can be extirpated from parts of their range. Such local losses will change their availability to fisheries and effectively terminate the ecological role they once played in the affected regions.
Methods
We used three complementary data sources: Japanese global longlining catch and effort data (1960–1999), FAO catch data (1960–1999), and stock assessment-derived abundance data (1960–2007). Longlining and FAO data were available on a 5° × 5° grid, whereas assessment data were reported at the scale of ocean basins. Data sets were binned into decades to optimize seasonal and spatial coverage. To distinguish between true absences and false absences due to insufficient effort, and between true presences and false presences due to misidentification or stragglers, we set a threshold level for each species (n individuals per decade for Japanese data, n tons per decade for FAO data) below which presences were removed as spurious. Because thresholds selection (n = 0, 1, 2, 5, 10, 100 individuals or tons per decade) did not strongly influence the results, we report results from an intermediate threshold of n = 5 individuals or tons of catch per decade.
Japanese longlining data included information on both effort (number of hooks set) and catch (number of individuals) per species per cell per decade. To be sure that absences in cells where hooks had been set were not simply due to insufficient effort, we assumed that the number of species caught in a cell in the first decade d1 (1960s) followed a binomial distribution and calculated
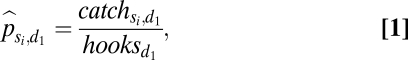 |
where  represents the maximum likelihood estimator of the catch probability per hook for species si in decade d1. We then applied the maximum likelihood estimate for catch probability per hook for each cell to the second decade d2 (1970s, 1980s, or 1990s) to estimate the probability of not detecting a species given the number of hooks set:
 |
Given the effort expended in d2, we required a 99% chance of detecting a species if it was present. This statistical method allows for spatially varying patterns of catch and effort (because each cell is treated independently) and different catch-to-effort relationships for individual species (because equations are calculated separately for each species).
Changes in abundance may also affect detection probabilities, because a smaller population has less chance of coming into contact with a hook. We corrected for this by assuming a 30%, 60%, and 90% decline in abundance across species between the 1960s and the 1970s, 1980s, and 1990s, respectively. This conservatively increased the amount of effort required to detect a range contraction (up to 10-fold in the 1990s compared with the 1960s). In addition, we applied a Bonferroni correction to allow for the fact that we were making comparisons between multiple cells. Hence we only retained a cell as a true absence if there was at least a 99% chance of detecting a species presence with a Bonferroni correction applied and assuming up to a 10-fold decline in abundance over the period of study. These three filters all render the detection of range contractions very conservative (more details are provided in SI Methods).
Supplementary Material
Acknowledgments
We thank D. Ricard and G. Britten for data extraction, and B. Block, S. Harley, C. Minto, C. Muir, and F. Palstra for valuable comments. This study was supported by the Lenfest Ocean Program and the Sloan Foundation (Census of Marine Life, Future of Marine Animal Populations Program), as well as the Natural Sciences and Engineering Research Council of Canada.
Footnotes
The authors declare no conflict of interest.
*This Direct Submission article had a prearranged editor.
See Commentary on page 11735.
This article contains supporting information online at www.pnas.org/lookup/suppl/doi:10.1073/pnas.1102353108/-/DCSupplemental.
References
- 1.Myers RA, Worm B. Rapid worldwide depletion of predatory fish communities. Nature. 2003;423:280–283. doi: 10.1038/nature01610. [DOI] [PubMed] [Google Scholar]
- 2.Sibert J, Hampton J, Kleiber P, Maunder M. Biomass, size, and trophic status of top predators in the Pacific Ocean. Science. 2006;314:1773–1776. doi: 10.1126/science.1135347. [DOI] [PubMed] [Google Scholar]
- 3.Ferretti F, Worm B, Britten GL, Heithaus MR, Lotze HK. Patterns and ecosystem consequences of shark declines in the ocean. Ecol Lett. 2010;13:1055–1071. doi: 10.1111/j.1461-0248.2010.01489.x. [DOI] [PubMed] [Google Scholar]
- 4.Brown JH, Stevens GC, Kaufman DM. The geographic range: Size, shape, boundaries, and internal structure. Annu Rev Ecol Syst. 1996;27:597–623. [Google Scholar]
- 5.Laliberte AS, Ripple WJ. Range contractions of North American carnivores and ungulates. Bioscience. 2004;54:123–138. [Google Scholar]
- 6.Ceballos G, Ehrlich PR. Mammal population losses and the extinction crisis. Science. 2002;296:904–907. doi: 10.1126/science.1069349. [DOI] [PubMed] [Google Scholar]
- 7.McClenachan L, Cooper AB. Extinction rate, historical population structure and ecological role of the Caribbean monk seal. Proc Biol Sci. 2008;275:1351–1358. doi: 10.1098/rspb.2007.1757. [DOI] [PMC free article] [PubMed] [Google Scholar]
- 8.Rugh DJ, Shelden KEW, Hobbs RC. Range contraction in a beluga whale population. Endanger Species Res. 2010;12:69–75. [Google Scholar]
- 9.Estes JA, Palmisano JF. Sea otters: Their role in structuring nearshore communities. Science. 1974;185:1058–1060. doi: 10.1126/science.185.4156.1058. [DOI] [PubMed] [Google Scholar]
- 10.McLaren BE, Peterson RO. Wolves, moose, and tree rings on isle royale. Science. 1994;266:1555–1558. doi: 10.1126/science.266.5190.1555. [DOI] [PubMed] [Google Scholar]
- 11.Lawton JH. Range, population abundance and conservation. Trends Ecol Evol. 1993;8:409–413. doi: 10.1016/0169-5347(93)90043-O. [DOI] [PubMed] [Google Scholar]
- 12.Brown JH. On the relationship between abundance and distribution of species. Am Nat. 1984;124:255–279. [Google Scholar]
- 13.Lawton JH, editor. Population Dynamic Principles. New York: Oxford Univ Press; 1995. [Google Scholar]
- 14.Hubbell SP. The Unified Neutral Theory of Biodiversity and Biogeography. Princeton: Princeton Univ Press; 2001. [DOI] [PubMed] [Google Scholar]
- 15.Wilson RJ, Thomas CD, Fox R, Roy DB, Kunin WE. Spatial patterns in species distributions reveal biodiversity change. Nature. 2004;432:393–396. doi: 10.1038/nature03031. [DOI] [PubMed] [Google Scholar]
- 16.Worm B, et al. Rebuilding global fisheries. Science. 2009;325:578–585. doi: 10.1126/science.1173146. [DOI] [PubMed] [Google Scholar]
- 17.Beverton RJH, Holt SJ. On the dynamics of exploited fish populations. Fish Invest Minist Agric Fish Food G B (2 Sea Fish) 1957;19:1–533. [Google Scholar]
- 18.Grafton RQ, Kompas T, Hilborn RW. Economics of overexploitation revisited. Science. 2007;318:1601. doi: 10.1126/science.1146017. [DOI] [PubMed] [Google Scholar]
- 19.Block BA, et al. Electronic tagging and population structure of Atlantic bluefin tuna. Nature. 2005;434:1121–1127. doi: 10.1038/nature03463. [DOI] [PubMed] [Google Scholar]
- 20.Bonfil R, et al. Transoceanic migration, spatial dynamics, and population linkages of white sharks. Science. 2005;310:100–103. doi: 10.1126/science.1114898. [DOI] [PubMed] [Google Scholar]
- 21.Worm B, Sandow M, Oschlies A, Lotze HK, Myers RA. Global patterns of predator diversity in the open oceans. Science. 2005;309:1365–1369. doi: 10.1126/science.1113399. [DOI] [PubMed] [Google Scholar]
- 22.Jennings S, Blanchard JL. Fish abundance with no fishing: Predictions based on macroecological theory. J Anim Ecol. 2004;73:632–642. [Google Scholar]
- 23.Tittensor DP, Worm B, Myers RA. Macroecological changes in exploited marine systems. In: Witman JD, Roy K, editors. Marine Macroecology. Chicago: Univ of Chicago Press; 2009. [Google Scholar]
- 24.Fromentin J-M, Powers JE. Atlantic bluefin tuna: Population dynamics, ecology, fisheries and management. Fish Fish. 2005;6:281–306. [Google Scholar]
- 25.MacKenzie BR, Myers RA. The development of the northern European fishery for north Atlantic bluefin tuna Thunnus thynnus during 1900-1950. Fish Res. 2007;87:229–239. [Google Scholar]
- 26.MacCall AD. Dynamic Biogeography of Marine Fish Populations. Seattle: Univ of Washington Press; 1990. [Google Scholar]
- 27.NMFS . Stock Assessment and Fishery Evaluation (SAFE) Report for Atlantic Highly Migratory Species 2010. Silver Spring, MD: National Marine Fisheries Service, Highly Migratory Species Management Division; 2010. [Google Scholar]
- 28.Hare SR, Mantua NJ. Empirical evidence for North Pacific regime shifts in 1977 and 1989. Prog Oceanogr. 2000;47:103–145. [Google Scholar]
- 29.Chavez FP, Ryan J, Lluch-Cota SE, Niquen C M. From anchovies to sardines and back: Multidecadal change in the Pacific Ocean. Science. 2003;299:217–221. doi: 10.1126/science.1075880. [DOI] [PubMed] [Google Scholar]
- 30.Boyce D, Tittensor DP, Worm B. Effects of temperature on global patterns of tuna and billfish richness. Mar Ecol Prog Ser. 2008;355:267–276. [Google Scholar]
- 31.FAO . The State of World Fisheries and Aquaculture 2008. Rome: United Nations Food and Agriculture Organization; 2009. p. 176. [Google Scholar]
- 32.Lehodey P, Bertignac M, Hampton J, Lewis A, Picaut J. El Niño Southern Oscillation and tuna in the western Pacific. Nature. 1997;389:715–718. [Google Scholar]
- 33.Heithaus MR, Frid A, Wirsing AJ, Worm B. Predicting ecological consequences of marine top predator declines. Trends Ecol Evol. 2008;23:202–210. doi: 10.1016/j.tree.2008.01.003. [DOI] [PubMed] [Google Scholar]
- 34.Cox SP, et al. Reconstructing ecosystem dynamics in the central Pacific Ocean, 1952–1998. II. A preliminary assessment of the trophic impacts of fishing and effects on tuna dynamics. Can J Fish Aquat Sci. 2002;59:1736–1747. [Google Scholar]
- 35.Ward P, Myers RA. Shifts in open-ocean fish communities coinciding with the commencement of commercial fishing. Ecology. 2005;86:835–847. [Google Scholar]
- 36.Myers RA, Baum JK, Shepherd TD, Powers SP, Peterson CH. Cascading effects of the loss of apex predatory sharks from a coastal ocean. Science. 2007;315:1846–1850. doi: 10.1126/science.1138657. [DOI] [PubMed] [Google Scholar]
- 37.Baum JK, Worm B. Cascading top-down effects of changing oceanic predator abundances. J Anim Ecol. 2009;78:699–714. doi: 10.1111/j.1365-2656.2009.01531.x. [DOI] [PubMed] [Google Scholar]
- 38.Ripple WJ, Beschta RL. Restoring Yellowstone's aspen with wolves. Biol Conserv. 2007;138:514–519. [Google Scholar]
- 39.Polovina J. Decadal variation in the trans-Pacific migration of northern bluefin tuna (Thunnus thynnus) coherent with climate-induced change in prey abundance. Fish Oceanogr. 1996;5:114–119. [Google Scholar]
- 40.Perry AL, Low PJ, Ellis JR, Reynolds JD. Climate change and distribution shifts in marine fishes. Science. 2005;308:1912–1915. doi: 10.1126/science.1111322. [DOI] [PubMed] [Google Scholar]
- 41.Collette BB, Russo JL. Morphology, systematics, and biology of the Spanish mackerels (Scomberomorus, Scombridae) Fish Bull. 1984;81:545–692. [Google Scholar]
- 42.International Union for the Conservation of Nature. IUCN Red List of Threatened Species. Version 2010.4. Gland, Switzerland: International Union for the Conservation of Nature; 2010. [Google Scholar]
- 43.Brodie WB, Walsh SJ, Atkinson DB. The effect of stock abundance on range contraction of yellowtail flounder (Pleuronectes ferruginea) on the Grand Bank of Newfoundland in the Northwest Atlantic from 1975 to 1995. J Sea Res. 1998;39:139–152. [Google Scholar]
- 44.Maunder MN, et al. Interpreting catch per unit effort data the status of individual stocks and communities. ICES J Mar Sci. 2006;63:1373–1385. [Google Scholar]
- 45.Ward P, Myers RA. Inferring the depth distribution of catchability for pelagic fishes and correcting for variations in the depth of longline fishing gear. Can J Fish Aquat Sci. 2005;62:1130–1142. [Google Scholar]
Associated Data
This section collects any data citations, data availability statements, or supplementary materials included in this article.