

Abstract
Macromolecular crowding in biological media is an essential factor for cellular function. The interplay of intermolecular interactions at multiple time and length scales governs a fine-tuned system of reaction and transport processes, including particularly protein diffusion as a limiting or driving factor. Using quasielastic neutron backscattering, we probe the protein self-diffusion in crowded aqueous solutions of bovine serum albumin on nanosecond time and nanometer length scales employing the same protein as crowding agent. The measured diffusion coefficient D(φ) strongly decreases with increasing protein volume fraction φ explored within 7% ≤ φ ≤ 30%. With an ellipsoidal protein model and an analytical framework involving colloid diffusion theory, we separate the rotational Dr(φ) and translational Dt(φ) contributions to D(φ). The resulting Dt(φ) is described by short-time self-diffusion of effective spheres. Protein self-diffusion at biological volume fractions is found to be slowed down to 20% of the dilute limit solely due to hydrodynamic interactions.
Keywords: macromolecular crowding, quasi-elastic neutron scattering, globular proteins
The interior of biological cells is a medium with a macromolecular volume fraction of up to 40%. This crowding crucially affects reaction kinetics and equilibria in the cell (1, 2). Cellular function and structure thus cannot be understood without a systematic understanding of both phase behavior and transport processes in crowded media. Diffusion is the main transport process for systems at low Reynolds numbers, governing many dynamic processes in nature (3). From the perspective of a single tracer molecule, all other molecules act as obstacles. In vivo diffusion coefficients for globular proteins in living cells (4–7) are strongly decreased compared to the in vitro diffusion coefficient in dilute buffer solutions. Systematic measurements of the tracer diffusion of proteins dissolved in concentrated suspensions of crowding agents, i.e., other proteins or polymers, reveal a complex dependence of the slowing down on the combination of tracer molecule and crowding agent (8–10). Furthermore, macromolecular crowding is found to induce subdiffusive behavior in several cases (11, 12), being suggested as a slower but more reliable diffusive search process inside the cell (13). This anomalous diffusion process has been found also in theory and simulations (12–15) suggesting a crossover from subdiffusive behavior at small times to diffusive behavior at larger times.
Proteins are macromolecules generally with a nonspherical shape and a nonhomogeneous surface charge, showing specific interactions with ligands. Furthermore, proteins not only show global motions like translational and rotational diffusion but also internal and interdomain motions. Therefore, proteins pose a challenge to colloid theory (16, 17). In a recent simulation study Ando and Skolnick (4) revealed that using an equivalent-sphere model for macromolecules is a reasonable approximation to describe diffusion. Moreover, the authors demonstrated that interactions between the molecules, including both hydrodynamic interactions mediated by the solvent and direct interactions due to hard-sphere and Coulomb potentials crucially affect diffusion in a crowded environment. Consequently, it is of fundamental interest to test the applicability of colloid models to protein diffusion in crowded solutions.
The dynamics of a colloidal suspension is characterized by different time scales, corresponding to different regimes of motion (18). The solvent time scale τs is in general much shorter than the diffusive time scale of the dissolved particles τB ≈ m/(6πηR) on which the motion changes from ballistic to diffusive motion. In this diffusive regime and for noninteracting particles with radius R and mass m in a solvent with viscosity η the well known Stokes-Einstein diffusion constant Dt(0) = kBT/(6πηR) is recovered. In real systems and at finite concentrations, interparticle interactions give rise to additional relevant time scales. Hydrodynamic interactions arise on the time scale τH ≈ R2ρ/(ηφ)≫τB with the solvent density ρ, and the colloidal volume fraction φ, affecting the so-called short-time diffusive regime τH ≪ t ≪ τI. The structural relaxation time τI ≈ R2/Dt(0) defines the onset of caging effects on the particle center-of-mass diffusion due to direct interparticle interactions. For t≫τI long-time self-diffusion is observed, affected by both hydrodynamic and direct interactions. For the short-time and long-time regimes, series expansions have been derived for the self-diffusion of spherical colloids with and without charge (18–22).
In this study we report on extensive experimental data on protein self-diffusion in crowded aqueous solutions of bovine serum albumin (BSA) as determined from quasielastic neutron backscattering on nanosecond time and nanometer length scales. Thereby, we investigate the fundamental case where tracer particle and crowding agent are identical proteins. Quasielastic neutron scattering accesses both microscopic spatial and time correlations by measuring the van Hove scattering function S(Q,ω) (23).
Due to the large incoherent scattering length of hydrogen, neutron backscattering of biological samples directly probes self-correlations of the hydrogen atoms. Moreover, neutron scattering is the only noninvasive and nondestructive technique to access protein solution samples at high protein concentrations. In an incoherent measurement of a highly concentrated solution, all molecules can be conceived as unlabeled and simultaneously play the role of both tracer molecule and crowding agent.
Recent neutron scattering work studied protein dynamics in solutions, thereby mainly addressing the hydration and temperature dependence of internal motions (24–29). Few studies, however, investigated protein short-time diffusion (30–33) or long-time diffusion (34–36).
Here, we present detailed results on the dependence of protein short-time self-diffusion on protein concentration. We obtain the translational diffusion coefficient Dt(φ) at different protein volume fractions φ and discuss the results in comparison with colloidal suspension models, thereby testing the applicability of colloid approximations.
Results
Effective Hard-Sphere Model.
Proteins differ considerably from hard spheres for which theoretical predictions for colloidal diffusion are available. A sensible comparison of experiment and theoretical predictions requires a mapping of the protein on an effective sphere (37). Simulations of proteins in a crowded environment showed that effects of the shape on the diffusion can be accounted for using effective spheres (4).
The simplest choice for an effective radius would be the radius of a sphere with the same volume as the bare protein volume calculated from the specific volume (see Materials and Methods), in our case R ≈ 2.68 nm.
In the case of diffusion, however, the resulting effective radius has to be larger than R for the following reasons: First, the hydration shell surrounding the protein increases the size of the proteins. Second, the anisotropic shape of the protein described by the Perrin factors (37, 38) additionally increases the effective radius.
In order to determine the effect of the anisotropy and the hydration shell on the effective radius, we performed small-angle X-ray scattering (SAXS) on dilute aqueous BSA solutions, comprising the following samples: 0.15 M NaCl (1, 2, 5, 10 mg/mL BSA), 0.01 M Hepes buffer with 0.4 M NaCl (1, 2, 10 mg/mL BSA) and 0.15 M Hepes buffer (5, 10 mg/mL BSA). Fig. 1 shows an example dataset of 5 mg/mL BSA in 0.15 M Hepes buffer. Using an oblate ellipsoid the form factor of all SAXS data was modeled (see Materials and Methods and ref. 39). Averaging the results, we finally obtain an oblate ellipsoid with polar semiaxis a ≈ 1.8 ± 0.05 nm and equatorial semiaxis b ≈ 4.6 ± 0.15 nm. Note that the fit result includes the hydration shell because the higher mass density of hydration shell water causes a scattering contrast (40).
Fig. 1.

SAXS intensity for a dilute solution of BSA (5 mg/mL, room temperature) in 150 mM Hepes buffer after subtraction of background contributions. The data (circle) can be fitted with the form factor of an oblate ellipsoid (solid line). The deviation at higher Q is caused from the deviation of the protein shape from an ellipsoid at smaller length scales. The fitting of scattering data from several solutions with protein concentration below 10 mg/mL and varying concentration of Hepes buffer and NaCl is consistent with an oblate ellipsoid with polar semiaxis a ≈ 1.8 ± 0.05 nm and equatorial semiaxes b ≈ 4.6 ± 0.15 nm. This protein model of an oblate ellipsoid (inset lower left corner) is used as input for the further data analysis based on colloid theory.
Based on this ellipsoidal protein model, we calculate the effective hydrodynamic radii for translational diffusion, Rh = 3.62 nm which defines the translational diffusion coefficient in the dilute limit (see Materials and Methods). Note the good consistency of the effective radius Rh with the hydrodynamic radius  calculated from results from dynamic light scattering (41).
For theoretical predictions, the volume fraction of the effective spheres is of central importance. This effective volume fraction is connected to the physical protein volume fraction φ by
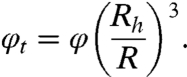 |
[1] |
To compare the measured translational diffusion coefficient with the theoretical prediction of a colloidal model we use the effective volume fraction
| [2] |
in which f is the theoretical reduced translational diffusion coefficient and Dt(0) the dilute limit translational diffusion coefficient.
Quasielastic Spectra and Simple Diffusion Coefficient.
We performed a series of quasielastic neutron backscattering measurements covering the full range of protein volume fraction φ from 5 to 30% using the instruments IN10 and IN16 at the Institut Laue-Langevin (ILL). The inset of Fig. 2 depicts a typical spectrum S(Q,ω) recorded on IN16. All spectra can be fitted according to the model (24, 25, 30, 32)
| [3] |
Therein,  denotes the instrumental resolution function, β1,2 are scalars, B is a flat background accounting for the water diffusion which is beyond the accessible dynamic range of both instruments, and δ(ω) designates the Dirac function of the elastic scattering. The width of the two Lorentzians
  and
and  represent the time scales of two separated spectral components: while the broader width Γ accounts for fast internal and interdomain motions within the protein, γ is attributed to the convolution of the translational and rotational diffusion of the entire protein (24, 25, 30, 32). The widths γ as obtained from the fits Eq. 3 are plotted in Fig. 2. For Q2 < 1.5 Å-2, a clear relationship γ = DQ2 is observed, defining the diffusion coefficient D. This clear relationship is observed for all samples in the full volume fraction range and is consistent with simple diffusion on the accessible time and length scales. Superdiffusive jump-diffusion or subdiffusion due to crowding would cause a varying local slope corresponding to the changing diffusion coefficient for different time and length scales, i.e., with scattering vector Q. For Q2 > 1.5 Å-2 the scattering signal from the proteins becomes weaker and considerably broadened with respect to the accessible energy range. These two factors can cause fitting artifacts, we neglected these data points for the fitting of the diffusion coefficient, although the Q2 relationship seems conserved.
Fig. 2.

Inset: Example backscattering spectrum S(Q,ω) (symbols) recorded at IN16 for BSA in D2O (c = 500 mg/mL, φ = 28.5%, T = 300 K, individual detector at Q = 0.81 Å-1). The magenta solid line is the fit of the model from Eq. 3. The two Lorentzians in Eq. 3 are indicated by the dashed and dash-dotted lines. The orange solid line denotes the resolution function. Main figure: Fitted γ (symbols) vs. Q2 for the full Q-range of the example data. The fit of γ = D Q2 (blue line) is consistent with simple diffusive behavior. For statistical reasons the fit range is restricted to Q2 < 1.5 Å-2.
Separation of Translational and Rotational Diffusion.
Fig. 3 shows the resulting diffusion coefficients D(φ) (upper points). The extrapolation D(φ → 0) using a polynomial fit (upper blue line) reveals a higher dilute limit compared to the value in D2O at T = 280 K, Dt(0) = (3.01 ± 0.04) A2/ns, calculated from dynamic light scattering results (41, 42). This deviation indicates a nonnegligible contribution of the rotational diffusion to D. We thus have to separate the measured D into the translational and rotational contributions. Perez et al. showed numerically that the rotational contribution causes an additional line broadening (24), assuming spherical particles in the dilute limit. Inspired by this analysis, we develop an analytical method to extract Dt from D also for high concentrations (see Appendix for a detailed derivation). The calculated scattering function St+r(Q,ω) for rotational and translational diffusion can be approximated by a single Lorentzian line shape with half width at half-maximum (HWHM) γ and amplitude α in the Q-range relevant for our experiment.
Fig. 3.

Measured diffusion coefficients D for BSA solutions in D2O at T = 280 K (blue circles on upper curve) and translational diffusion coefficients Dt (purple circles on lower curve) computed from D using Eq. 4 and the theoretical rotational diffusion coefficient from ref. 19. The lines are polynomial fits. The dilute limit Dt(0) (diamond symbol) is calculated from results of dynamic light scattering (41). The noncoincidence of Dt(0) and the fit to D indicates a significant rotational contribution. After separation of the rotational contribution, the translational diffusion coefficient Dt is in accordance with the dilute limit, supporting the validity of our approach.
We recover γ = DQ2 for this approximation in the measured Q-range, defining the diffusion coefficient D (24). By minimizing the  -norm
-norm  we obtain
 |
[4] |
We assume that Dr can be approximated by the short-time rotational diffusion for charged spheres Dr(φ) = Dr(0)(1 - 1.3φ2) (19) with the dilute limit Dr(0) from Eq. 9. Using Eq. 4, we evaluate Dt(φ). Importantly, this extraction is robust, because other models for short-time rotational diffusion do not change Dt(φ) significantly.
Protein Self-Diffusion in Crowded Media.
The resulting reduced diffusion Dt(φ)/Dt(0) is displayed for different temperatures in Fig. 4, showing a strong decrease of the translational diffusion coefficient due to macromolecular crowding on nanosecond time scales. At volume fractions φ ≈ 25% as present in living cells, the translational diffusion is decreased to 20% of the dilute-limit value, implying a slowing down of diffusion-driven transport and diffusion-limited reactions. Interestingly, the reduced diffusion seems to obey a temperature-independent master-curve.
Fig. 4.

Normalized translational self-diffusion coefficients (Fig. 3) Dt/Dt(0) (circles) for two different temperatures (red and purple circles denote 280 and 300 K, respectively) after separation of the rotational contributions. The purple line superimposed on the data is a guide to the eye obtained from a polynomial fit indicating the temperature-independent master-curve. The upper and lower dashed purple lines indicate the upper and lower 96% prediction bounds, respectively. The blue lines denotes the colloidal short-time self-diffusion for hard spheres (light blue, solid) and charged spheres (dark blue, dashed). The inset in the upper right corner illustrates the flow field (light blue stream line plot) generated by the movement of three spheres (velocities are denoted by blue arrows) and therefore experiencing a hydrodynamic forces (pink arrows).
The experimental Dt(φ)/Dt(0) agree almost perfectly with the normalized short-time self-diffusion coefficient predicted by colloid theory for charged (19) and noncharged hard spheres (22) (Fig. 4). Both predictions take into account only hydrodynamic interactions, which depend on the equilibrium structure of the solution and thus differ between charge-stabilized and hard-sphere suspensions (19). Reconsidering the simplistic nature of the model system of effective hard spheres for the complex soft protein, this excellent agreement is not expected.
Discussion
Colloid Picture of Protein Self-Diffusion in Crowded Media.
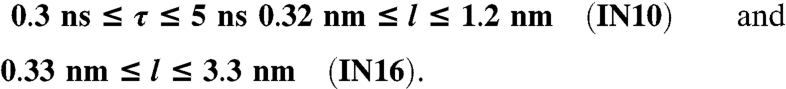
We identify the measured self-diffusion coefficient with short-time self-diffusion. This interpretation is consistent with theoretical expectations: the accessible time scales of the neutron spectrometer,
| [5] |
are in the short-time regime for self-diffusion of BSA in D2O, because
 |
[6] |
Short-time self-diffusion implies that the observed slow-down of the protein diffusion is mainly caused by hydrodynamic interactions.
Reduction Factor and Influence of Hydrodynamic Interactions.
Experimental results on the in vivo reduction factor of protein diffusion in a cellular medium compared to buffer solutions show a dependence on the protein size. The reported values corresponding to BSA-sized molecules range from 1/70 (5) to approximately 0.2 (6, 7). Measurement in crowded in vitro solutions of proteins obtained a reduction factor of approximately 0.08 for albumin tracers at 25% volume fraction of the crowding agent (10) and a factor of 0.35 for BSA tracers at 13% volume fraction of BSA (9). All these results have been obtained using fluorescence-labeling techniques at the μs time scale and are generally rationalized by an effectively increased viscosity, hindrance due to obstacles, and transient adsorption at larger obstacles (8). The reduction factors found in the present study of 0.2 at 25% and 0.4 at 13% occur already at nanoseconds and are attributed solely to hydrodynamic interactions, i.e., an increased effective viscosity of the cellular medium, but not to hindrance due to obstacles. The obtained short-time self-diffusion values are of similar order of magnitude as the long-time values obtained from fluorescence-labeling techniques, implying an important and nonnegligible role of hydrodynamics to the observed crowding effect. Protein dynamics and, in particular, protein diffusion in a crowded environment thus cannot be understood simply by excluded volume and confined motions, but has to include hydrodynamic interactions.
These experimental findings are in perfect accordance with recent results from simulations (4). Ando and Skolnick found that the effect of macromolecular crowding on protein diffusion can be explained solely with hydrodynamic interactions and excluded volume, supporting the mentioned colloid picture of macromolecular crowding. The authors’ findings for the reduced short-time self-diffusion coefficient fit to our data quantitatively.
For concentrated solutions of hemoglobin, the crowding effect on the diffusion has been also investigated with quasi elastic neutron scattering using neutron spin-echo spectroscopy, obtaining a reduction factor around 0.2 at 22% volume fraction (35). Although the behavior seems qualitatively and quantitatively similar, the comparison to our data, however, fails for two reasons. First, the accessed time scales are around 50 ns and comparable to the colloidal interaction time scale, implying significant long-time effects of direct interactions on the diffusive motion. Second, neutron spin-echo is a coherent scattering technique, thus probing collective diffusion. In the short-time limit and at large Q, collective diffusion equals self-diffusion. This equality does not strictly hold for the case of long-time diffusion, disallowing a consideration of the measured diffusion as self-diffusion. Thus, while their data probe collective diffusion with long-time effects, our data corresponds undoubtedly to short-time self-diffusion.
Essential Role of Anisotropy in the Protein Modeling.
Proteins are nonspherical molecules. In order to account for this anisotropy, colloid models have to be refined. In our modeling approach, the protein is mapped on an oblate ellipsoid that incorporates the full anisotropy and governs the dilute limit rotational and translational diffusion coefficients of the protein through the Perrin factors. It is important to notice that rotational and translational diffusion are affected differently by anisotropy and that this difference in the effective radii matters.
It should be noted that other macromolecular properties and processes could modify the diffusion but seem to be less important or cancel out in our system. Water-permeability of the protein core results in a larger Dt(φ)/Dt(0) (43). The effect of a gradually changing hydration shell, the flexibility of the protein, the hydrophobicity, and nonhomogeneous charge distribution have not been systematically studied to our knowledge. Furthermore, in attractive systems below the solubility limit, oligomerization and transient clustering could decrease the diffusion coefficient. Crowding is known to induce compaction of protein structures (1, 44). A decrease in the radius of gyration of smaller than 0.4% has been found when comparing a globular protein structure in dilute and crowded (φ = 0.25) protein solutions (44). The related change of Rh under crowding conditions is not discernible with our method within the experimental errors and thus does not affect our conclusions.
Conclusions
We studied the effect of crowding on the self-diffusion of BSA by means of quasielastic neutron backscattering. Our analysis confirms that crowding has a very substantial effect on the protein self-diffusion already at the nanoseconds time scale. Moreover, we reveal that the diffusion coefficient at biological volume fractions is strongly decreased compared to the dilute limit. This finding is described with very good accuracy in terms of colloidal short-time self-diffusion, outlining the important role of hydrodynamic interactions on crowding behavior. We conclude that general features of protein diffusion can be understood in terms of existing colloidal hard-sphere models if anisotropy is considered using reasonable protein modeling. The modeling approach used in this study is based on an experimentally established protein shape model without adjustable parameters, i.e., an oblate ellipsoid from the fitting of SAXS data. The analysis of the protein diffusion including the separation of rotational and translational contributions is performed for effective spheres with existing predictions from colloid theory. The success of this simple mapping of the complex protein on an effective sphere is promising for further investigations.
Materials and Methods
Sample Preparation.
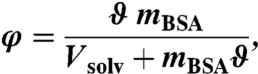
BSA was purchased from Sigma-Aldrich with an indicated purity of 99% and used without further purification. The samples were prepared by dissolving BSA powder with mass mBSA in the solvent with volume Vsolv. For neutron scattering we used pure D2O as solvent; for SAXS we used a H2O-based solution with 150 mM Hepes buffer as solvent. Correcting for the protein volume, we obtain the volume fraction occupied by the bare proteins
 |
[7] |
where ϑ = 0.735 mL/g is the specific volume of BSA (45). The prepared φ cover a range of 7–30%. After complete dissolution and equilibration the solutions were filled in double-walled aluminum cylinders (23 mm outer diameter, 0.3 mm gap), which were sealed against vacuum and kept at T = 280 and 300 K, respectively, for the measurements. The pH values of the samples were checked to be neutral over the full concentration range. No precise data on oligomerization are available for high volume fractions. However, the samples show no visible aggregation or precipitation on time scales of months; monomeric aqueous BSA solutions are charge-stabilized and have been shown to be thermodynamically stable (39, 46).
Quasielastic Neutron Backscattering.
We used the backscattering spectrometers IN10 and IN16 at the Institut Laue-Langevin in Grenoble, France, in the standard configuration with unpolished Si(111)-monochromator and analyzer crystals, which set the selected neutron wavelength to 6.27 Å and achieve an energy resolution of approximately 0.9 μeV (gaussian FWHM). The energy range accessible by Doppler-shifting the incident wavelength on both instruments defines the accessible time scales τ = 2πℏ/E, the Q-ranges set the probed length scales l = 2π/Q:
 |
The raw data were normalized to the incident neutron flux and relative detector efficiency. The scattering signal of an empty cylinder was subtracted to correct for background contributions. Water background was not removed but included in the data fitting as flat background.
SAXS.
The SAXS data were measured at ID02 at the European Synchrotron Radiation Facility (ESRF), Grenoble, France. For a detailed description of the data treatment we refer to refs. 17, 39. In general, SAXS measures the product of structure factor S(Q) and form factor P(Q), I(Q) ∝ P(Q)S(Q). Due to the low protein concentration of 5 mg/mL and strong charge-screening of the added buffer, protein–protein interactions can be neglected, i.e., S(Q) ≡ 1. The data can be simply fitted by the formula I(Q) = nΔρ2P(Q) with the number density n, the scattering contrast Δρ2, and the form factor P(Q) on an oblate ellipsoid.
Perrin Factors for Ellipsoids of Revolution and Effective Hydrodynamic Radii.
For an ellipsoid of revolution with polar semiaxis a and equatorial semiaxes b, the Perrin factors specify the translational and rotational diffusion coefficient in the dilute limit:
 |
[8] |
 |
[9] |
where p = b/a is the ellipsoid aspect ratio. Moreover, we can extract the effective hydrodynamic radius Rh = aA(p)-1. A(p) and B(p) result from the angular average of translational and rotational friction factors (38):
 |
For the present case of an oblate ellipsoid with a = 1.8 nm and b = 4.6 nm, we obtain p = 2.56 and thus A(p)-1 = 2.01 and B(p)-1/3 = 2.09.
Appendix
Implicit Relation Between Rotational, Translational, and Fitted Diffusion Coefficient (Eq. 4).
The scattering function of a particle performing rotational and translational diffusion reads (24)
 |
[10] |
with
 |
[11] |
and
| [12] |
where Dr and Dt denote the rotational and translational diffusion coefficients, respectively. The rotational dynamic structure factors are entirely determined by the radial density distribution of the hydrogen atoms in the molecule, ρ(r). jl(x) is the lth-order spherical Bessel function of first kind.
It was found (24, 25) and reproduced in our study that a single Lorentzian line shape with HWHM γ and amplitude α approximates the calculated scattering function St+r(Q,ω) for rotational and translational diffusion inside error bars in the Q-range relevant for our experiment. The minimization of the  -norm
-norm
 |
[13] |
reduces to two nonlinear equations:
 |
[14] |
 |
[15] |
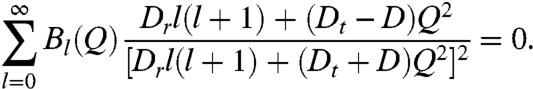
Inserting Eq. 12 and the Q-dependent diffusion coefficient d(Q) = γ(Q)/Q2 into Eq. 15, an implicit relation of the three involved diffusion coefficients d(Q), Dr, and Dt is derived:
 |
[16] |
For given Dt and Dr, which are Q-independent, the Q-dependence of d(Q) can be discussed. For Q = 0, we obtain Bl = δl,0 which renders the implicit Eqs. 14, 15 explicitly solvable yielding Γ = DtQ2 and α = 1, i.e., d(0) = Dt. For finite Q, d(Q) monotonously increases with Q and converges rapidly to a constant value. By the limit
 |
[17] |
we define the observable diffusion coefficient D. The rapid convergence of d(Q) restates the simple diffusive relation γ(Q) = DQ2 as observed in the accessible Q-range, as found already numerically (24, 25). Rotational diffusion thus acts as an additional contribution not distinguishable from translational diffusion without careful modeling and approximations.
Inserting d(Q) = D into Eq. 16 finally returns the implicit relation Eq. 4 connecting the three diffusion coefficients D, Dr, and Dt. For a given pair of two diffusion coefficients, the third can thus be calculated by solving Eq. 4. This calculation is performed numerically for a truncated sum. The truncation is dependent on the Q range and generally valid because Bl(Q) rapidly decays to zero at finite Q for increasing l (24). For our Q range, we use nmax = 250.
Acknowledgments.
The authors benefitted from discussions with E. Reister (Stuttgart, Germany), G. Zaccai, D. Bicout, E. Kats (ILL, Grenoble, France), and G. Nägele (FZ Jülich, Germany). We thank the ILL and ESRF for the allocation of beamtime. Moreover, F. Roosen-Runge and M. Hennig acknowledge financial support from the ILL, through studentship grants.
Footnotes
The authors declare no conflict of interest.
This article is a PNAS Direct Submission.
References
- 1.Ellis RJ. Macromolecular crowding: an important but neglected aspect of the intracellular environment. Curr Opin Struct Biol. 2001;11:114–119. doi: 10.1016/s0959-440x(00)00172-x. [DOI] [PubMed] [Google Scholar]
- 2.Zimmerman SB, Minton AP. Macromolecular crowding: biochemical, biophysical, and physiological consequences. Annu Rev Biophys Biomol Struct. 1993;22:27–65. doi: 10.1146/annurev.bb.22.060193.000331. [DOI] [PubMed] [Google Scholar]
- 3.Purcell EM. Life at low Reynolds number. Am J Phys. 1977;45:3–11. [Google Scholar]
- 4.Ando T, Skolnick J. Crowding and hydrodynamic interactions likely dominate in vivo macromolecular motion. Proc Natl Acad Sci USA. 2010;107:18457–18462. doi: 10.1073/pnas.1011354107. [DOI] [PMC free article] [PubMed] [Google Scholar]
- 5.Wojcieszyn JW, Schlegel RA, Wu ES, Jacobson KA. Diffusion of injected macromolecules within the cytoplasm of living cells. Proc Natl Acad Sci USA. 1981;78:4407–4410. doi: 10.1073/pnas.78.7.4407. [DOI] [PMC free article] [PubMed] [Google Scholar]
- 6.Arrio-Dupont M, Foucault G, Vacher M, Devaux PF, Cribier S. Translational diffusion of globular proteins in the cytoplasm of cultured muscle cells. Biophys J. 2000;78:901–907. doi: 10.1016/S0006-3495(00)76647-1. [DOI] [PMC free article] [PubMed] [Google Scholar]
- 7.Verkman AS. Solute and macromolecule diffusion in cellular aqueous compartments. Trends Biochem Sci. 2002;27:27–33. doi: 10.1016/s0968-0004(01)02003-5. [DOI] [PubMed] [Google Scholar]
- 8.Wang Y, Li C, Pielak GJ. Effects of proteins on protein diffusion. J Am Chem Soc. 2010;132:9392–9397. doi: 10.1021/ja102296k. [DOI] [PMC free article] [PubMed] [Google Scholar]
- 9.Muramatsu N, Minton AP. Tracer diffusion of globular proteins in concentrated protein solutions. Proc Natl Acad Sci USA. 1988;85:2984–2988. doi: 10.1073/pnas.85.9.2984. [DOI] [PMC free article] [PubMed] [Google Scholar]
- 10.Dix JA, Verkman AS. Crowding effects on diffusion in solutions and cells. Annu Rev Biophys. 2008;37:247–263. doi: 10.1146/annurev.biophys.37.032807.125824. [DOI] [PubMed] [Google Scholar]
- 11.Banks DS, Fradin C. Anomalous diffusion of proteins due to molecular crowding. Biophys J. 2005;89:2960–2971. doi: 10.1529/biophysj.104.051078. [DOI] [PMC free article] [PubMed] [Google Scholar]
- 12.Weiss M, Elsner M, Kartberg F, Nilsson T. Anomalous subdiffusion is a measure for cytoplasmic crowding in living cells. Biophys J. 2004;87:3518–3524. doi: 10.1529/biophysj.104.044263. [DOI] [PMC free article] [PubMed] [Google Scholar]
- 13.Guigas G, Weiss M. Sampling the cell with anomalous diffusion-the discovery of slowness. Biophys J. 2008;94:90–94. doi: 10.1529/biophysj.107.117044. [DOI] [PMC free article] [PubMed] [Google Scholar]
- 14.Metzler R, Klafter J. The random walk’s guide to anomalous diffusion: a fractional dynamics approach. Phys Rep. 2000;339:1–77. [Google Scholar]
- 15.Saxton MJ. Anomalous diffusion due to obstacles: a Monte Carlo study. Biophys J. 1994;66:394–401. doi: 10.1016/s0006-3495(94)80789-1. [DOI] [PMC free article] [PubMed] [Google Scholar]
- 16.Piazza R. Protein interactions and association: an open challenge for colloid science. Curr Opin Colloid In. 2004;8:515–522. [Google Scholar]
- 17.Zhang F, et al. Reentrant condensation of proteins in solution induced by multivalent counterions. Phys Rev Lett. 2008;101:148101-1–148101-4. doi: 10.1103/PhysRevLett.101.148101. [DOI] [PubMed] [Google Scholar]
- 18.Nägele G. On the dynamics and structure of charge-stabilized suspensions. Phys Rep. 1996;272:215–372. [Google Scholar]
- 19.Banchio AJ, Nägele G. Short-time transport properties in dense suspensions: from neutral to charge-stabilized colloidal spheres. J Chem Phys. 2008;128:104903-1–104903-20. doi: 10.1063/1.2868773. [DOI] [PubMed] [Google Scholar]
- 20.Cichocki B, Ekiel-Jezewska ML, Wajnryb E. Lubrication corrections for three-particle contribution to short-time self-diffusion coefficients in colloidal dispersions. J Chem Phys. 1999;111:3265–3273. [Google Scholar]
- 21.van Blaaderen A, Peetermans J, Maret G, Dhont JKG. Long-time self-diffusion of spherical colloidal particles measured with fluorescence recovery after photobleaching. J Chem Phys. 1992;96:4591–4603. [Google Scholar]
- 22.Tokuyama M, Oppenheim I. Dynamics of hard-sphere suspensions. Phys Rev E. 1994;50:16–19. doi: 10.1103/physreve.50.r16. [DOI] [PubMed] [Google Scholar]
- 23.Bée M. Quasielastic neutron scattering. London, United Kingdom: Taylor and Francis; 1988. [Google Scholar]
- 24.Pérez J, Zanotti JM, Durand D. Evolution of the internal dynamics of two globular proteins from dry powder to solution. Biophys J. 1999;77:454–469. doi: 10.1016/S0006-3495(99)76903-1. [DOI] [PMC free article] [PubMed] [Google Scholar]
- 25.Stadler AM, et al. Hemoglobin dynamics in red blood cells: correlation to body temperature. Biophys J. 2008;95:5449–5461. doi: 10.1529/biophysj.108.138040. [DOI] [PMC free article] [PubMed] [Google Scholar]
- 26.Jasnin M, Moulin M, Haertlein M, Zaccai G, Tehei M. In vivo measurement of internal and global macromolecular motions in Escherichia coli. Biophys J. 2008;95:857–864. doi: 10.1529/biophysj.107.124420. [DOI] [PMC free article] [PubMed] [Google Scholar]
- 27.Biehl R, et al. Direct observation of correlated interdomain motion in alcohol dehydrogenase. Phys Rev Lett. 2008;101:138102-1–138102-4. doi: 10.1103/PhysRevLett.101.138102. [DOI] [PubMed] [Google Scholar]
- 28.Stadler AM, et al. From powder to solution: hydration dependence of human hemoglobin dynamics correlated to body temperature. Biophys J. 2009;96:5073–5081. doi: 10.1016/j.bpj.2009.03.043. [DOI] [PMC free article] [PubMed] [Google Scholar]
- 29.Ortore MG, et al. Combining structure and dynamics: non-denaturing high-pressure effect on lysozyme in solution. J R Soc Interface. 2009;6(Suppl 5):S619. doi: 10.1098/rsif.2009.0163.focus. [DOI] [PMC free article] [PubMed] [Google Scholar]
- 30.Busch S, Doster W, Longeville S, Sakai VG, Unruh T. Microscopic protein diffusion at high concentration. MRS Bulletin. 2006:116–117. Quasielastic Neutron Scattering Conference. [Google Scholar]
- 31.Häußler W. Neutron spin echo studies on ferritin: free-particle diffusion and interacting solutions. Eur Biophys J. 2008;37:563–571. doi: 10.1007/s00249-008-0262-7. [DOI] [PubMed] [Google Scholar]
- 32.Roosen-Runge F, et al. Protein diffusion in crowded electrolyte solutions. Biochimica et Biophysica Acta (BBA) - Proteins and Proteomics. 2010;1804:68–75. doi: 10.1016/j.bbapap.2009.07.003. [DOI] [PubMed] [Google Scholar]
- 33.Stadler AM, van Eijck L, Demmel F, Artmann G. Macromolecular dynamics in red blood cells investigated using neutron spectroscopy. J R Soc Interface. 2011;8:590–600. doi: 10.1098/rsif.2010.0306. [DOI] [PMC free article] [PubMed] [Google Scholar]
- 34.Longeville S, Doster W, Kali G. Myoglobin in crowded solutions: structure and diffusion. Chem Phys. 2003;292:413–424. [Google Scholar]
- 35.Doster W, Longeville S. Microscopic diffusion and hydrodynamic interactions of hemoglobin in red blood cells. Biophys J. 2007;93:1360–1368. doi: 10.1529/biophysj.106.097956. [DOI] [PMC free article] [PubMed] [Google Scholar]
- 36.Le Coeur C, Longeville S. Microscopic protein diffusion at high concentration by neutron spin-echo spectroscopy. Chem Phys. 2008;345:298–304. [Google Scholar]
- 37.Jennings BR, Parslow K. Particle size measurement: the equivalent spherical diameter. Proc R Soc Lond A. 1988;419:137–149. [Google Scholar]
- 38.Perrin F. Mouvement brownien d’un ellipsoide-I. Dispersion diélectrique pour des molécules ellipsoidales. J Phys-Paris. 1934;5:497–511. [Google Scholar]
- 39.Zhang F, et al. Protein interactions studied by SAXS: effect of ionic strength and protein concentration for BSA in aqueous solutions. J Phys Chem B. 2007;111:251–259. doi: 10.1021/jp0649955. [DOI] [PubMed] [Google Scholar]
- 40.Svergun DI, et al. Protein hydration in solution: experimental observation by X-ray and neutron scattering. Proc Nat’l Acad Sci USA. 1998;95:2267–2272. doi: 10.1073/pnas.95.5.2267. [DOI] [PMC free article] [PubMed] [Google Scholar]
- 41.Gaigalas AK, Hubbard JB, McCurley M, Woo S. Diffusion of bovine serum albumin in aqueous solutions. J Phys Chem. 1992;96:2355–2359. [Google Scholar]
- 42.Cho CH, Urquidi J, Singh S, Robinson GW. Thermal offset viscosities of liquid H2O, D2O, and T2O. J Phys Chem B. 1999;103:1991–1994. [Google Scholar]
- 43.Abade G, Cichocki B, Ekiel-Jezewska ML. Short-time dynamics of permeable particles in concentrated suspensions. J Chem Phys. 2010;132:014503. doi: 10.1063/1.3274663. [DOI] [PubMed] [Google Scholar]
- 44.Stagg L, Zhang S-Q, Cheung MS, Wittung-Stafshede P. Molecular crowding enhances native structure and stability of α/β protein flavodoxin. Proc Natl Acad Sci USA. 2007;104:18976–18981. doi: 10.1073/pnas.0705127104. [DOI] [PMC free article] [PubMed] [Google Scholar]
- 45.Lee J, Timasheff S. Partial specific volumes and interactions with solvent components of proteins in guanidine hydrochloride. Biochemistry. 1974;13:257–265. doi: 10.1021/bi00699a005. [DOI] [PubMed] [Google Scholar]
- 46.Hunter A, Carta G. Effects of bovine serum albumin heterogeneity on frontal analysis with anion-exchange media. J Chromatogr A. 2001;937:13–19. doi: 10.1016/s0021-9673(01)01301-2. [DOI] [PubMed] [Google Scholar]